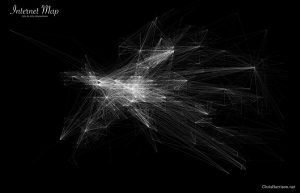
Chris Harrison did a really cool project on internet maps, where he compared internet connectivity of the world, and focused in on North America and Europe especially, as they had the most connections between each other.
Logistically, he mapped out the locations of connectivity by nearest whole number in a coordinate system. The brighter the point, the more points of connectivity there is. Harrison himself says that this approach probably is not indicative of users, as one point of connectivity can have multiple users. However, he chose the data and representation style based on an aesthetic approach, as there are already many other practically modeled ones existing. You can read more about it here.

Internet connectivity of Europe

Internet connectivity of North America

Internet connectivity of the World
I love how delicate the lines are and how orderly the grids look, zoomed in. Because Harrison rounded connectivity locations to nearest longitude and latitude, it looks like it follows a coordinate grid system. The contrast between order and chaos gives the appearance of string art.
![[OLD FALL 2017] 15-104 • Introduction to Computing for Creative Practice](wp-content/uploads/2020/08/stop-banner.png)