//JooHee Kim
//Section E
//jooheek@andrew.cmu.edu
//Project-07


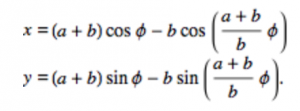
//This project is based on the epicycloid formula
//http://mathworld.wolfram.com/Epicycloid.html
function setup() {
    createCanvas(480, 480);
    angleMode(DEGREES);
}

function draw() {
	background(0,30);

	//moves lines to the middle of canvas
	translate(width/2, height/2);

	//draws 5 curve shapes in different sizes
	for (var curveSize = 0; curveSize < 10; curveSize += 2) {
		//draws lines on every angle of the curve in degrees mode
		for (var i=0; i<360; i++) {

			//variable that remaps mouseX from 0 to 12
			//represents "a" in original formula
			var M = map(mouseX, 0, width, 0, 12);

			//represents "b" in original formula
			var b = 5;

			//variables of line coordinates drawn according to the epicycloid curve formula
			//substitutes with M so that the size and number of petals change according to mouseX
			var lineX1 = curveSize*((M+b)*cos(i-100) - b*cos(((M+b)/b)*i-100));
			var lineY1 = curveSize*((M+b)*sin(i-100) - b*sin(((M+b)/b)*i-100));
			var lineX2 = curveSize*((M+b)*cos(i) - b*cos(((M+b)/b)*i));
			var lineY2 = curveSize*((M+b)*sin(i) - b*sin(((M+b)/b)*i));

			//draw line with variables
			stroke(i, 210, 210, curveSize);
			line(lineX1, lineY1, lineX2, lineY2);
		}
	}

}
After looking at the types of curves that were given to us, I decided to choose the epicycloid. It uses a parametric equation:

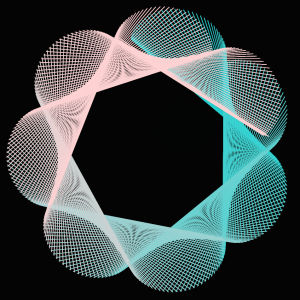
I first tried to figure out how the graph works in coding, and after trying out many options I liked using lines with graph formula. Although I thought this project was simpler than other projects, I found it fun using curve formulas to represent curves in different ways. I first started out with one curve shape but found that putting it in a for loop that varies in sizes makes it more interesting. I also had fun playing with the opacity in both the background and lines.

*There are more curves when looked on the browser than when looked in this WordPress blog.
![[OLD FALL 2017] 15-104 • Introduction to Computing for Creative Practice](wp-content/uploads/2020/08/stop-banner.png)