mmiller5-Project-07

sketch

function setup() {
    createCanvas(480, 480);
    frameRate(30);
    textAlign(CENTER);
    textSize(60);
}

function draw() {
    background(0);
    curves();
    smile();
}

function curves() {
    var cx = width / 2; //center of width
    var cy = height / 2; //center of height
    var t = 400; //iteration count
    var mx = map(min(mouseX, width), 0, width, 2, 5); //x position of mouse map
    var my = map(min(mouseY, height), 0, height, 2, 5); //y pos. of mouse mapped
    strokeWeight(1);
    for (i = 0; i < t; i ++) {
	var col = map(i, 0, t, 0, 255);
	//logarithmic spiral
	var x = (t - i) * cos(radians(i * mx));
	var y = (t - i) * sin(radians(i * my));
	fill(col);
	stroke(255 - col, 200);
	//make a quadrilateral with vertices at 4 spirals in the corners
	quad(x + width / 4, y + height / 4,
	     x + 3 * width / 4, y + height / 4,
	     x + 3 * width / 4, y + 3 * height / 4,
	     x + width / 4, y + 3 * height / 4);
    }
}

function smile() {
    var cx = width / 2; //center of width
    var cy = height / 2; //center of height
    var md = map(min(dist(mouseX, mouseY, cx, cy), 340), 0, 200, 15, -15);
    stroke(0);
    strokeWeight(3);
    noFill();
    //emoji like eyes, uses actual font, changes if mouse is in face
    if (mouseX > width / 4 & mouseX < 3 * width / 4 &&
       mouseY > height / 4 && mouseY < 3 * height / 4) {
	text("> <", cx, cy - 5);
    } else {
	text("| |", cx, cy - 5);
    }
    //smile, changes size with distance of mouse to center beacuse of var "md"
    arc(cx, cy + 30, 50 + (md / 3), 80 + md, 0, PI, CHORD);
}

Hee hee, this was fun.  I used a parametric form of a logarithmic spiral as the base of this program.  I then wanted to experiment with connecting points from different spirals together (in this case, I had 1 spiral in each corner).  I figured a good way to introduce mouseX and mouseY would be to have them affect the period of revolution (with mouseX affecting the x-position and mouseY affecting the y-position).  I thought the movement looked kinda like a snake, and since the center square was pretty barren, I decided to anthropomorphize the curve with a emoji-like smily face.


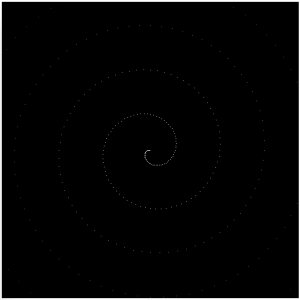
Initial logarithmic spiral (not really visible)

mmiller5-Looking Outwards-07


Google News results by year appear in the physical bar graph, Centograph

Centograph is a dynamic physical bar graph made by Tinker in 2009.  Users type a keyword into a desktop computer connected to Centograph which then searches the Google News Archives for the number of times that word was used in articles since 1909.  Centograph then displays word usage by raising physical bars representing 10 year spans, giving a physical representation of the data.  Centograph is a permanent installation at St. Paul’s School for Boys, which is part of why I think it’s so cool — it’s made specifically for an educational setting.  By turning data from something esoteric into something tangible and cool, it helps to incite a level of interest in the areas of computation and data visualization, especially in students.

mmiller5-Looking Outwards-06


Performance of John Cage’s “Inlets”

“Inlets” is a non-deterministic chance composition composed by John Cage in 1977.  In it, there are three players who hold conch shells of varying sizes filled with water.  By tipping the shells back and forth, it is possible to form bubbles that make a gurgling sound; however, the formation of bubbles is random, causing the piece to be non-deterministic and chance based.  To remove the preferences of the players from the performance, John Cage utilized the novelty of conch shells as an instrument (something the players would have minimal preferences with), helping to ensure that the composition would be more contained and chance based.  I admire John Cage’s re-envisioning of music, that it doesn’t have to be fixed each time that it’s played.  Following the same algorithm for production leads to performances that have the same essence but different products, which I find to be really neat.

mmiller5-Project-06

sketch

//Michael Miller
//Section A
//mmiller5@andrew.cmu.edu
//Project-06

//Coordinates for pandas
var pandaX = [30, 90, 150, 210, 270, 330, 390, 450,
	      30, 90, 150, 210, 270, 330, 390, 450,
	      30, 90, 150, 210, 270, 330, 390, 450];
var pandaY = [298, 298, 298, 298, 298, 298, 298, 298,
	      455, 455, 455, 455, 455, 455, 455, 455, 
	      200, 200, 200, 200, 200, 200, 200, 200];

function setup() {
    createCanvas(480, 480);
    frameRate(1);
    noStroke();
}

function draw() {
    //relates time to ratio of circular motion for sun and moon
    var hourRat = ((hour() + (minute() / 60)) / 24) * 2 * PI;
    var bambooX = [];
    var bambooY = [];
    //darkens during night, brightens during day
    var bgCol = color(49, 49, constrain(160 + 120 * -cos(hourRat), 49, 200));
    background(bgCol);
    //sun
    fill(255, 255, 0);
    ellipse(width / 2 - sin(hourRat) * 200, height / 2 + cos(hourRat) * 200,
	    150, 150);
    //moon
    fill(230);
    ellipse(width / 2 + sin(hourRat) * 200, height / 2 - cos(hourRat) * 200,
	    100, 100);
    fill(bgCol);
    ellipse(width / 2 + sin(hourRat + .2) * 200,
	    height / 2 - cos(hourRat + .2) * 200,
	    75, 75);
    //midground
    fill(116, 116, 55);
    rect(0, 2 * height / 3 - 100, width, 2 * height / 3 - 100);
    //foreground
    fill(154, 116, 55);
    rect(0, 2 * height / 3, width, 2 * height / 3);
    //time tracking mechanics
    bambooFall(width / 2, 2 * height / 3);
    //every hour, a new panda comes to feast on the accumulated bamboo
    for(var i = 0; i < hour(); i ++) {	
	panda(pandaX[i], pandaY[i]);
    }
    bambooGrow(width / 2, 2 * height / 3);
}
//central bamboo grows one stalk per second, making happy pandas
function bambooGrow(x, y) {
    for(var sec = 0; sec < second(); sec ++) {
	    fill(120, 180, 56);
	    rect(x, y - 4 * sec, 3, 3);
	    fill(128, 75, 35);
	    rect(x, y - 4 * sec - 1, 3, 1);
	}
}
//when bamboo gets too tall, it falls in a half circle, stacking up every minute
function bambooFall(x, y) {
    for(var min = 0; min < minute(); min ++) {
	fill(177, 200, 60);
	push();
	translate(x, y);
	rotate(radians(2 + (min / 60) * 176));
	rect(0, 0, 180, 3);
	pop();
    }
}
//panda and its body parts
function panda(x, y) {
    pandaBody(x, y);
    pandaHead(x, y - 40);
}
function pandaHead(x, y) {
    fill(255);
    ellipse(x, y, 50, 50);
    fill(0);
    ellipse(x - 20, y - 20, 15, 15);
    ellipse(x + 20, y - 20, 15, 15);
    ellipse(x - 10, y, 10, 10);
    ellipse(x + 10, y, 10, 10);
    ellipse(x, y + 7, 8, 6);
    fill(255);
    ellipse(x - 9, y - 1, 2, 4);
    ellipse(x + 9, y - 1, 2, 4);
}
function pandaBody(x, y) {
    fill(255);
    ellipse(x, y, 55, 50);
    fill(0);
    ellipse(x - 18, y - 12, 20, 25);
    ellipse(x + 18, y - 12, 20, 25);
    ellipse(x - 19, y + 13, 25, 23);
    ellipse(x + 19, y + 13, 25, 23);
}

Yep, more bamboo.  Why?  I was inspired by the exceptional speed at which bamboo grows, but then I thought, “Now what if it grew super fast?”  The consequences of lightning bamboo are staggering — potential building material, fuel, and of course, food for pandas!  Imagine an infinity ice cream dispenser, except that you never get full (or fat, we’ll ignore that too) — that’s exactly what this is for pandas!  I think word of this would spread pretty quickly, but pandas are slow so they take a while to get there (1 hour exactly, actually.  Punctual pandas).

Now I don’t actually do all that much art, so my product probably doesn’t look as amazing as it could — the pandas are a buncha colored circles — but I think it works.  The coding was pretty fun for this project, and it took me some time to figure out how to make the time countable.  I probably would’ve been more comfortable doing something more abstract, but I thought I’d give this a try, and I think it worked out in the end.

mmiller5-Looking Outward-05


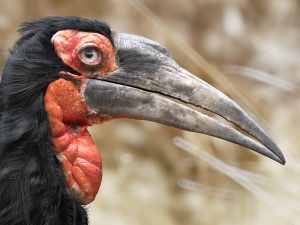
“Southern Ground Hornbill” by Leandre Hounakke

Southern Ground Hornbill is a work by Leandre Hounakke in 2013.  It is a photorealistic 3D rendering of the bird of the same name, meaning that everything was created with 3D software — that’s right, no photos!  I have absolutely no clue how art can be made like this, basically indistinguishable from the real thing, but that’s what makes this amazing!  You can really tell that the artist has an immense attention for detail, especially through the different textures of the feathers, skin, and beak.  I admire the level of skill and mastery that this artist has attained and how he is able to utilize them to create work like this.

mmiller5-Project-05

sketch

//Michael Miller
//Section A
//mmiller5@andrew.cmu.edu
//Project-05

var toggle = [-1,1]; //randomly flip the spiral
var columnNum = 9

function setup() {
    createCanvas(480, 480);
    background(255);
}

function draw() {
    for (var i1 = 0; i1 < columnNum; i1 ++) { //makes rows of bamboo
	x = map(i1, 0, 7, 0, 7 * width / columnNum);
	var yOffset = random(-height / 3, 0); /*each column height will be
						randomly offset*/
	for (var i2 = 0; i2 < 4; i2 ++) { //makes columns of bamboo
	    y = map(i2, 0, 3, 0, 3 * height / 3);
	    bambooDesign(x, y, yOffset);
	}
    }
    noLoop();
}

function bambooDesign(x, y, yOffset) { //makes bamboo segments
    colorFill(x, y, yOffset);
    stroke(0, 25);
    strokeWeight(3);
    fill(200, 204, 153);
    rect(x + .5, y + yOffset - 2.5, width / columnNum - 1, 4);//segment joints
    var spiralX = x + width / (2 * columnNum) + random(-5, 5);
    var spiralY = y + yOffset + height / 6
    var flip = random(toggle);
    spiral(spiralX, spiralY, flip);
}

function colorFill(x, y, yOffset) { //colors each bamboo segment with a gradient
    var size = 1
    for (var iy = size / 2; iy < height / 3; iy += size) {
	for (var ix =  size / 2; ix < width / columnNum; ix += size) {
	    //color of each segment will be the same, so map it to current one
	    r = map(iy + y, y, y + height / 3, 125, 175);
	    g = map(ix + x, x, x + width / columnNum, 125, 200);
	    noStroke();
	    fill (r, g, 0); 
	    ellipse(ix + x, iy + y + yOffset, size, size);
	}
    }
}

function spiral(spiralX, spiralY, flip) { //small spiral ingrained into bamboo
    var angle = 35 - (105 * flip);
    var spiralSize = 200;
    fill(255, 150);
    noStroke();
    push();
    translate(spiralX, spiralY + 60);
    rotate(radians(angle));
    for(count = 0; count < spiralSize; count ++) { //made from many ellipses
	push();
	rotate(radians(flip * 6 * count));
	translate (1, 1);
	ellipse(count/15, count/15, 2, 2);
	pop();
    }
    pop();
}

I was playing around with rectangular tiles that had randomly spaced heights when I thought it looked like bamboo! It then took me way too long to color the segments properly with a gradient, but it worked out in the end. I also wanted to make leaves, but it didn’t pan out, so I have the flowery-ish spirals instead — one of these days though, there will be leaves. Also, the bamboo heights and spiral directions randomize with each refresh.

mmiller5-LookingOutwards-04


The 6000th generation of DarwinTunes sound loops

DarwinTunes is a generative music software first developed by Bob MacCallum in 2009 where melodies are produced in a manner similar to that of natural selection.  Volunteers listen and rate different sound loops generated by the program, and then the most highly rated loops ‘reproduce’, creating a new generation of sound loops which are then subjected to the rating process.  I admire this project because it incorporates human feedback to constantly improve it’s output.  With each new generation of sound loops, they become more and more highly rated and indicative of the musical preferences of those rating them, so it actually closely mirrors the actual development of music genres and preferences over time.

mmiller5-Project-04

sketch

//Michael Miller
//mmiller5
//Section A
function setup() {
    createCanvas(400, 300);
}

function draw() {
    var centerDist =
	min(dist(mouseX, mouseY, width / 2, height / 2), 100);
    var inverseCenterDist =
	min(100 / dist(mouseX, mouseY, width / 2, height / 2), 100);
    /* gradient circle background, use loop to make many progressivley smaller
       circles that are slightly different color */
    for(var count = 0; count < 255; count++) {
	noStroke();
	var countPerc = (1 - count / 255) //percentage of the way through loop
	fill(255 - count);
	ellipse(width / 2, height / 2,
		1.4 * width * countPerc, 1.4 * height * countPerc);
    }
    
    /*Outside curves, as the mouse approaches the center, less iterations occur
      because iteration count is tied to mouse distance from the center*/
    stroke(0);
    strokeWeight(1);
    //top left curve
    curves(0, 0, 0, height / 2, 0, 0,
	   0, -height / 2 / centerDist, width / 2 / centerDist, 0,
	   centerDist, 0);
    //bottom left
    curves(0, 0, 0, height / 2, 0, height,
	   0, height / 2 / centerDist, width / 2 / centerDist, 0,
	   centerDist, 0);
    //top right
    curves(width, height, 0, height / 2, 0, height,
	   0, height / 2 / centerDist, width / 2 / centerDist, 0,
	   centerDist, 180);
    //bottom right
    curves(width, height, 0, height / 2, 0, 0,
	   0, -height / 2 / centerDist, width / 2 / centerDist, 0,
	   centerDist, 180);
    
    //Inside curves, as mouse approaches center, more iterations occur
    stroke(255);
    //bottom right middle curve
    curves(width / 2, height / 2, 0, height / 2, 0, 0,
	   0, -height / 2 / inverseCenterDist, width / 2 / inverseCenterDist, 0,
	   inverseCenterDist, 0);
    //top right middle
    curves(width / 2, -height / 2, 0, height / 2, 0, height,
	   0, height / 2 / inverseCenterDist, width / 2 / inverseCenterDist, 0,
	   inverseCenterDist, 0);
    //bottom left
    curves(width / 2, 3 * height / 2, 0, height / 2, 0, height,
	   0, height / 2 / inverseCenterDist, width / 2 / inverseCenterDist, 0,
	   inverseCenterDist, 180);
    //top left
    curves(width / 2, height / 2, 0, height / 2, 0, 0,
	   0, -height / 2 / inverseCenterDist, width / 2 / inverseCenterDist, 0,
	   inverseCenterDist, 180);
}
/*Generic curve function, x and y are the coordinates of translation, x1 and y1
are coordinates of one line endpoint, x2 and y2 are for the other endpoint, the
x and y steps are how much the coordinates shift after each iteration, limit is
how many iterations will be done, angle is the rotation of the curve*/
function curves(x, y, x1, y1, x2, y2,
		x1Step, y1Step, x2Step, y2Step,
		limit, angle) {
    for (var count = 0; count < limit; count++) {
	push();
	translate(x, y);
	rotate(radians(angle));
	line (x1 + x1Step * count, y1 + y1Step * count,
	      x2 + x2Step * count, y2 + y2Step * count);
	pop();
    }
}
	

I think this turned out pretty well.  Creating a general function for curves made the project much easier and cut down on the coding significantly.  I also wanted to make a gradient in the background, and I was able to use for loops to make that happen which I thought was pretty neat.  I also wanted it to be dynamic, so I had the inner and outer curves have different iteration counts depending on where the mouse was on the screen.

mmiller5_Looking Outward-03

Video of Matthew Plummer-Fernandez’s Botcave workshop projects

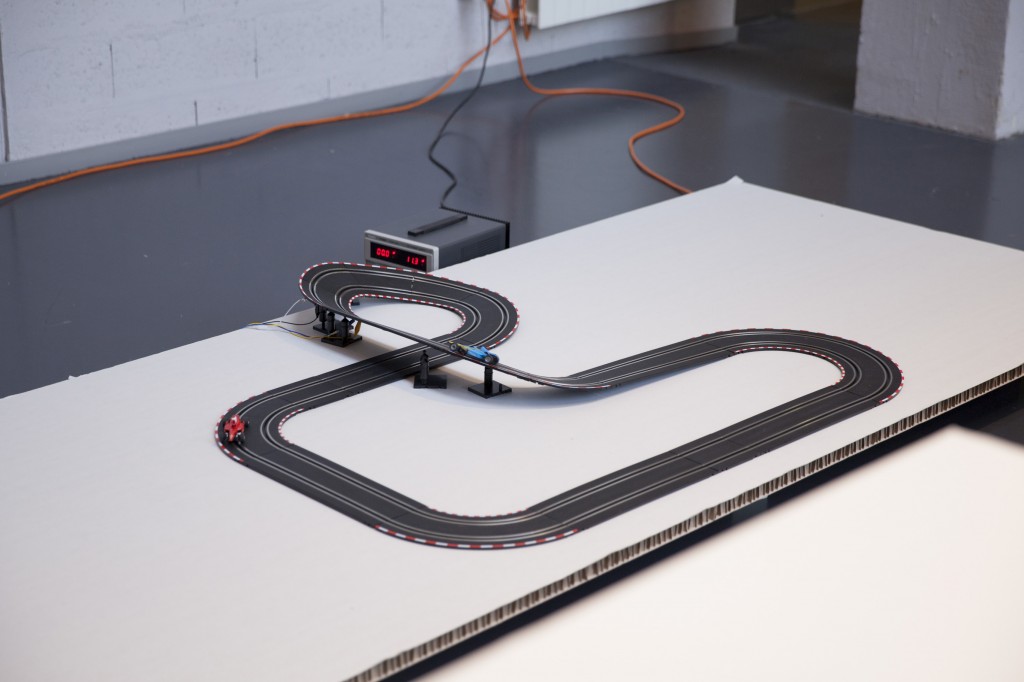
#Good vs #Evil is a project made by Maxime Castelli for Matthew Plummer-Fernandez’s 2014 Botcave workshop.  Using a modified racetrack game, this project advances cars along a track for each instance of #Good and #Evil that bots track on Twitter, with each car corresponding with the different hashtags.  I find this project inspiring because not only is it an interesting physical representation of statistical data (I mean come one, racecars!), but it also updates in realtime, preventing it from staying a static representation.  This method further emphasizes that the artwork is primarily focused in the algorithm itself as opposed to the product it creates because the product is potentially never completed!  It can keep going on and on, culminating in a project more akin to a presentation than a product.

Image of the #Good vs #Evil racetrack

mmiller5_Project-03

sketch

var bg = 0;
var angle = 30;

function setup() {
    createCanvas(640, 480);
}

function draw() {
    //constrain mouse values to be within canvas limits
    var mX = constrain(mouseX, 0, width);
    var mY = constrain(mouseY, 0, height);
    
    //positional variables for circles and squares
    var h1 = height/6;
    var h2 = height/2;
    var h3 = 5 * height/6;
    var w1 = width/8;
    var w2 = 3 * width/8;
    var w3 = 5 * width/8;
    var w4 = 7 * width/8;
    var maxD = 3 * width/8;
    var minD = width/8;
    var diag = dist(w1, h1, w2, h2);
    
    //background gets brighter as mouse moves right
    bg = 255 * (mX/width);
    background(bg);
    
    fill(255 - bg); //opposite color of background
    //enlarge circles as mouse moves near them  //row 1
    var d1 = constrain(maxD - dist(mX, mY, w1, h1), minD, maxD);
    var d2 = constrain(maxD - dist(mX, mY, w2, h1), minD, maxD);
    var d3 = constrain(maxD - dist(mX, mY, w3, h1), minD, maxD);
    var d4 = constrain(maxD - dist(mX, mY, w4, h1), minD, maxD);
    //row 2
    var d5 = constrain(maxD - dist(mX, mY, w1, h2), minD, maxD);
    var d6 = constrain(maxD - dist(mX, mY, w2, h2), minD, maxD);
    var d7 = constrain(maxD - dist(mX, mY, w3, h2), minD, maxD);
    var d8 = constrain(maxD - dist(mX, mY, w4, h2), minD, maxD);
    //row 3
    var d9 = constrain(maxD - dist(mX, mY, w1, h3), minD, maxD);
    var d10 = constrain(maxD - dist(mX, mY, w2, h3), minD, maxD);
    var d11 = constrain(maxD - dist(mX, mY, w3, h3), minD, maxD);
    var d12 = constrain(maxD - dist(mX, mY, w4, h3), minD, maxD);
    //circles //row 1
    ellipse(w1, h1, d1, d1);
    ellipse(w2, h1, d2, d2);
    ellipse(w3, h1, d3, d3);
    ellipse(w4, h1, d4, d4);
    //row 2
    ellipse(w1, h2, d5, d5);
    ellipse(w2, h2, d6, d6);
    ellipse(w3, h2, d7, d7);
    ellipse(w4, h2, d8, d8);
    //row 3
    ellipse(w1, h3, d9, d9);
    ellipse(w2, h3, d10, d10);
    ellipse(w3, h3, d11, d11);
    ellipse(w4, h3, d12, d12);

    //square setup
    noFill();
    strokeWeight(3);
    stroke(255 - bg);
    rectMode(CENTER);   
    //squares rotate when mouse moves up and down
    angle = (mY / height) * 360;  
    //left outside column (of squares)
    push();
    translate(-w1, -h1);
    rotate(radians(angle));
    rect(0, 0, diag, diag);
    pop();  
    push();
    translate(-w1, h2);
    rotate(radians(angle));
    rect(0, 0, diag, diag);
    pop();
    push();
    translate(-w1, height + h1);
    rotate(radians(angle));
    rect(0, 0, diag, diag);
    pop();
    //first column
    push();
    translate(w1, h1);
    rotate(radians(angle));
    rect(0, 0, diag, diag);
    pop();   
    push();
    translate(w1, h3);
    rotate(radians(angle));
    rect(0, 0, diag, diag);
    pop();
    //second column
    push();
    translate(w2, -h1);
    rotate(radians(angle));
    rect(0, 0, diag, diag);
    pop();   
    push();
    translate(w2, h2);
    rotate(radians(angle));
    rect(0, 0, diag, diag);
    pop();   
    push();
    translate(w2, height + h1);
    rotate(radians(angle));
    rect(0, 0, diag, diag);
    pop();
    //third column
    push();
    translate(w3, h1);
    rotate(radians(angle));
    rect(0, 0, diag, diag);
    pop();
    push();
    translate(w3, h3);
    rotate(radians(angle));
    rect(0, 0, diag, diag);
    pop();
    //fourth column
    push();
    translate(w4, -h1);
    rotate(radians(angle));
    rect(0, 0, diag, diag);
    pop();
    
    push();
    translate(w4, h2);
    rotate(radians(angle));
    rect(0, 0, diag, diag);
    pop();

    push();
    translate(w4, height + h1);
    rotate(radians(angle));
    rect(0, 0, diag, diag);
    pop();
    //right outside column
    push();
    translate(width + w1, h1);
    rotate(radians(angle));
    rect(0, 0, diag, diag);
    pop();
    push();
    translate(width + w1, h3);
    rotate(radians(angle));
    rect(0, 0, diag, diag);
    pop();
    
    //center ellipse setup
    fill(bg);
    noStroke();
    var dInner = 30;
    //positional variables, use map to restrict center ellipse to inside circle //row 1
    var x1 = map(mX, 0, width, w1 - d1/2 + dInner, w1 + d1/2 - dInner);
    var y1 = map(mY, 0, height, h1 - d1/2 + dInner, h1 + d1/2 - dInner);
    var x2 = map(mX, 0, width, w2 - d2/2 + dInner, w2 + d2/2 - dInner);
    var y2 = map(mY, 0, height, h1 - d2/2 + dInner, h1 + d2/2 - dInner);
    var x3 = map(mX, 0, width, w3 - d3/2 + dInner, w3 + d3/2 - dInner);
    var y3 = map(mY, 0, height, h1 - d3/2 + dInner, h1 + d3/2 - dInner);
    var x4 = map(mX, 0, width, w4 - d4/2 + dInner, w4 + d4/2 - dInner);
    var y4 = map(mY, 0, height, h1 - d4/2 + dInner, h1 + d4/2 - dInner);
    //row 2
    var x5 = map(mX, 0, width, w1 - d5/2 + dInner, w1 + d5/2 - dInner);
    var y5 = map(mY, 0, height, h2 - d5/2 + dInner, h2 + d5/2 - dInner);
    var x6 = map(mX, 0, width, w2 - d6/2 + dInner, w2 + d6/2 - dInner);
    var y6 = map(mY, 0, height, h2 - d6/2 + dInner, h2 + d6/2 - dInner);
    var x7 = map(mX, 0, width, w3 - d7/2 + dInner, w3 + d7/2 - dInner);
    var y7 = map(mY, 0, height, h2 - d7/2 + dInner, h2 + d7/2 - dInner);
    var x8 = map(mX, 0, width, w4 - d8/2 + dInner, w4 + d8/2 - dInner);
    var y8 = map(mY, 0, height, h2 - d8/2 + dInner, h2 + d8/2 - dInner);
    //row 3
    var x9 = map(mX, 0, width, w1 - d9/2 + dInner, w1 + d9/2 - dInner);
    var y9 = map(mY, 0, height, h3 - d9/2 + dInner, h3 + d9/2 - dInner);
    var x10 = map(mX, 0, width, w2 - d10/2 + dInner, w2 + d10/2 - dInner);
    var y10 = map(mY, 0, height, h3 - d10/2 + dInner, h3 + d10/2 - dInner);
    var x11 = map(mX, 0, width, w3 - d11/2 + dInner, w3 + d11/2 - dInner);
    var y11 = map(mY, 0, height, h3 - d11/2 + dInner, h3 + d11/2 - dInner);
    var x12 = map(mX, 0, width, w4 - d12/2 + dInner, w4 + d12/2 - dInner);
    var y12 = map(mY, 0, height, h3 - d12/2 + dInner, h3 + d12/2 - dInner);
    //center ellipses move corresponding to where mouse is //row 1
    ellipse(x1, y1, dInner, dInner);
    ellipse(x2, y2, dInner, dInner);
    ellipse(x3, y3, dInner, dInner);
    ellipse(x4, y4, dInner, dInner);
    //row 2
    ellipse(x5, y5, dInner, dInner);
    ellipse(x6, y6, dInner, dInner);
    ellipse(x7, y7, dInner, dInner);
    ellipse(x8, y8, dInner, dInner);
    //row 3
    ellipse(x9, y9, dInner, dInner);
    ellipse(x10, y10, dInner, dInner);
    ellipse(x11, y11, dInner, dInner);
    ellipse(x12, y12, dInner, dInner);
}

Oh boy, this took some time, mainly because I was trying to get something to work which never did.  I wanted to focus on basic geometric changes, and I’m excited about how it turned out.