sunmink-Project07-Curves

sketch

//SunMin Kim 
//Section E
//sunmink@andrew.cmu.edu
//project-07 

// http://mathworld.wolfram.com/Epicycloid.html

function setup() {
  createCanvas(480, 480);
  frameRate(10); 
}

function draw() {
  background(139, 181, 115);
  //drawing is moving in the center 
  translate(width/2, height/2); 
 
  //draw the curve 
  drawEpitrochoid();

}

function drawEpitrochoid() {  
    var nPoints = 500; 
    strokeWeight(1);
    fill(86, 149, 204); 
    stroke(228, 213, 110);  

    var x; 
    var y;
       
    var h = constrain(mouseY, 0, 480); 
    //radius of bigger ellipse 
    var a = mouseX / 2; 
    //radius of smaller ellipse
    var b = mouseX / 400; 

   
    beginShape();
    for(var i = 0; i < nPoints; i ++){
        var t = map(i, 0, nPoints, 0, TWO_PI);
        //epitrochoid equation (x position)
        var x = (a + b) * cos(t) - h * cos (((a+ b)/b)*t); 
        //epitrochoid equation (y position)
        var y = (a + b) * sin(t) - h * sin (((a+ b)/b)*t); 
           
        vertex(x, y);
    }

    endShape();
}

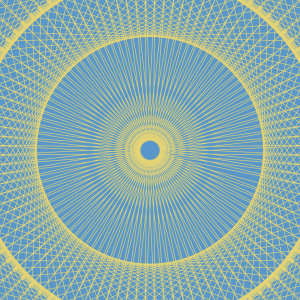
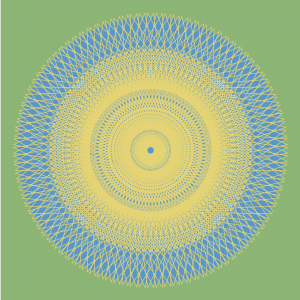
For this project, after reading the sample codes, I was excited to create art using various curves. Thus I took benefit of the formula provided in Wolfram Mathworld website and created this project. Throughout this project, I struggled the most when thinking about appropriate values for each variable. I feel good with the outcome that I successfully used each variable to display what I wanted to show.

sunmink-LookingOutwards-07


Dear Data by, Georgia Lupi and Stefani Posavec http://www.dear-data.com/all/

Stefanie Posavec is a designer who works with data projects that are related to language, literature, or science. She uses data as a source visualize hand-crafted works. One of her most admirable work is “Dear Data”, which is a collection of postcards that includes data that shows something about two people’s personalities. This project began when Lupi and Posavec were curious if they could know each other by few colored pens marked on the postcards. By spending hours on each postcard they could make a detailed postcard that enables them to share their personalities. Lupi mainly encoded data in a way that presents different noises she heard in 32 weeks, and Posavec’s card was filled with brightly colored rectangles.

I was excited to see some of the postcards they made because I have not seen many data visualizations that use color encoding to represent certain emotions or condition. The algorithm generated in their work is human thoughts to programme and display data through visualization. After seeing many works based on mathematically generated algorithms, it was refreshing to understand the data through a different perspective.

sunmink-project06-Abstract Clock

sketch

//SunMin Kim 
//Section E
//sunmink@andrew.cmu.edu
//Project 06 

function setup() {
    createCanvas(480, 480);
}

function draw() {
    //show the current time 
    var h = hour(); 
    var m = minute(); 
    var s = second(); 
    
    //color of the ocean changes depending on hours 
    var mapH = map(h, 0, 25, 0, 255);
    background(mapH, 220, 250); 

    noStroke();
    //tail 
    fill(230, 150, 70);
    rect(365, 270, 80, 100, 40, 20, 20, 40);
    //body
    fill(230, 150, 70);
    rect(50, 230, 320, 180, 20, 20, 20, 20);
    //eyes 
    fill(255); 
    ellipse(120, 300, 50, 50);
    //pupill
    fill(0);
    ellipse(122, 292, 30, 30);
    //bubble1
    fill(255);
    ellipse(110, 50, 20, 20);
    //bubble2
    fill(255);
    ellipse(105, 160, 20, 20);
    //bubble3
    fill(255);
    ellipse(130, 110, 20, 20);


    //changes form 24 hour to 12 hour clock 
    if (h == 0){ 
        h = 12; 
    } else if (h > 12 & h < 24){ 
        h -=12; 
    } else{ 
        h = hour(); 
    }
   
    //draw hair every second 
    for (var c = 0; c <= s; c++){
        strokeWeight (2.5); 
        stroke(255); 
        line(80 + 6 * c, 190, 63 + 5 * c, 230);
    }

    //size of mouth gets larger depending on the minutes
    var mapM = map(m, 0, 100, 0, width); 
    noStroke(); 
    fill(230, 80, 100);
    rect(50, 350, mapM, 50, 5, 5, 5, 10);
  
    fill(0);
    textSize(8);
    text( h + " hour(s) " + m + " minute(s) " + s + " second(s) ", 20,20);
}


After finishing assignments using index variables, I was excited to create an abstract clock that transforms according to hours, minutes, and seconds. Thus for the abstract clock, I wanted to take benefit of making a clock that is interesting to watch more than few seconds.  Throughout this project, I struggled the most when coming up with triangle coordinates. I feel good with the outcome that I successfully used triangles for this wallpaper which was the most challenging part during the project.

Throughout this project, I struggled the most to come up with types of design that allows me to indirectly display the time flow. However, I felt great to successfully use different parts in the fish to represent the time flow.

sunmink-LookingOutwards-06

The inaugural exhibition, XYZT: Abstract Landscapes is a beautiful and profound exhibition that is created by a group of artists and engineers cooperating under the name of Adrien M & Claire B, which is led by Adrien Mondot and Claire Bardainne. XYZT that is named after four dimensions (horizontality, verticality, depth, and time) performs 10 works that are supported by a distinctive mathematical algorithm. The giant screen with sensors forms “could” of pixels and performers can interact with the projections during the show.

I am interested in XYZT exhibition because I have seen other exhibition or design using the computational algorithm, but I have not seen performances using the mathematical algorithm during the show. It is special because when planning for the performance, randomness of computational art is hard to predict. With the artists and engineers now the computational algorithm can be fully used for the performance using the randomness of the algorithm.

sunmink-Project-05-Wallpaper

sketch

//SunMin Kim 
//Section E
//sunmink@andrew.cmu.edu
//project-05

function setup() {
    createCanvas(480, 480);
    background(222, 141, 148);
    var tw = 50;  
    var th = 50;  
    var y = 100; 
    var x = 100; 

    noStroke(); 

    for (var y = 0; y < 8; y++) {
        for (var x = 0; x < 8 ; x++) {
            var posy = y + y * 1.3 *th + 15; 
            var posx = x + x * 1.1 *tw;  

            //ice cream top 
            fill(240, 230, 180);
            ellipse(posx + 50, posy + 9, 18, 19); 

            //sprinkles 1 on ice cream 
            fill(226, 161, 73);
            rect(posx + 54, posy + 4, 3, 2); 

            //sprinkles 2 on ice cream 
            fill(210, 61, 59);
            rect(posx + 48, posy + 4, 3, 2); 

            //sprinkles 3 on ice cream 
            fill(56, 83, 168);
            rect(posx + 52, posy, 3, 2); 


            //ice cream cone 
            fill(158, 65, 65);
            triangle(posx + 60, posy + 10, posx +40, posy + 10, (tw*sqrt(3)/2) + posx -10 , posy+th);
        }
    }
    noLoop();
}

function draw() { 
}


After finishing assignments using for() loops, I was excited to create patterns instead of inputting individual functions. Thus for the wallpaper, I wanted to take benefits of for() loop and create a creative wallpaper I want to purchase. I first created the ice-cream cone and followed by ice-cream and sprinkles on it.

Throughout this project, I struggled the most when coming up with triangle coordinates. I feel good with the outcome that I successfully used triangles for this wallpaper which was the most challenging part during the project.

sunmink-LookingOutwards-05

Manfred Mohr created a Computer-Generated Art that captures a hypercube in 2D. Once users type something in the search engine such as Google, users’ text goes through an algorithm and proceed an outcome that matches what users put in. This algorithm is an equation that is a set of operations mathematically built to create particular tasks.

Thus, through this algorithm, users are able to create an abstract visual art. I admire the artist Manfred Mohr because he is a pioneer of computing art who continuously explores through a varied collection of algorithmic-based artworks drawn by a computer. He has produced several algorithmic-based works such as algorithmic music in the 60s and algorithmic-based artworks called “Artificiata II.”

“Artificiata II” is an artwork that I am most interested in because it is pulled out from a design concept that he created called “diagonal path.” It is interesting to see how he used this algorithm to build a hard-line abstract shape into a hypercube drawn randomly between 11 and 15 dimensions. With his artistic sensibilities, he could convert a simple abstract shape into an impressive artwork using the randomness of the algorithm.


sunmink- Looking Outwards- 04

The origin of word ‘entropy’ came from the Greek word meaning transformation. The sound artist fraction collaborates with louis philippe starnault, naure graphique, and creation ex nihilo to perform a mesmerizing music installation. The installation that provides the sound includes over 6000 distinctive pixels that can transform on order.

When playing his music, fraction absorbs the audience by introducing them an intense-audio-visual experience. He usees sound spatialization, direct light, and projections to enable the audience to fully experience the ‘Entropia.’ I admire this artifact itself because it is an interactive product made by a collaboration of MadMapper, TouchDesigner, Resolume, MaxMsp, Ableton Live, Lemur and IanniX who created algorithms that can illuminate the spherical structure and also built RGB LED strip that is the skeleton of ‘entropy.’ The experience of ‘entropy’ is created through an algorithm that is programming signal based on the pressurized soundtrack. The signals are converted into noise and the luminous behavior during the performance.


sunmink-Project04-string-Art

sketch

//Sun Min Kim 
//Section E
//sunmink@andrew.cmu.edu
//project04-stringart 

var x1 = 50; //x of line
var y1 = 0; //y of line 

function setup() {
    createCanvas(400, 300);
}

function draw() {
    background(190, 100, 120);

    var r = acos(height, width); //rotating angle 

    for (var i = 0; i <800; i +=30) {
    	strokeWeight(1); 
    	rotate(r); 

    	stroke(191, 61, 80); //top red line 
    	line(400 , i / 8, i / 6, 2); 

    	stroke(191, 20, 130); //left pink line 
    	line(0, i / 3, i, 200);

    	stroke(130, 100, 140);
    	line(x1 + 250, y1, i/2 -300, 400); //left purple line 

    	stroke(255); 
    	line(x1 + 340, y1, i/2 -100, 400); //right white line 

    	stroke(245);
    	line(x1 - 100, width/2  , i - 300, 300); //bottom grey line 


    }

}

For this project, I started off with simple straight lines because I was not sure how function for () is going to act on this problem. However, as I gained confidence in using for (), I could build more layers of strings step by step. It was very interesting to create curves without curve vertex function and I look forward to learning many other ways to build similar result.

sunmink-LookingOutwards-03

PolyThread Textile Pavilion is an architectural installation that is designed by Jenny E.Sabin. This installation is part of the Cooper Hewitt Smithsonian Design Museum exhibition, which focuses on aesthetic innovation. PolyThread Textile Pavilion is a seven-foot-tall-square-foot knitted textile structure that is in shape of the rippled dome with the underlying structure made up of aluminum tubes. It illuminates under the control of ETC Express LPC, which is a lighting Playback Controller that runs the day-to-night lighting sequence. Using the computation, Sabin successfully fabricates her inspirations into an art.

I admire the designer Sabin for her innovative idea to combine her inspirations from nature and mathematics which are not a common marriage. Experimenting new material as well as methods to create her works, Sabin also plans to help parts of the world where there is little or no access to electricity by studying the “PolyThread” which is a potential solution for portable and lightweight electricity.

sunmink-Project03-Dynamic-Drawing

sketch

//SunMin Kim 
//Section E
//sunmink@andrew.cmu.edu
//project-03 

//variables for background elements
var smokecolor = 255; 
var angle = 0; 

function setup() {
  createCanvas(640, 480);
}

function draw() {
  //Sky
  background(209, 234, 254);
  noStroke(0);

  //Greens 
  fill(109, 195, 50); 
  rect(0, 380, 640, 300); 

   //Tree trunks 
  fill(84, 78, 38);
  rect(20, 270, 20, 120);
  rect(60, 270, 20, 120);
  rect(100, 270, 20, 120);
  rect(140, 270, 20, 120);
  rect(180, 270, 20, 120);
  rect(220, 270, 20, 120);
  rect(260, 270, 20, 120);

  //Tree leaves 
  fill(135, 140, 30); 
  ellipse(30, 230, 50, 130);
  ellipse(110, 230, 50, 130);
  ellipse(190, 230, 50, 130);
  ellipse(270, 230, 50, 130);

  fill(135, 170, 30); 
  ellipse(70, 230, 50, 130);
  ellipse(150, 230, 50, 130);
  ellipse(230, 230, 50, 130);

  //Smokes move and change their color depending on position of mouseX 
  translate ((width) - mouseX * 1.5, 20); 
  fill (mouseX - smokecolor); 

   
  ellipse( 90, 150, 100, 100); 
  ellipse( 120, 150, 100, 100); 
  ellipse( 140, 120, 100, 100); 
  ellipse( 160, 120, 100, 100); 
  ellipse( 150, 180, 100, 100);
  ellipse( 190, 100, 100, 100);  
  ellipse( 220, 180, 100, 100);  
  ellipse( 220, 120, 100, 100); 
  ellipse( 250, 100, 100, 100); 
  ellipse( 290, 180, 100, 100); 
  ellipse( 220, 150, 100, 100); 
  ellipse( 260, 120, 100, 100); 
  ellipse( 260, 100, 100, 100); 
  ellipse( 230, 120, 100, 100); 
  ellipse( 250, 150, 100, 100);
  ellipse( 290, 80, 100, 100);  
  ellipse( 320, 130, 100, 100);  
  ellipse( 420, 170, 100, 100);  
  ellipse( 450, 120, 100, 100); 
  ellipse( 490, 180, 100, 100); 
  ellipse( 420, 150, 100, 100); 
  ellipse( 390, 80, 100, 100); 
  ellipse( 320, 100, 100, 100); 
  ellipse( 460, 100, 100, 100); 
  ellipse( 490, 150, 100, 100);  
  ellipse( 380, 170, 100, 100);  
  ellipse( 520, 150, 100, 100); 
  pop(); 

   //sun move depending on position of mouseX 
  translate ((width) - mouseX * 0.5, 60); 
  rotate (radians(angle));
  fill (236, 188, 0); 

  //sun changes its size, and constantly rises the angle in following angle + 0.2 
  ellipse(mouseX - 250, 30, (mouseX + 200)/ 5, (mouseX + 200)/ 5);
  angle = angle + 0.2;


}


After creating pong game, I became more interested in coding that can carry a narrative. Thus for the dynamic drawing, I wanted to put in a storyline. I first created a forest and then made smokes that are created before the sun arose.

Throughout this project, I struggled the most when coming up with a story and actualizing it. I feel good with the outcome I came up with and I am excited to create more interactive drawings with more variations.