yoonyouk-project07-curves

sketch

//Yoon Young Kim
//Section E
//yoonyouk@andrew.cmu.edu
//Project07

var a = 50; //size of the rose curve
var nPoints = 100; //number of points on the curve

function setup(){
    createCanvas(480, 480);
    frameRate(10);
    noLoop();
}

function drawRoseCurve() {
    background(207, 212, 255); // blue background color

    stroke(145, 85, 112); //dark purple outline color
    strokeWeight(5);
    fill(204, 120, 157); //dusky pink fill color

    var t; //theta of the equation
    
    push();
    beginShape();

    translate(width/2, height/2);
    for(i = 0; i<mouseX; i++){ //number of points drawn based on the movement of mouseX
        var t = map(i, 0, mouseX + 40, 0, TWO_PI); //polar equation for the Rose Curve

      
        var r;
        var n = 4; // number of petals - when n is even, the function turns to 2n, therefore will create 8 petals

        r = a*cos(n*t); // drawing the Rose curve
        
        x = r *cos(t); //converting from polar to Cartesian
        y = r *sin(t); //converting from polar to Cartesian
        vertex(x, y);

    }
    endShape();
    pop();

}

function mouseMoved() {
    a = a + 1; //increasing the size of the flower when the mouse moves
    if(a>200){
        a=50;
    }
    drawRoseCurve();
}

I thought it was originally difficult to plug in the curve equations since we had to consider radians and Cartesian vs. polar equations. I wanted to do a rose curve because I was interested in how the lines would loop around in a flower like shape. In order to integrate the mouse movement with my curve I used the map function in order to determine the number of points of my curve. Therefore, as you move the mouse back and forth the loops will draw or undraw depending on the movement. Unfortunately, I was still unable to figure out how to make the entire curve close properly.

yoonyouk-lookingoutwards-07

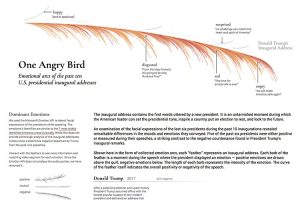
This week’s looking outwards I focused on the work of Periscope, a company that focuses on data collection and visualization. Their goal is to send a message to their audiences and engage the public. Their visualization of data is very unique and provides a creative outlook data trends. For example, in data collection titled, “Most Negative Inaugural Speech in Decades.” I thought this data collection was unique in many ways – one being that they made quantitative data of facial expressions. Microsoft API was used to detect facial expressions while the presidents were speaking. A unique algorithm must have been crafted in order to detect facial expression and then determine whether it is positive or negative. They then combined all of the emotions into an arc like formation, creating a feather-like graph.

Above is the graph for President Trump’s inaugural speech. The graph shows a lot of negative emotions arising.

Rather than taking a typical approach of data visualization, such as a bar graph of a pie chart, the designers utilized a unique shape that still represented the appropriate data. When clicking on the individual strokes of the feather, users were able to detect the specific feelings felt during the speech.


yoonyouk-project06-abstractclock

sketch

function setup() {
    createCanvas(300, 480);
    background(162, 220, 254);

    angleMode(DEGREES);
}

function draw() {
background(162, 220, 254);

var H = hour();
var M = minute();
var S = second();

    
    var mappedH = map(H, 0,23, 100, 500);
    var mappedM = map(M, 0, 59, 0, 400);
    var mappedS = map(S, 0, 59, 0, 480);

    noStroke();

    //background sky color - seconds
    //the darker blue dropping down on the canvas indicates the seconds
    fill(111, 173, 254);
    rect(0, 0, width, mappedS);


    //stem - minutes
    //growth of the stem indicates the greater minutes
    //the taller the stem, the more minutes
    fill(100, 212, 126);
    rect(width/2-10, height, 20, -1* mappedM);

    //sunflower petals = hours
    //the number of petals indicates the hour of the time

    if(H==0){
        H=12;
    }

    if(H<24 & H>12){
        H-=11;
    }
 
    for (var i=1; i<H; i++){
        push();
        translate(width/2, height-mappedM);
        rotate(30*i);
        strokeWeight(30); 
        stroke(255, 208, 54);
        line(0, 0, 0, -75);
        pop();
    }


    //sunflower head
    noStroke();
    fill(112, 84, 69);
    ellipse(width/2, height-mappedM, 100, 100);


}

I was inspired to use a sunflower as my abstract clock when researching Kircher’s sunflower clock. Although Kircher used the orientation and the position of the sunflower to determine time, I decided to use the physical characteristics of the sunflower to indicate the seconds, minutes, and hours.

yoonyouk-lookingoutwards-06

Pictooptic.com

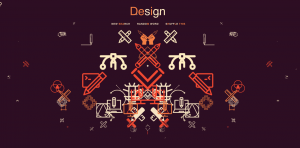
By entering any word into the wordsearch, this website generates a random collage of icons related to the word. The arrangement of the icons are also random.

Pictooptic is a website that randomly generates icons and objects that relate to any searched or random word. The icons are then arranged in a mirror arrangement in which float into space. They can be dragged depending on the movement of the mouse. By clicking “shuffle this,” the arrangement changes into a random arrangements of color and organization. The site also includes a “random word” option where a random word is generated and new icons are brought about.

I like the spontaneity and whimsical nature of the generator. No two icons are the same and instead of a random cloud of icons, the arrangement is mirrored. In addition, the additional random color scheme adds to another surprising factor. I thought it was a creative way to generate a unique collage of items. The algorithms of the project would generate the random spatial arrangement and then have that arrangement mirrored across the canvas.


yoonyouk-LookingOutwards-05


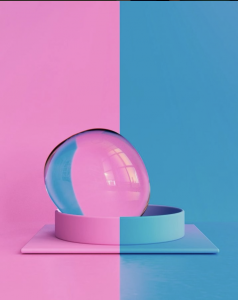
One of Frank Guzonne’s 3D work displayed on his Instagram(https://www.instagram.com/p/BZJdCaPh_5M/?taken-by=fjg_3d)

For this week’s Looking Outward I focused on the 3D graphic computational artwork of Frank J. Guzonne whose works have popped up on my Instagram feed recently. His works are very flamboyant with his color choices been great and his graphics being quirky. He takes seemingly simple and mundane every day objects and plays around with dynamic movement and lighting in order to create a pleasantly unexpected graphic video work. It seems for each project he makes a unique algorithm that would determine how objects would move in relation to each other and the lighting. Guzonnes 3D renderings allows for creative explorations of fictitious animations.

Although we are currently working on 2D objects, I like how computation can bring about 3D movement and work. This opens up a new creative window in making animation work. I thought this kind of computing would be particularly useful for not only animation but also generating potential real life situations.

yoonyouk-project05-wallpaper

sketch

function setup() {
    createCanvas(480, 480);
    background(255, 213, 238);

    for(var x = 0; x < 500; x+=100){
        for(var y = 0; y < 500; y+=100){
            cacti(x,y);

        }
    }

}


function draw() {
    cacti();

}


function cacti(x,y) {
    noStroke();
    fill(255, 185, 71);
    ellipse(x+50, y-20, 20, 20);

    //clouds
    noStroke();
    fill(131, 175, 226);
    ellipse(x+20, y-10, 15, 15);
    ellipse(x+30, y-5, 20, 20);
    ellipse(x+45, y-10, 26, 26);
    ellipse(x+60, y-10, 15, 15);

   //cacti
   stroke(99, 212, 136);
    strokeWeight(15);
    line(x, y-10, x, y+60);
    line(x-20, y-10, x-20, y+10);
    line(x-20, y+10, x-10, y+10);
    line(x+10, y+30, x+25, y+30);
    line(x+25, y+30, x+25, y);

    //needles
    stroke(255, 185, 71);
    strokeWeight(4);
    line(x-3, y, x-3, y+10);
    line(x-1, y+20, x-1, y+40);

    //sun
    /*noStroke();
    fill(255, 185, 71);
    ellipse(100, 30, 20, 20);

    //clouds
    noStroke();
    fill(131, 175, 226);
    ellipse(70, 40, 15, 15);
    ellipse(80, 45, 20, 20);
    ellipse(95, 40, 26, 26);
    ellipse(110, 40, 15, 15);

   //cacti
   stroke(99, 212, 136);
    strokeWeight(15);
    line(50, 40, 50, 110);
    line(30, 40, 30, 60);
    line(30, 60, 40, 60);
    line(60, 80, 75, 80);
    line(75, 80, 75, 50);

    //needles
    stroke(255, 185, 71);
    strokeWeight(4);
    line(47, 50, 47, 60);
    line(49, 70, 49, 90);*/
}

I initially started out by creating a tile of the cacti in the desert scene with the cloud and the sun. By making this tile its own function, I was then able to make it repeat using for loops. It was very interesting to make a drawing its own function in order to repeat it throughout the canvas.

yoonyouk-project04-stringart

sketch

//Yoon Young Kim
//Section E
//yoonyouk@andrew.cmu.edu
//project04-stringart

var x = 0;
var y = 10;

function setup() {
    createCanvas(400, 300);
    background(0);
    strokeWeight(2);    
    for(var i = 0; i<200; i+=5){
    //red line
    stroke(247, 38, 81, 95);
    line (6*i, height, width, height-2*i);

    //yellow line
    stroke(247, 219, 29, 95);
    line (6*i, height, width, height-6*i);

    //green line 
    stroke(55, 156, 121, 100);
    line (0, 5*i, 5*i, 299);


    //blue line
    stroke(66, 126, 226, 95);
    line (0, 5*i, 5*i+100, 299);
    }

//CUBE
changeX = 20;
changeY = 20;
    // purple line

    translate(100, -25);
    stroke(181, 52, 255);
    strokeWeight(2);
    x1 = 20;
    y1 = height/2 - 25;
    x2 = 70;
    y2 = height/2;
    for (var i = 0; i<9;i++){
    line(x1 + changeX, y1, x2 + changeX, y2);
    changeX += 10;
    }

    //magenta line
    stroke(181, 39, 103);
    strokeWeight(2);
    x1 = -20;
    y1 = 150;
    x2 = -20;
    y2 = height/2 + 75;
    for(var i = 0; i<9;i++){
    line(x1+changeX, y1, x1+changeX, y2);
    changeX +=10;
    }

    //violent line
    stroke(64, 50, 130);
    strokeWeight(2);
    x1 = -160;
    y1 = 105;
    x2 = -160;
    y2 = 180;
    for(var i = 0; i<5;i++){
    line(x1 + changeX, y1 + changeY, x2 + changeX, y2 + changeY);
    changeX += 10;
    changeY += 6; 
    }
}

function draw() {
}

I found this project particularly difficult because, unlike the previous projects, we cannot simply plug in different values. It was very confusing when I though I added the appropriate values. However, once I understood how to use loops I realized how much easier it is to use rather than drawing out many different lines individually.

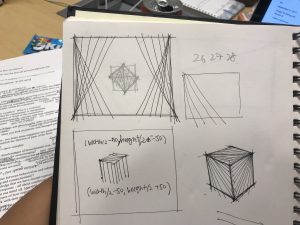
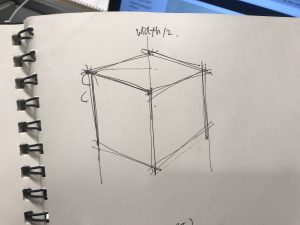
Originally my plan was a little more complicated than the final product; however, I was still able to achieve something that looks like a cube.

yoonyouk-LookingOutwards-04


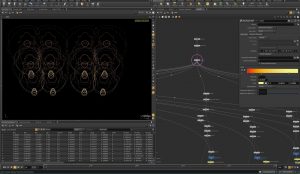
Using Beethoven’s ballet with Houdini to create generative art, artist Simon Russell used this project in order to combine both visuals and audio. Each visual takes pitch and speed into consideration. These characteristics determine the shape and the amplitude. Rather than animating every little piece individually, this piece is dependent on generative factors.

From the clapping at the beginning, to the maestro, to the composition and organization of the generative art, Russell sets the scene of the orchestra. This generative art piece seems to display the different instruments or components of the orchestra. Russell explores the different colors that would represent each component. Rather than being completely obvious with instrument of music forms, he successfully uses abstract shapes that go along with the music. He did not just utilize music notes but also sound waves to make everything look cohesive.

yoonyouk-project03-dynamicdrawing

sketch_project03

//Yoon Young Kim
//Section E
//yoonyouk@andrew.cmu.edu
//Project-03

function setup() {
    createCanvas(640, 480);
    background(256);

}

function draw() {

    angleMode(DEGREES);

    var a = mouseX
    var b = mouseY

    //underwater background change
    //This will change the color values as the mouse moves down
    //Water will change into a darker blue
    var Rx = map(b,0,height,116,20);
    var Gx = map(b,0,height,188,21);
    var Bx = map(b,0,height,252,138);

    noStroke();
    fill(Rx, Gx, Bx);
    rect(0, 0, 640, 480);

    
    //SCUBA DIVER
    // The tiny figure will follow the mouse
    
    //head
    noStroke();
    fill(13, 0, 69);
    ellipseMode(CENTER);
    ellipse(a, b+10, 40, 40);
   
   //eyes
    stroke(247, 209, 9);
    strokeWeight(3);
    fill(224, 162, 115);
    rect(a-15, b+5, 30, 15);

    //eyeballs
    noStroke();
    fill(0);
    ellipse(a-5, b+15, 5, 5);
    ellipse(a+5, b+15, 5, 5);


    //body
    noStroke();
    fill(13, 0 , 69);  
    rect(a-20, b+25, 40, 60);


    //SCUBA DIVER ARMS/LEGS

    //left hand
    //left hands moves from 80 below the mouse to 5 above the mouse
    var lefthand = map(b, 0, height, b+80, b-5);

    stroke(13, 0, 69);
    strokeWeight(5);
    line(a-15, b+40, a-50, lefthand);

    //moving the right hand
    //right hands moves from 80 below the mouse to 5 above the mous
    var righthand = map(b, 0, height, b+80, b-5);

    stroke(13, 0, 69);
    strokeWeight(5);
    line(a+15, b+40, a+50, righthand);


    //left leg

    //moving left foot in a rotating manner using mapping
    var leftfootX = map(b, 0, height, a-15, a-70);
    var leftfootY = map(b, 0, height, b+140, b+60);
    stroke(13, 0, 69);
    strokeWeight(5);
    line(a-15, b+80, leftfootX, leftfootY);


    //right leg
    //moving right foot in a rotating manner using mapping
    var rightfootX = map(b, 0, height, a+15, a+70);
    var rightfootY = map(b, 0, height, b+140, b+60);
    stroke(13, 0, 69);
    strokeWeight(5);
    line(a+15, b+80, rightfootX, rightfootY);

    //SMILE
    noFill();
    if (b < 100){
    stroke(247, 72, 79);
    strokeWeight(2);
    arc(a, b+20, 5, 5, 0, 180);
    }

    if (b >= 100 & b < 300){
    stroke(247, 72, 79);
    strokeWeight(2);
    ellipse(a, b+20, 5, 5);
    }
    
    if (b >= 300 & b <= 480){
    stroke(247, 72, 79);
    strokeWeight(2);
    arc(a, b+20, 5, 5, 180, 360);
    }

    //BUBBLES
    //bubble1

    //bubble location
    var bubbleX = a+40;
    var bubbleY = b-20;

    //expanding the bubble sizes as the mouse moves up and down
    var bubbleSize = map(b, 0, height, 2,25);
    noStroke();
    fill(160, 222, 255);
    ellipse(bubbleX, bubbleY, bubbleSize, bubbleSize);

    //bubble2
    var bubbleX = a+60;
    var bubbleY = b-50;
    var bubbleSize = map(b,0,height,4, 40);
    noStroke();
    fill(160, 222, 255);
    ellipse(bubbleX, bubbleY, bubbleSize, bubbleSize);
   

}


I wanted to create a small animated cartoon drawing for this assignment and thought a scuba diver as the subject would be appropriate. Because scuba divers swim in deep depths, I explored changing the image elements dependent on the mouse moving up or down, mouseY. This project allowed me to explore change in color, size, and position of the different components to complete a cohesive dynamic drawing.

yoonyouk-LookingOutwards-03

thinktank and the life aquatech: water generative design

Designing a structure based on the behaviors of water

This project was created by the students of the Architectural Association School of Architecture in London. They derived the shape from studying fluid liquid movements – the way it moves, how it shapes it self in containers, how it reacts on surfaces. The flow and direction of the structure are particularly noted for the final creation also takes into account of the water cycle.

I like how the project takes a very natural elements and uses that to base the structure. Not only is the shape unique and interesting, the structure also takes account the of human interaction and comfort. When it rains, the sculpture is also designed to collect, distribute, and store water, thus also providing a environmental friendly piece. I usually expect very stiff or geometric forms when it comes to a computational piece; however, I enjoy how this piece integrates the environment as inspiration and saves rain water while inside, people can appreciate markets, plazas, and other enjoyments.

The artists definitely used a unique algorithm to measure something as fluid as water in order to study the movements and directions.