mstropka Final Project E (FIXED)

sketch

//Name: Max Stropkay
//Andrew ID: mstropka@andrew.cmu.edu
//Section: E
//Final Project

//decalare variables for font, and audio file
var avenir;
var littlewing;

//array to store vehicle objects
var vehicles = [];

//diameter of circles
var diameter;

//store the value of the amplitude of the audio file
var amplitude;

//array to store the strings that make up the lyrics
//of the song
var lyrics = ['little wing', 'well','shes','walking','through',
  'the','clouds','with a', 'circus', 'mind', 'thats','running', 'round',
  'butterflies', 'zebras', 'moonbeams', 'fairytales',
  'thats all', 'she ever', 'thinks about', 'riding with', 'the', 'wind', 'when',
  'Im sad', 'she comes', 'to me', 'with a', 'thousand', 'smiles', 'she',
  'gives to', 'me', 'free','its alright', 'she said', 'its alright', 'take',
  'anything', 'you', 'want', 'from me', 'anything'];

//array to store the times at which the lyrics
//should appear on screen
var times = [34000, 500, 500, 3000, 500, 500, 2000, 200, 300, 3000, 500,
  500, 3000, 1500, 1500, 2000, 3000, 3000, 300, 300, 300, 2000, 4000,
  500, 500, 3000, 500, 500, 2000, 200, 300, 3000, 500,
  500, 3000, 1500, 1500, 2000, 3000, 3000, 300, 300, 2000, 300, 18000];

var word = -1;

//load soundfile and font
function preload() {
  littlewing = loadSound('https://courses.ideate.cmu.edu/15-104/f2017/wp-content/uploads/2017/12/Jimi-Hendrix-Little-Wing.mp3')
  avenir = loadFont("https://s3.us-east-2.amazonaws.com/maxstropkayfinalproject/AvenirNextLTPro-Demi.otf");
}

function setup() {
  createCanvas(1200, 480);
  //play audio file,set volume
  littlewing.play();
  littlewing.setVolume(0.5);
  //set value of amplitude to the amplitude of audio
  amplitude = new p5.Amplitude(.04);
  updateLyrics();

}

function draw() {
  background(51);

  //for every vehicle run behaviors, update, and show
  for (var i = 0; i < vehicles.length; i++){
    var v = vehicles[i];
    v.behaviors();
    v.update();
    v.show();
  }

  //set diameter to be determined by the amplitude
  var level = amplitude.getLevel();
  var volume = map(level, 0, 1, 0, 200);
  diameter = volume;
}

//define Vehicle object
  function Vehicle(x, y) {
    this.pos = createVector(random(0, width), random(0, height));
    this.target = createVector(x, y);
    this.vel = p5.Vector.random2D();
    this.acc = createVector();
    this.r = 10;
    this.color = 255;
    this.maxspeed = 10;
    this.maxforce = 0.5;
  }

  Vehicle.prototype.behaviors = function(f) {
    var arrive = this.arrive(this.target);
    this.applyForce(arrive);
  }

  Vehicle.prototype.applyForce = function(f) {
    this.acc.add(f);
  }
  //move vehicles based on attraction to the
  //target location
  Vehicle.prototype.update = function() {
    this.pos.add(this.vel);
    this.vel.add(this.acc);
    this.acc.mult(0);
    this.r = diameter + 10*(random(0,1));
    this.color = color(diameter*random(0, 100), diameter*random(0, 5), diameter*random(0, 10));
  }
  //draw ellipses at x,y coordinates of objects
  Vehicle.prototype.show = function() {
    noStroke();
    fill(this.color);
    ellipse(this.pos.x, this.pos.y, this.r, this.r);
  }
  //change speed of object as it gets closer to
  //its target location
  Vehicle.prototype.arrive = function(target) {
    var desired = p5.Vector.sub(target, this.pos);
    var d = desired.mag();
    var speed = this.maxspeed;
    if (d < 100){
      var speed = map(d, 0, 100, 0, this.maxspeed);
    }
    desired.setMag(speed);
    var steer = p5.Vector.sub(desired, this.vel);
    steer.limit(this.maxforce);
    return steer;

  }
  //move object toward its desired position
  Vehicle.prototype.seek = function(target) {
    var desired = p5.Vector.sub(target, this.pos);
    desired.setMag(this.maxspeed);
    var steer = p5.Vector.sub(desired, this.vel);
    steer.limit(this.maxforce);
    return steer;

  }

//display the next word in the array lyrics
//at the time from the time array
function updateLyrics(){
  vehicles = [];
  word = (word + 1) /*% lyrics.length*/;
  print(word);
  textAlign(CENTER);
  textFont("Avenir")
  var points = avenir.textToPoints(lyrics[word], 70, 300, 192);
  //console.log(points)

  for (var i = 0; i < points.length; i++){
    var pt = points[i];
    var vehicle = new Vehicle(pt.x, pt.y);
    vehicles.push(vehicle);
    // stroke(0,255,0);
    // strokeWeight(4);
    // point(pt.x, pt.y);
}
print(times[word]);
setTimeout(updateLyrics,times[word]);

}

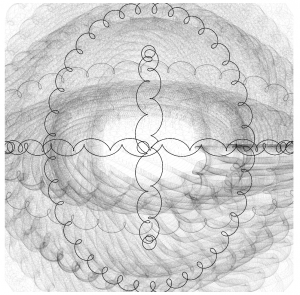
For my final project, I made a program that generates dots that change size and color based on the volume of the music thats being played in the background. The dots then fly to form the lyrics in the song. Syncing up the timing of the lyrics and the music was harder and more time consuming than I anticipated, so it only is synced for the first verse.

Attached is the zip file that contains the audio and the font that can be run on a local server.

mstropka_Final Project_E

To run, first open terminal and copy and paste in this line of code

python -m SimpleHTTPServer 8000

This will run a local server. Then type into the URL in your browser

localhost:8000

Then navigate to wherever you downloaded the file and click to run it.


mstropka-Looking Outwards-09

https://blog.twitter.com/official/en_us/a/2013/the-geography-of-tweets.html

For this week’s looking outward assignment I looked at Asher Blackburn’s looking outwards 7, which is a visual map of where people have tweeted from. This caught my eye for the same reasons that he wrote about in his looking outwards post in that the concept is very simple, but the resulting image is incredibly complex and interesting. The map has billions of points from months of data collection and when all of these points are plotted, the map begins to raise questions. For example, after looking at the map in detail you start to wonder about why certain areas send more tweets than others, why one person is sending a tweet in the middle of nowhere, and what is the content of these tweets.

It would be very interesting if the map were able to link to the tweets that were sent out at these locations. Looking at the map, I am very curious what users are sending out at these locations and times. I would like to be able to look more in depth and answer some of these questions with the help of the map.

mstropka-Project09-E

sketch

//Max Stropkay
//Section E
//mstropka@andrew.cmu.edu
//Project-09

var underlyingImage;

function preload() {
    var myImageURL = "https://i.imgur.com/j59r16x.jpg";
    underlyingImage = loadImage(myImageURL);
}

function setup() {
    print("made");
    createCanvas(480, 480);
    background(0);
    underlyingImage.loadPixels();
    frameRate(20);
}

function draw() {
var size = 20;
    for(var i = 0; i < 480; i+=10){
      for(var j = 0; j< 480; j+=10){
        fill(underlyingImage.get(i, j));
        ellipse(i+random(-10,10), j+random(-10, 10), size ,size);
      }
    }


}

For my project I took a picture of my friend and replaced every pixel with an ellipse that is filled with the color of the underlying picture. This gives the image a sort of painterly feel. Then I made the ellipses move randomly to give the image a sense of movement.

mstropka-Looking Outwards-07

This is one project from a data visualization firm called Variable. Nike hired the designers at Variable to create a data visualization for the data collected from one of their products, Nike Fuel. The video explains the process of moving from the raw data that the team received from these devices to these plant like organic forms. I think that this approach to data visualization is very interesting because the visualizations themselves don’t necessarily make the data readable in any useful way like a graph or a chart would. Instead, they create a sort of artistic expression of the data. My favorite part of this project is that each visualization was created with data from one person, and the colors and shape of the virtual strands are personalized to the athletes. This makes these visualizations sort of like self portraits of the athletes who’s data was collected.

mstropka-Project-07-E

sketch

//Max Stropkay
//Section E
//mstropka@andrew.cmu.edu
//Project_07

var nPoints = 1000;
function setup() {
  createCanvas(480, 480);


}
function drawEpicycloid(){
  // x = (R+r)cos theta - r cos((R+r)/r)theta)
  // y = (R + r)sin theta - rsin(((R+r)/r)theta)

  var R = 100 //radius of large circle
  var r = 10 //radius of small circle
  var a = mouseX //take values of mouse x
  var b = mouseY //take values of mouse y

  //draw curve in center of screen
  push();
  translate(240, 240)
  noFill();
  strokeWeight(.01);

  //draw curve
  beginShape();
  for(var i = 0; i < nPoints; i++){

    var t = map(i, 0, nPoints, 0, TWO_PI);

    var x = (a + r)*cos(t) - (r)*cos(((a + b)/r)*(t))
    var y = (b + r)*sin(t) - (r)*sin(((a + b)/r)*(t))

    //points of curve will be drawn at somewhere within 50 pixels of (x,y)
    vertex(x + random(-50, 50),y + random(50, - 50));
  }
  endShape(CLOSE);
  pop();
}

function draw(){
  drawEpicycloid();
}
//redraw background if the mouse is pressed
function mousePressed(){
  background(255);
}

For this assignment, I used the equation for an epicycloid with the mouse’s location driving certain variables to change the shape as the mouse moves. I can’t say I understand the equation for this type of curve that well so I just started substituting the mouseX and mouse Y value for random variables in the equation until I got something that looked cool. I also added a random value to the x and y coordinates of the points that the program draws.

Here is a screenshot from before I added the random values to the x and y coordinates.


ablackbu-Project-06-Abstract-Clock

water clock

sketch

var red1 = 0
var green1 = 0
var blue1 = 0

var red2 = 0
var green2 = 0
var blue2 = 0

var wid = 5

function setup() {
    createCanvas(300, 300);
    strokeWeight(0);

}

function draw() {
    background(208,236,245);
        
    //get time
    var hr = hour();
    if(hr > 12){
        hr = hr - 12}
    var min = minute();
    var sec = second(); 

    //tubes
    strokeWeight(10);
    noFill()
    stroke(red1,green1,blue1);
    arc(115,95,120,120,PI/2,PI)
    stroke(red2,green2,blue2);
    arc(210,190,120,120,PI/2,PI)

    //color of tube 1
    if(sec == 59){
        red1 = 52
        green1 = 198
        blue1 = 244
    }else{
        red1 = 80
        green1 = 80
        blue1 = 80
    }

    //collor of tube 2
    if(sec == 59 & min == 59){
        red2 = 52
        green2 = 198
        blue2 = 244
    }else{
        red2 = 80
        green2 = 80
        blue2 = 80
    }

    //bowls of water
    fill(52,198,244);
    stroke(0);
    strokeWeight(3);
    rect(15,15,80,80);
    rect(110,110,80,80);
    rect(205,205,80,80);
    
    //extention of background to hide lid (not visible)
    strokeWeight(0);
    fill(208,236,245);
    rect(10,10,90,16)
    rect(105,105,90,16)
    rect(200,200,90,16)

    //compute the height of the water
    var secfull = map(sec, 0, 60, 77, 7);
    var minfull = map(min, 0, 60, 77, 7);
    var hrfull = map(hr, 0, 12, 77, 7);

    //display the water
    fill(208,236,245);
    rect(17,17.5,77,secfull);
    rect(112,112.5,77,minfull);
    rect(207,207.5,77,hrfull);

    //water marks
    fill(0)
    dist1 = 0
        //ticks for vessle 1 and 2
    for(var i = 0; i < 13; i++){
        rect(50,95-dist1,wid,1/2)
        rect(145,190-dist1,wid,1/2)
        dist1 += 5.9
            if((i + 1) % 3 == 0){
                wid = 10
            }else{
                wid = 5
            }
    }

        //ticks for vessle 3
    dist3 = 0
    for(var k = 0; k < 13; k++){
        rect(240,285-dist3,10,1/2)
        dist3 +=5.9
    }

    //digital time
    fill(0);
    text(nf(hr,2,0) + ':' + nf(min,2,0) + ':' + nf(sec,2,0),10,290);

}

For this project, I got a lot of inspiration from the water clock that was discussed in the video. I had a lot of trouble coming up with an idea to show time that was creative without being overdone. I knew that a lot of people were planning on doing interesting circular clocks but I wanted to do something a little different.

Basically the premise of this machine is that when the water in the seconds cup overfills, it empties into the minute and so on into the hours. My favorite part of this is that when you look at it (besides the fact that there is a digital time keeper in the corner) you should have no idea it is a clock, just interacting water vessels.


Image result for water clock

mstropka-Project-04

sketch

//Max Stropkay
//Section E
//mstropka@andrew.cmu.edu
//Project-04


function setup() {
    createCanvas(400, 300);

}
function draw() {
  background(255);
  //draw ten lines from upper left corner
  //line spacing controled by mouseX and mouseY
  for(var i = 0; i < 10; i ++){
    line(0, 0, i*mouseX, mouseY);
  }
  //draw ten lines from upper right
  for(var i = 0; i < 10; i ++){
    line(400, 300 , i*mouseX, mouseY);
  }
  //draw ten lines from lower right
  for(var i = 0; i < 10; i ++){
    line(400, 0, i*mouseX, mouseY);
  }
  //draw ten lines from lower right
  for(var i = 0; i < 10; i ++){
    line(0, 300 , i*mouseX, mouseY);
  }


}

For this project, I tried doing something simple because I am still not 100% comfortable with loops. So I made a couple loops that generate lines that touch at the x and y values of the mouse.

mstropka-Looking Outwards-04

This chair is part of a series of chairs called Nóize chairs by Estudio Guto Requena. The Brazilian designers recorded ambient noise in the streets of São Paulo then used the information from the sound recordings to distort the surfaces of 3D modeled chairs. They distorted three classic Brazilian chair designs. The goal for the designers was to create a chair that represented the culture and ambiance of brazil. By taking an already iconic chair design and distorting it with the sounds of the area, the designers created a very interesting object that is symbolic of their native country.

I find this project very interesting because it is an example of designers building off of the ideas that older designers had with the new technology that is available today. However, I think that the way they distorted the models of the chairs is a pretty generic algorithm for distortion. I think that this concept could be better executed if the designers edited the distortion algorithms to generate geometry that was symbolic of some other aspect of Brazil culture or reminiscent of the original design of the chair.

ablackbu-LookingOutwards-04

Specdrums

When I was home over Winter break last year a friend of mine was working on this project for kickstarter:

Specdrums

Specdrums is a drum machine and synthesizer that you wear like a ring on your finger. Depending on what color you tap with the device, a different drum sound will be produced. Your cell phone can synthesize different sounds and the device works on any surface. It can pick up the colors of your clothes so you can play body music.

What I admire about this project is how playful it is. A lot of new technology like this is very intimidating to use but this seems almost childish and fun.

I was lucky enough to see these guys working on this project and see the mechanisms on the inside of the test product.

Specdrums packaging