jknip-Project-07-curves

sketch

/*Jessica Nip
Section A
jknip@andrew.cmu.edu
Project-07
*/

 //-------------------------
function setup() {
    createCanvas(480,480);
}
 
 //-------------------------
function draw() {
    background(80);

//draw hypotrochoid curve
//define parametric variables, map and constrain mouseX and Y 
    var h = map(mouseY, 0, height/4, height/2, height/4);
    var a = constrain(mouseX, 0, width/4);
    var b = 5;

//set visual variables
    stroke(255,165,175);
    fill(255,165,175);

//set up for loop to consider all 360 degrees
    for (var t = 0; t < 360; t++) {
        //convert parametric equation of curve
        var x = width/2 +((a-b)*cos(radians(t)))+h*cos(((a-b)/b)*(radians(t)));
        var y = height/2 + ((a-b)*sin(radians(t)))-h*sin(((a-b)/b)*(radians(t)));
        //create tiny ellipses that repeat parametrically and create interactive collage
        ellipse(x, y, 1, 1);
    }  
}


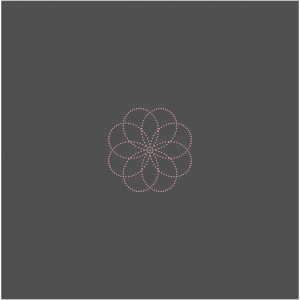
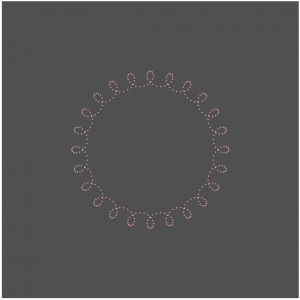
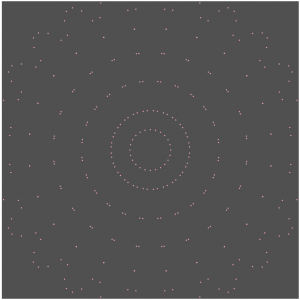
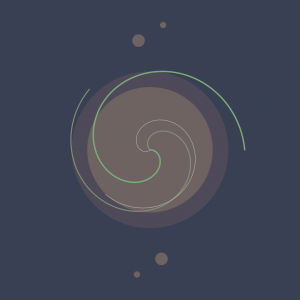
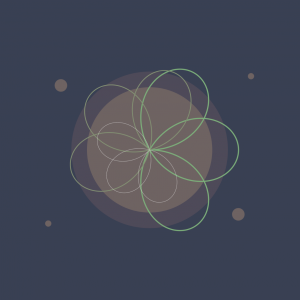
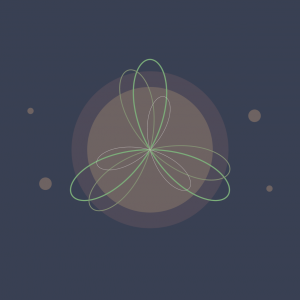
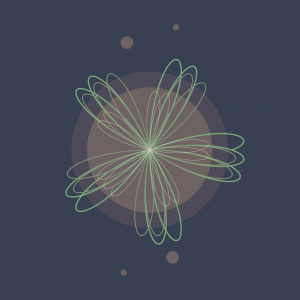
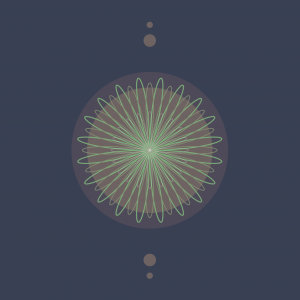
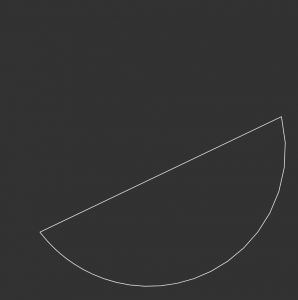
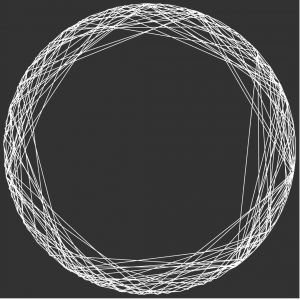
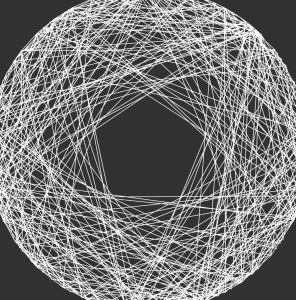
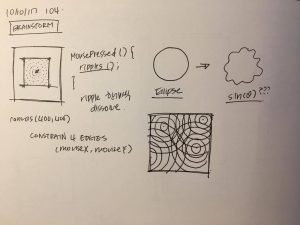
Inspired by the hypotrochoid, I enjoyed looking at its ‘drawing’ mechanism that considers a smaller circle rolling around the inside of a bigger circle and the form of curves it draws. I wanted to recreate it through fireworks-inspired specks, that form both typical geometric forms (e.g. circle) and its exploded perspectives — I also wanted this relationship to be mapped with the movement of mouseX and mouseY, which I have mapped and constrained to smaller sections of the canvas. The aesthetics of the project was also inspired by this minimalist ‘flicker’ of the supposedly ‘specks’  of the form, so I used two colors that drew a distinct contrast.

creyes1-Project-07-Curves

creyes1 Project-07

//Christopher Reyes
//Section D
//creyes1@andrew.cmu.edu
//Project-07 (Composition with Curves)

var nPoints = 10000;

function setup() {
    createCanvas(480, 480);
    background(57, 64, 83);
}

function draw() {
    background(57, 64, 83);
    noStroke();

    //Darker circle
    fill(78, 74, 89);
    ellipse(width/2, height/2, 250, 250);

    //Lighter inner circle
    fill(110, 99, 98);
    ellipse(width/2, height/2, 200, 200);

    //Orbitals
    orbiter(0, 360, 200, 10);
    orbiter(0, 360, -200, 10);
    orbiter(360, 0, 175, 20);
    orbiter(360, 0, -175, 20);

    //Biggest, green rose
    push();
    translate(width/2, height/2);
    roseCurve(50, 200, 0, 10,
              [124, 174, 122],
              map(mouseY, 0, height, 1, 2.5));
    pop();

    //Medium rose
    push();
    translate(width/2, height/2);
    angleMode(DEGREES);
    rotate(180+45);
    angleMode(RADIANS);
    roseCurve(50, 180, 0, 10,
              [131, 144, 115],
              map(mouseY, 0, height, .5, 2));
    pop();

    //Smallest, white rose
    push();
    translate(width/2, height/2);
    angleMode(DEGREES);
    rotate(180-45);
    angleMode(RADIANS);
    roseCurve(0, 140, 0, 10,
              [255, 255, 255, 150],
              map(mouseY, 0, height, .1, .8));
    pop();

}

//Draws a rose curve where a and b values are determined by mouse position
function roseCurve(amin, amax, bmin, bmax, col, thickness) {
    var x;
    var y;
    var r;

    //Determines size of petals
    var a = map(mouseY, 0, height, amin, amax);
    //Determines number of petals
    var b = map(constrain(mouseX, 0, width), 0, width, bmin, bmax);

    noFill();
    stroke(col);
    strokeWeight(thickness);
    beginShape();
    for (var i = 0; i < nPoints; i++) {
        var t = map(i, 0, nPoints, 0, TWO_PI);

        r = a*sin(b*t);

        x = r * cos(t);
        y = r * sin(t);
        vertex(x, y);
    }
    endShape();
}

//Draws an ellipse that rotates around center according to mouse position
function orbiter(angleMin, angleMax, y, size) {
    push();
    translate(width/2, height/2);
    angleMode(DEGREES);
    rotate(map(mouseX, 0, width, angleMin, angleMax));
    noStroke();
    fill(110, 99, 98);
    ellipse(0, y, size);
    angleMode(RADIANS);
    pop();
}

I had forgotten how much I liked math and playing around with graphs, so I really enjoyed the time I spent with this project. Before I started my code, I explored and experimented a lot with Desmos, an online graphing calculator, and manipulated different variables of each equation to see what kind of movement I could get.

I ultimately went with the rose curve, a polar graph that’s visually interesting in not only its form, but in the way that the curve is drawn and generated. The main variables in the curve determine both the rose’s size and the amount of petals on it, so I decided to map both those variables to the mouse’s position and see what came out of it.

I’m definitely pleased with the final result, although I had initially wanted to make the orbitals travel in a sine wave around the circle, but it began to take a toll on the program’s ability to run smoothly, and ultimately settled on having it rotate without depending on a formula.

kyungak-project-07-curves

sketch

//Kyunga Ko
//15104B
//kyungak@andrew.cmu.edu
//Project 07

var cenX;
var cenY;
var numO = 100;
var dis = 100;

function setup() {
    createCanvas(480, 480);
    cenX = (width / 2);
    cenY = (height / 2);
}

function draw() {
    background(0);

    for (var i = 0; i < numO; i++) {

        //constraining mouseX range + mouseX changes size of posX & posY
        var m = map(mouseX,0,480,0,100); 
        var control = (m+10);

        //framerate changes according to mouseY
        var frame = (frameCount*i)/mouseY;

        //position X + circular movement
        var posX = cenX + control * cos(radians(30 * i + frame)); 

        //position Y + circular movement
        var posY = cenY + control * sin(radians(30 * i + frame));

        //for loop of ellipses
        strokeWeight(1);
        noFill();
        stroke(255,255,255,100);
        ellipse(posX,posX,posY,posY); 

    }

}

For this project, I wanted to make a series of translucent ellipses that continuously rotated. I wanted this continuous rotation to illusion the individual objects to be seen as a whole. Although the result didn’t yield a perfectly symmetric object to the traditional X and Y line, it is still partly symmetric to the y=x line. When the mouseX moves across the canvas, the object gets bigger. When mouseY moves, the frame rate changes. The result turned out to be much more fascinating than I thought. It was a last minute decision to give a variation to frameCount, and I am very glad I did it. The aesthetics were very satisfying. Although figuring out the sin and cosine rules were a bit challenging, I feel like I learned a lot by completing this project.

daphnel-Project07-Curves

Heart

var nPoints=300;

function setup() {
    createCanvas(480, 480);

}
function draw() {
    background(255, 230, 238, mouseX);
    var angle = mouseX/300;
    //draws the curve
    for(i=1; i<4; i++){
        push();
        translate(width/2,height/2);
        rotate(angle*mouseY/100);
        drawHeartCurve();
        //http://mathworld.wolfram.com/HeartCurve.html
        pop();
    }
}

function drawHeartCurve(){
    var x;
    var y;
    var a = constrain(mouseX/100,0,width);

    fill(255, 230, 238);
    stroke(255, 179, 204);
    strokeWeight(2);

    beginShape();
    for(var i = 0; i<nPoints; i++){
        var t= map(i,0,nPoints,0,TWO_PI);
        x =a * (16 * sin(t)* sin(t)* sin(t));
        y =a * ((13 * cos(t))-(6*cos(2*t))-(2*cos(3*t))-cos(4*t));
        vertex(x,y);
        vertex(x*i*a,y*i*a);
    }
    endShape(CLOSE);
}

I first spent a while trying to find curves that I was interested in. I thought about making a Quadrifolium but after looking around more, I found the Heart Curve. I tried fiddling around with it a little and then got the heart to show up. I then tried to add some other things to it which resulted in the lines next to the heart.

ghou-Project-07-Curves

sketch

//Grace Wanying Hou
//15-104 Section D
//ghou@andrew.cmu.edu
//Assignment 07


//global vars
var points;
var angle;


function setup() {
    createCanvas(480, 480);
    angleMode(DEGREES);
    frameRate(70);
}

function draw() {
    background(50);
    //curves changing w mouse
    points = map(mouseX, 0, width, 0, 300);
    angle = map((mouseX+mouseY/2), 0, width, 0, 360);
    
    
    //flickering colourful shadows
    stroke(random(230,255),random(230,255),random(230,255));
    drawCurve(width/2 + random(-5,5), height/2 + random(-5,5));
    
    stroke(random(200,240),random(200,240),random(200,240));
    drawCurve(width/2 + random(-10, 10), height/2 + random(-10, 10));
    
    stroke(random(180,220),random(180,220),random(180,220));
    drawCurve(width/2 + random(-15, 15), height/2 + random(-15, 15));
    
    stroke(random(150,200),random(150,200),random(150,200));
    drawCurve(width/2 + random(-20, 20), height/2 + random(-20, 20));
    
    stroke(random(100,180),random(100,180),random(100,180));
    drawCurve(width/2 + random(-30, 20), height/2 + random(-30, 20));
    
    stroke(random(80,150),random(80,150),random(80,150));
    drawCurve(width/2 + random(-30, 20), height/2 + random(-30, 20));
    
    //main shape
    stroke(255);
    noFill();
    drawCurve(width/2, height/2);
}

function drawCurve(posX, posY) {
  var x;
  var y;
  var b = map(mouseY, 0, 480, 60, 80);

  strokeWeight(1);
  noFill();

  push();
  translate(posX, posY);
  rotate(angle);
  //variation on fermat's spiral
  beginShape();
  for (var i = 0; i < points; i++) {
    x = 3*cos(2*i*.1*i)*b;
    y = 3*-sin(2*i*.1*i)*b;
    vertex(x, y);
      
  }
  endShape(CLOSE);
  pop();
}

After forgetting math I did in high-school I had to do a lot of studying and research on the different functions to create this interactive curve.

I was looking at spirals when I came across my concept. My variation generates lines to create a polygon in the shape of a circle and connects lines through the vertices through the polygon.

These are the “basic” shapes that my code generates. I created some shadow forms behind it to make it look more aesthetic.

karinac-Project-07

karinac-project-07

//Karina Chiu
//Section C
//karinac@andrew.cmu.edu
//Project-07

//number of points drawn on hypocycloid
var nPoints = 500;

function setup() {
    createCanvas(400, 400);
}


function draw() {
    background(234,187,196);

    //rotation by mouseX
    var angle = mouseX/200;
    
    // draw the curve
    push();
    translate(width / 2, height / 2);
    rotate(angle);
    drawHypocycloidCurve();
    pop();
}

function drawHypocycloidCurve() {  
    var x;
    var y;
    var a = constrain(mouseX/5,0,width);
    
    fill(255);
    strokeWeight(3);
    stroke(150,46,63);

    beginShape();
    for (var i = 0; i < nPoints; i++) {
        var t = map(i, 0, nPoints, 0, TWO_PI);
        x = (1*a) * cos(t) + a * cos(7*t);
        y = (1*a) * sin(t) - a * sin(7*t);
        vertex(x,y);
    }
    endShape(CLOSE);
}

I started first by attempting to generate a simple astroid curve:  Image result for astroid curve

In doing so, while looking up formulas and trying to figure out what each variable in the equation affects, I found out that an astroid is part of a bigger group called hypocycloids, which is “a special plane curve generated by the trace of a fixed point on a small circle that rolls within a larger circle.”

https://en.wikipedia.org/wiki/Hypocycloid

After creating a simple astroid that expands and contracts with the movement of the mouse, I decided I wanted to experiment with the other variables to see what other shapes I could make. Following the logic of the curves, I ended up with the flower-like shape that you see above. To complete the project, I added a rotation to the expanding flower.

dayoungl Project -07

sketch

//Sharon Lee
//Section E
//dayoungl@andrew.cmu.edu
//Assignment 07-C
var h = 280;
var v = 5;
var dirX = 1;
var wall1 = 60;
var wall2 = 340;
var xarray = [];
var yarray = [];
var rings = 10;
var counts = [];
var circles = [];

var xs = []
var ys = []
var is = []

function setup() {
  createCanvas(400,400);
  // angleMODE(DEGREES);
  frameRate(8);
}

function draw() {
  ripples();
  for(i = 0; i< counts.length;i++){
    counts[i]++;
  }
  if(counts[0]>rings){
    counts.splice(0,1);
    xarray.splice(0,1);
    yarray.splice(0,1);
  }
 
}

function ripples() {
  background(100);
  //rectangle
  push();
  rectMode(CENTER);
  stroke(122,203,241);
  strokeWeight(4);
  noFill();
  rect(width/2, height/2,h,h);
  //set the number of the ripples
  for (i = 0; i < xarray.length; i ++){
    
    //draw ripples
    stroke(122,203,241);
    noFill();
    // var m = map(mouseX, 0, width, 25, 75);
    //constrain the ripples inside the square
    var xc = constrain(xarray[i], wall1, wall2);
    var yc = constrain(yarray[i], wall1, wall2);
    xs.push(xc);
    ys.push(yc);
    is.push(counts[i]);
    //ellipse(xc,yc,50 * counts[i], 50 * counts[i]);
  }

  for (i = 0; i < xs.length; i++) {
    ellipse(xs[i],ys[i],50 * is[i], 50 * is[i]);
  }

  pop();
  fill(100);
  noStroke();
  rect(0,0,wall1,height);
  //create bounding box
  //right bouding box
  rect(wall2,0,wall1,height);
  //left bounding box
  rect(height,0,width,wall1);
   //top bounding box
  rect(0,0,width,wall1);
  //bottom bounding box
  rect(0,wall2,width,wall1);
}

function mousePressed() { 
  counts.push(0);
  xarray.push(mouseX);
  yarray.push(mouseY);
}

// function mouseDragged() {
//   ripples (mouseX, mouseY);
// }

I wanted to represent ripples. As mouse is clicked, the ripples appear on the screen and overlap on top of each other.

afukuda-Project07-Curves

afukuda-project-07

/* 
 * Name | Ai Fukuda 
 * Course Section | C 
 * Email | afukuda@andrew.cmu.edu
 * Project | 07
 */ 

function setup() {
  createCanvas(400, 400);
}

function draw() {
  background(193, 228, 221);
  translate(width/2, height/2);  // translating grid to center 

  drawSpirograph();
}

function drawSpirograph() {
    // Spirograph: 
    // http://mathworld.wolfram.com/Spirograph.html

    var nPoints = 1000;          
    noFill();
    stroke(140, 164, 212);

    var x;
    var y;
    var a = 200;    // fixed radius in which smaller circle (b) rolls around 
    var b = a/constrain(mouseY+10, 50, 350);  // smaller circle radius - making it interactive with mouseY 
    var h = constrain(mouseX+10, 50, 350);  // distance from center of interior circle in which spirograph is traced - mouseX

    beginShape();
        for (var i=0; i < nPoints; i++) {

            var t = map(i, 0, nPoints, 0, TWO_PI);

            x = (a + b) * cos(t) + h * cos((a-b) / b * t);
            y = (a + b) * sin(t) + h * sin((a-b) / b * t);
            vertex(x, y);
        }  
    endShape();

    
} 

My project is based on the Spirograph mathematical curve (link: http://mathworld.wolfram.com/Spirograph.html). Keeping one variable (a) constant, initially I was going to keep things simple by only using small integers (> 10) to create the geometry, but by incorporating mouseX and mouseY for the (b) and (h) variables (see link to see what these variables represent), the geometry became more intricate, more dynamic, and more kaleidoscope-like, which I was compelled by.

katieche-project-07

katieche-07

/*
katie chen
katieche@andrew.cmu.edu
project 07
section E
*/

function setup() {
    createCanvas(480, 480);
}

function draw() {
    background(255, 210, 190);
    var mx = constrain(mouseX, 60, 450);

push();
beginShape();
    // points 
    var n1 = 400;
    // big circle radius
    var a1 = 100;
    // small circle radius
    var b1 = map(mx, 0, width, 0, 10);
    // distance from center of the interior circle to P (what draws the line)
    var h1 = map(mx, 0, width, 0, 300);

    noFill();
    stroke(255, 222, 221);
    strokeWeight (0.2);
    translate(width/2, height/2); //center the object
    for(var i = 0; i < n1; i++) {
        var t = map(i, 0, n1, 0, TWO_PI); 
        var x1 = (a1-b1)*cos(t) + h1*cos(t*(a1-b1)/b1)
        var y1 = (a1-b1)*sin(t) + h1*sin(t*(a1-b1)/b1)
        vertex(x1, y1);
endShape();
    }
pop();

push();
beginShape();
    // points
    var n = 400;
    // big circle radius
    var a = map(mouseY, 0, height, 0, 200);
    // small circle radius
    var b = 10;
    // distance from center of the interior circle to P (what draws the line)
    var h = map(mouseX, 0, width, 0, 200);
    noFill();
    stroke(255, 231, 226);
    strokeWeight (0.2);
    translate(width/2, height/2); //center the object
    for(var i = 0; i < n; i++) {
        var t = map(i, 0, n, 0, TWO_PI); 
        var x = (a-b)*cos(t) + h*cos(t*(a-b)/b)
        var y = (a-b)*sin(t) + h*sin(t*(a-b)/b)
        vertex(x, y);
endShape();
    }

pop();


}

I wanted to create 2 shapes, one that has less points and shows more of the shape being drawn, and one that’s super complicated. The pinker shape is more complicated so I constrained it before it jumbles into a solid donut shape.

The white line shape is what I like more since if you place your mouse near the center-left hand side of the canvas and move your mouse from the top to the bottom of the canvas, you can kind of see the spirograph being drawn. Moving your mouse from left to right makes the swirls bigger.

aranders-project-07

aranders-project-07

//Anna Anderson
//Section D
//aranders@andrew.cmu.edu
//project-07

var nPoints = 100;

function setup() {
  createCanvas(400, 400);
  frameRate(10);
}

function draw() {
  background(250, 250, 200);
  textSize(25);
  text("GOOD", width / 2 - 38, 40);
  text("LUCK", width / 2 - 33, 380);
  push();
  noStroke();
  translate(width / 2, height / 2);
  drawquadrifolium();
  pop();
}

function drawquadrifolium() {
  var x;
  var y;
  var r;
  var a = constrain(mouseX, 5, 230);

  fill(0, 153, 51);
  beginShape();
  for (var i = 0; i < nPoints; i++) {
    var t = map(i, 0, nPoints, 0, TWO_PI);
    r = a * sin(2 * t);
    x = r * cos(t);
    y = r * sin(t);
    vertex(x, y);
  }
  endShape(CLOSE);
}

I made this shape called a quadrifolium. I found it on the website which was given to us to look at curves. I knew what I wanted to do right when I saw it. It took me a while to get the hang of the different variables within the equation, but I ended up liking the project. The image is inspired by a four leaf clover for good luck. I could use some of that for the rest of this semester. Actually, for the rest of my life.