// atraylor@andrew.cmu.edu
//Project 07
// Section B


var a = 0;


function setup() {
    createCanvas(400, 480);
    noStroke();
}

function draw() {
    background(171, 163, 247);
    scribble();
}

function scribble(i, a, rad2, x, y) { // make the curve
    a = map(mouseX, 0, width, 10, 110); // number of lines in curve by mouse position
    var rad2 = 40; // staring radius

    beginShape();
    fill(203, 90, 243, 10);
    stroke(151, 227, 245);
    translate(width/2, height/2); //center
    for(var i = 0; i < a; i++) {
        var theta = map(i, 0, a/80, 0, TWO_PI); // apply values of i to radians in circle
        var x = rad2 * cos(theta); // x position of vertex
        var y = rad2 * sin(theta); // y position of vertex
        vertex(x, y);
        rad2 *= 1.02; // this makes it a spiral rather than a circle.
    endShape();
    }
}
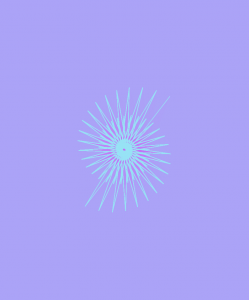
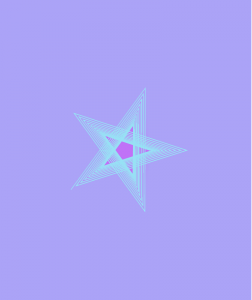
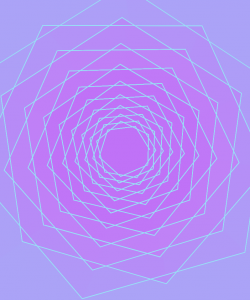
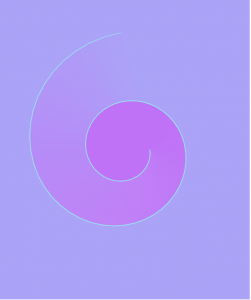
For this project I used a parametric version of the logarithmic spiral to draw my curves. I played with it so the function would draw various shapes rather than simply growing a spiral when segments were added. There are several areas where you can see the near perfect spiral, and others where it’s simply a mess of lines. Its interesting to see the shapes that are spirals but have clear sides so they form stars, triangles, or pentagons. I added a fill to the curve with an alpha channel to emphasize the growth and change of the shape.


![[OLD FALL 2017] 15-104 • Introduction to Computing for Creative Practice](wp-content/uploads/2020/08/stop-banner.png)