/*
Jamie Ho
jamieh@andrew.cmu.edu
10:30
Project 07
*/

var vals = 100;			//# of points to deltoidCrv
var angles = 360;		//total angle
var maxCrvs = 10;		//# of crvs desired

function setup() {
    createCanvas(450, 450);
}

function draw() {
	background(0);
	translate(width/2, height/2);

	for(var i = 0; i < maxCrvs; i++){
		//equal rotation of canvas for each drawDeltoidCrv based on # of crvs
		rotate(angles/i);
		//stroke colour based on mouse position
		var colourX = map(mouseX, 0, width, 0, 255);
		var colourY = map(mouseY, 0, height, 0, 255);
		stroke(0, colourX, colourY);

		drawDeltoidCrv();
	}
}

function drawDeltoidCrv(){
	noFill();
	angleMode(RADIANS);
	beginShape();
	for(var i = 0; i < vals; i++){
		//mapping i to the circle
		var theta = map(i, 0, vals, 0, TWO_PI);
		//multiplied factor for crvs
		var t = 60;

		//making mouse positions a percentage to scale crvs
		var mX = map(mouseX, 0, width, 0, 1);
		var mY = map(mouseY, 0, height, 0, 1);

		//defining x and y coordiantes of deltoid crv
		//size of deltoid crvs are in relationship w/ mouse positions
		var x = (2*t*cos(theta)+t*cos(2*theta))*mX;
		var y = (2*t*sin(theta)-t*sin(2*theta))*mY;

		strokeWeight(0.5);
		vertex(x, y);
		line(0, 0, x, y);
	}
	endShape();
}
The curves are based on deltoid curves, which looks similar to a triangle. I experimented with using just the deltoid curve itself as well as representing the multiple curves with lines. Representing with lines look more interesting than just the deltoid curves themselves. I also experimented with where the lines are drawn from, such as from (0, 0) or from (width/2, heigth/2). Drawing lines from (width/2, height/2) makes the lines intersect in more complex ways, but I preferred how the 3 vertex ends of the curves are more dynamic with (0, 0) as starting point.
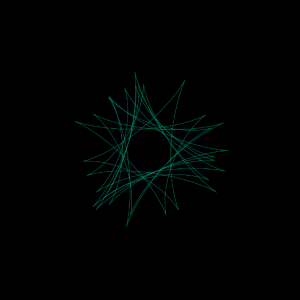
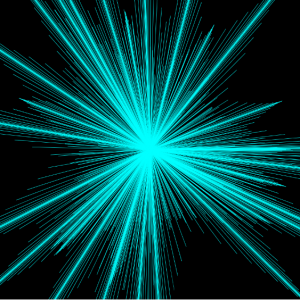
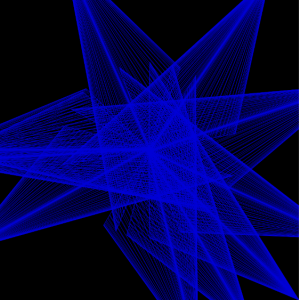
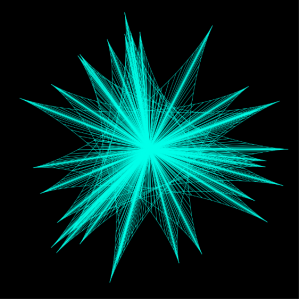
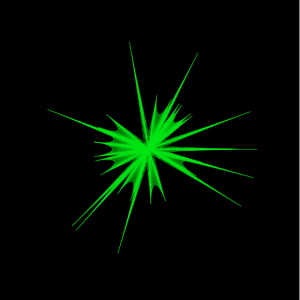
The hardest part of the process was incorporating the mouse position into the curves without messing up the shape, then I realized I could use mouse position by mapping it to make it a scale factor.
![[OLD FALL 2017] 15-104 • Introduction to Computing for Creative Practice](wp-content/uploads/2020/08/stop-banner.png)