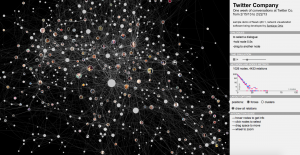
This is a sample demo that was created using Newk, a browser-based application for Networks Visualization. It is currently being developed by Santiago Ortiz with the aim of presenting a visualization of the network of Twitter conversations of the company’s employees.
To the right of the network visualization are sections that provide information for the viewers, such as “network and nodes metrics.” There is also an interaction guide that succinctly outlines the instructions on how to obtain information through the visualization. The intersecting lines are joined by nodes, which are photos of employees. They change colors as the cursor hovers over the nodes, displaying the interaction among the employees in a single glance.
![[OLD FALL 2017] 15-104 • Introduction to Computing for Creative Practice](wp-content/uploads/2020/08/stop-banner.png)