Jamie Dorst Looking Outward 08

This week I watched the Eyeo talk from Moritz Stefaner. Stefaner is a German data visualization specialist. He studied Cognitive Science at the University of Osnabrueck) and Interface Design at the University of Applied Sciences Potsdam. He describes himself as a “truth and beauty operator,” as a reference to his skills balancing aesthetics and analytics.

Moritz Stefaner’s talk at the Eyeo Festival 2011

I wasn’t expecting his talk to be as interesting as it was. He used a lot of humor and was casual with his audience, which I liked. I think it made it a lot easier to pay attention, and made it feel more interactive even though it was just him talking the whole time. Even though there were times when he stumbled, he continued to go with the flow and not let that slow him down, which I think is a really effective presentation strategy–especially since it’s rare that you give a flawless presentation.

He has a lot of projects involving visualization of large-scale human activity. One of my favorites of his is called Multiplicity. This project looked at social media, and how pictures posted represent the place they were posted at. He looked for similar pictures–if it’s possible for two people to take the same picture–similar outfits, similar actions, etc. I thought it was interesting that you could see what most people present the place as, what it is to them, and how that compares to how you see it normally.

A video demonstrating how Multiplicity works

Audrey Zheng – Looking Outwards -08

ROBOTIC VOICE ACTIVATED WORD KICKING MACHINE

The physical part of the piece consists of four bells of baritone horns, tubing, microphone, speakers, a mechanical foot and a projector. The software is written in openFrameworks.

When the software starts, it launches a web browser and creates a WebSocket connection to it. When someone starts speaking, the software sends a message to the browser to tell it to start speech recognition. Once the person finishes speaking, the browser sends words back as text back over the WebSocket connection. Each word is then added to a Box2D physics simulation as a series of rectangles linked together with springs. There’s a mesh for each letter and shadows are created in GLSL with a shadow map.

When a word is near the foot, the computer sends a message to an Arduino telling it to kick. The foot is actuated with a linear actuator driven by a Pololu Dual VNH5019 Motor Driver Shield. There is also a foot polygon in the physics simulation. Every time the mechanical foot starts to kick, the virtual foot in the physics engine is animated with a timeline that has been matched to the actual movement of the mechanical foot.

Neil Mendoza – Neil’s work uses digital and mechanical technologies to bring inanimate objects and spaces to life. Using this medium, he explores the absurd, the humorous, the futile and the surreal. He has an MA in math and computer science from Oxford University and an MFA in design media art from UCLA.

Neil is very accomplished: He has created digital artworks and installations for a wide range of clients including Accenture, Adidas, AntiVJ, Arcade Studios, Audi, Bentley, Brother, Burton Snowboards, Doritos, Ford, Guild LA, HTC, Jason Bruges Studio, LCF, The Light Surgeons, Moving Brands, New Angle, Nokia, Nuit Sonores, O2, Orange, Poke, Swatch, Universal Everything, Wieden & Kennedy and Wired Magazine. He was also a co-founder of is this good?

I first saw his work at The Festival of the Impossible in San Francisco. The festival of the Impossible is an event that celebrates artists who are pushing past the boundaries of Reality. The event features many brand new works in new media, including AR/VR. It’s inspirational to see the rise of new creative technologists and the blurring of medias and genres.


Kyle Leve-LO-Week-08

Jake Barton is one of the founders of the company Local Projects which is a media-design firm for museums and public spaces. Barton’s company has worked on various projects around the world such as the Beijing 2008 Olympics, media designs for the New York City Visitors Information Center, and the World Trade Center. However, the video that I watched discusses his project titled “Like Falling in Love.” Throughout his discussion, Barton talks about the different ways people view things especially if it is for the first time. This translates into what Local Projects does in that it strives to create an atmosphere that all people can find comforting and enjoyable. Barton mentions how artwork is a language used to communicate a message and an atmosphere to people. I feel that this can be applied to all forms of art. No matter the art form, whether it be music, design, architecture or anything else, it strives to convey a certain feeling or emotion. One slide that was shown in the presentation that caught my attention was the quote “Styles change but human emotions are timeless and universal.” This quote inspires me to continue down my path, because as a musician, even though job opportunities look bleak, there will always be human emotions and there will always be an audience that wants to feel something.

https://vimeo.com/channels/eyeo2012

http://localprojects.com/about


Gallery One, found at the Cleveland Museum of Art, is an interactive project conducted my Local Projects that made the art exhibit more technological and interactive.

Project 7 rrandell

sketch

/* Rani Randell
rrandell@andrew.cmu.edu
Section A
Project 7 */

function setup() {
    createCanvas(400, 400);
}

function draw() {
    background(255, 250, 180) //pastel pallette

    x = constrain(mouseX, 0, width);
    y = constrain(mouseY, 0, height);

    push();
    translate(width, height);
    drawHypotrochoid();
    pop();
}

function drawHypotrochoid() {

    for (var i = 0; i < TWO_PI; i ++) { 
       var a = map(y, 0, mouseX, 0, height); 
       var b = map(x, 0, mouseY, 0, width); 

        x = (a - b) * cos(i) + 200 * cos(((a-b)/b) * i); //equations
        y = (a - b) * sin(i) - 200 * sin(((a-b)/b) * i); // cited at bottom

        noFill();
        stroke(180, 150, 255); 
        strokeWeight(1);
        ellipse(-200, -200, x, y); //lavendar ellipse
        stroke(0, 0, 255);
        rect(-200, -200, x, y); //blue rectangles
        stroke(255, 250, 0) //clear yellow
        ellipse(-100, -100, x / .5, y / .5)
        stroke(255, 100, 240); //hot pink concentric circles
        ellipse(-300, -300, x * .5, x * .5)

    }
    //link to eq: http://mathworld.wolfram.com/Hypotrochoid.html
}

I really wanted this project to feel like an explosion of lines and color, so i mainly experimented with the various ellipses and rectangles after implementing the equations for a hypotrochoid. I included a process pic below:


Katherine Hua – Project-07 – Curves

sketch

/* Katherine Hua
Section A
khua@andrew.cmu.edu
Project-07-Curves */

function setup() {
    createCanvas(480, 480);
    frameRate(10);
}

function draw() {

	var r1 = map(mouseX, 0, width, 230, 250); // making variables to make the background dependent on mouseX or mouseY
	var g1 = map(mouseY, 0, height, 220, 230);
	var b1 = map(mouseX, 0, width, 225, 250);
    background(r1, g1, b1); // setting background color
    var nPoints = 200; // setting number of points on shape
    var radius;

// legs
	strokeWeight(5); 
	bezier(random(195, 205), 320, 150, 320, 240, 400, random(165, 175), 400); // left leg
	bezier(random(275, 285), 320, 320, 320, 240, 400, random(300, 310), 400); // right lelg

// body
	strokeWeight(5);
	fill(50, 50, 50);
	push();
    translate(width/2, height/2);
    beginShape();
    radius = 200;
    for (var i = 0; i < nPoints; i++) {
        var theta = map(i, 0, nPoints, 0, TWO_PI);
        var a = map(mouseX, 0, 480, 90, 110); //body will change sizes based on position of mouseX
        var n = map(mouseX, 0, 480, 40, 90);
        var px = (a/n)*(((n-1)*cos(theta))-(cos((n-1)*theta)));
        var py = (a/n)*(((n-1)*sin(theta))-(sin((n-1)*theta)));
        vertex(px + random(-5, 5), py + random(-5, 5));
    } endShape(CLOSE);
    pop();

// eyes	
	strokeWeight(1);
	fill(255);
	nPoints = 10;
	// whites of left eye
    push();
    translate(width/2 - 40, height/2 + 10);
    beginShape();
    radius = 30;
    for (var i = 0; i < nPoints; i++) {
        var theta = map(i, 0, nPoints, 0, TWO_PI);
        var px = radius * cos(theta);
        var py = radius * sin(theta);
        vertex(px + random(-5, 5), py + random(-5, 5));
    } endShape(CLOSE);
    pop();
    // whites of right eye
    push();
    translate(width/2 + 40, height/2 + 10);
    beginShape();
    radius = 30;
    for (var i = 0; i < nPoints; i++) {
        var theta = map(i, 0, nPoints, 0, TWO_PI);
        var px = radius * cos(theta);
        var py = radius * sin(theta);
        vertex(px + random(-5, 5), py + random(-5, 5));
    } endShape(CLOSE);
    pop();
    // pupil of left eye
    fill(0);
    nPoints = 4;
    push();
    translate(width/2 - 40, height/2 + 10);
    beginShape();
    radius = 10;
    for (var i = 0; i < nPoints; i++) {
        var theta = map(i, 0, nPoints, 0, TWO_PI);
        var px = radius * cos(theta);
        var py = radius * sin(theta);
        vertex(px + random(-5, 5), py + random(-5, 5));
    } endShape(CLOSE);
    pop();
    // pupil of right eye
    push();
    translate(width/2 + 40, height/2 + 10);
    beginShape();
    radius = 10;
    for (var i = 0; i < nPoints; i++) {
        var theta = map(i, 0, nPoints, 0, TWO_PI);
        var px = radius * cos(theta);
        var py = radius * sin(theta);
        vertex(px + random(-5, 5), py + random(-5, 5));
    } endShape(CLOSE);
    pop();
    
//arms
	noFill();
	strokeWeight(5);
	//making arms grabbing hand curve different depending if arms are reaching below or above the midpoint
	if (mouseY > width/2) {
		bezier(random(145, 155), 240, random(115, 125), 240, mouseX - 80, mouseY + 40, mouseX-50, mouseY-50); //left arm
		bezier(random(325, 335), 240, 360, random(235, 245), mouseX + 80, mouseY - 40, mouseX+50, mouseY-50); //right arm
	} else if (mouseY < width/2) {
		bezier(150, 240, 120, 240, mouseX - 80, mouseY + 40, mouseX-50, mouseY+50); //left arm
		bezier(330, 240, 360, 240, mouseX + 80, mouseY - 40, mouseX+50, mouseY+50);	//right arm
	}

	//star
	rectMode(CENTER);
	push();
	translate(mouseX, mouseY); //star will follow position of the mouse
	var r2 = map(mouseY, 0, height, 200, 230);
	var g2 = map(mouseY, 0, height, 150, 180);
	var b2 = map(mouseX, 0, width, 125, 175);
	fill(r2, g2, b2);
	stroke(r2, g2, b2);
    rect(0, 0, 20, 20);
    push();
    rotate(PI/4);
    rect(0,0, 20, 20);
    pop();
	pop();
}

My design is based off of one of my favorite childhood movies, “Spirited Away.” The character I created is supposed to be one of the coal spirit (or soot ball). Below is an image of how they look like:

Spirited Away coal spirits

These sootballs are constantly moving and really like to eat these star candies so made a star candy follor the mouse and the sootball’s arms try to reach for the candy.

Project 07 – Curves

sketch

function setup() {
    createCanvas(480, 480);
    frameRate(15);
}

function draw() {
	background(255, 200, 200);
    fill(255, 255, 255, 64);
    var nPoints = 30;
    var radius = 30;

    //fire body
    //red fire
    push();
    translate(width / 2 - 30, height / 2);
    beginShape();
    noStroke();
    fill(201, 75, 56);
    beginShape();
    for (var i = 0; i < nPoints ; i++) {
        var theta = map(i, 0, nPoints, 0, TWO_PI);
        var px = 5.5 * radius * cos(theta);
        var py = 5.5 * radius * sin(theta);
        if (i > 15 & i < 24) {
        	vertex(px + random(-2, 2), py + random(-2, 2) - 50);
        } else {
        	vertex(px + random(-2, 2), py + random(-2, 2));
        }
    }
    endShape();
    pop();

    //red-orange fire
    push();
    translate(width / 2 - 30, height / 2);
    beginShape();
    noStroke();
    fill(230, 112, 84);
    beginShape();
    for (var i = 0; i < nPoints ; i++) {
        var theta = map(i, 0, nPoints, 0, TWO_PI);
        var px = 5 * radius * cos(theta);
        var py = 5 * radius * sin(theta);
        if (i > 15 & i < 24) {
        	vertex(px + random(-2, 2), py + random(-2, 2) - 50);
        } else {
        	vertex(px + random(-2, 2), py + random(-2, 2));
        }

    }
    endShape();
    pop();

    //orange fire
    push();
    translate(width / 2 - 30, height / 2);
    beginShape();
    noStroke();
    fill(235, 173, 78);
    beginShape();
    for (var i = 0; i < nPoints; i++) {
        var theta = map(i, 0, nPoints, 0, TWO_PI);
        var px = 3.5 * radius * cos(theta);
        var py = 3.5 * radius * sin(theta);
        if (i > 13 & i < 22) {
        	vertex(px + random(-4, 4), py + random(-4, 4) - 40);
        } else {
        	vertex(px + random(-4, 4), py + random(-4, 4));
        }

    }
    endShape();
    pop();

    //yellow fire
    push();
    translate(width / 2 - 30, height / 2);
    beginShape();
    noStroke();
    fill(240, 209, 90);
    beginShape();
    for (var i = 0; i < nPoints; i++) {
        var theta = map(i, 0, nPoints, 0, TWO_PI);
        var px = 1.5 * radius * cos(theta);
        var py = 1.5 * radius * sin(theta);
        if (i > 14 & i < 24) {
        	vertex(px + random(-5, 5), py + random(-5, 5) - 30);
        } else {
        	vertex(px + random(-5, 5), py + random(-5, 5));
        }

    }
    endShape();
    pop();

    //left cheek
    beginShape();
    smooth();
    noFill();
    curveVertex(width / 4 + 5 + random(-2, 2), height / 2 + 60 + random(-2, 2));
    curveVertex(width / 4 + 5 + random(-2, 2), height / 2 + 50 + random(-2, 2));
    curveVertex(width / 4 + 10 + 10 + random(-2, 2), height / 2 + 50 - 10 + random(-2, 2));
    curveVertex(width / 4 + 10 + 20 + 5 + random(-2, 2), height / 2 + 50 - 5 + random(-2, 2));
    curveVertex(width / 4 + 10 + 20 + 8 + random(-2, 2), height / 2 + 50 + 14 + random(-2, 2))
    curveVertex(width / 4 + 10 + 20 + random(-2, 2), height / 2 + 50 + 20 + random(-2, 2))
    endShape();

    //right cheek
    beginShape();
    smooth();
    noFill();
    curveVertex(width / 2 + 60 + random(-2, 2), height / 3 + 40 + random(-2, 2));
    curveVertex(width / 2 + 40 + random(-2, 2), height / 3 + 20 + random(-2, 2));   
    curveVertex(width / 2 + 40 - 12 + random(-2, 2), height / 3 + 20 + 15 + random(-2, 2));
    curveVertex(width / 2 + 40 + random(-2, 2), height / 3 + 20 + 30 + random(-2, 2));
    curveVertex(width / 2 + 40 + 10 + random(-2, 2), height / 3 + 20 + 30 + random(-2, 2))
    curveVertex(width / 2 + 80 + random(-2, 2), height / 3 + 30 + random(-2, 2))
    endShape();

    //mouth
    beginShape();
    smooth();
    noFill();
    curveVertex(width / 4 + 10 + 20 + 5 + random(-2, 2) - 20, height / 2 + 50 - 5 + random(-2, 2) + 50);
    curveVertex(width / 4 + 10 + 20 + 5 + random(-2, 2), height / 2 + 50 - 5 + random(-2, 2));
    curveVertex(width / 4 + 10 + 20 + 30 + random(-2, 2), height / 2 - 25 + random(-2, 2));
    curveVertex(width / 2 + random(-2, 2) - 20, height / 2 - 30 + random(-2, 2));
    curveVertex(width / 2 + 40 - 12 + random(-2, 2), height / 3 + 20 + 15 + random(-2, 2));
    curveVertex(width / 2 + 40 - 12 + random(-2, 2) + 30, height / 3 + 20 + 15 + random(-2, 2));
    endShape();

	//left eye
    push();
    fill(255);
    translate(width / 4, height / 2);
    beginShape();
    for (var i = 0; i < nPoints; i++) {
        var theta = map(i, 0, nPoints, 0, TWO_PI);
        var px = radius * cos(theta);
        var py = radius * sin(theta);
        vertex(px + random(-1, 1), py + random(-1, 1));
    }
    endShape(CLOSE);

    //left pupil

    push();
    fill(0);
    var mouseXeyes = map(mouseX, 0, 1000, -10, 10);
    var mouseYeyes = map(mouseY, 0, 800, -10, 10);
    ellipse(mouseXeyes, mouseYeyes, 20, 20);
    pop();

   	//right eye
    translate(width / 4,  -height / 6);
    beginShape();
    for (var i = 0; i < nPoints; i++) {
        var theta = map(i, 0, nPoints, 0, TWO_PI);
        var px = radius * cos(theta);
        var py = radius * sin(theta);
        vertex(px + random(-1, 1), py + random(-1, 1));
    }
    endShape(CLOSE);

    //right pupil
    push();
    fill(0);
    var mouseXeyes = map(mouseX, -500, 1000, -10, 10);
    var mouseYeyes = map(mouseY, -500, 1000, -10, 10);
    ellipse(mouseXeyes, mouseYeyes, 20, 20);
    pop();

    pop();

  	//bottom text
  	stroke(0);
  	fill(0);
  	textFont("Georgia");
  	textSize(22);
  	text("calcifer.", width / 2 - 30, height / 10 * 9 + 10);

    //egg
    push();
    noStroke();
    fill(255);
    beginShape();
    smooth();
    ellipse(mouseX, mouseY, 50, 60)
  	endShape(CLOSE);
  	stroke(0);
  	beginShape();
  	vertex(mouseX - 23, mouseY - 10)
   	vertex(mouseX - 15, mouseY - 2)
	vertex(mouseX - 5, mouseY - 10)
  	vertex(mouseX + 5, mouseY - 2)
	vertex(mouseX + 15, mouseY - 10)
	vertex(mouseX + 25, mouseY - 2)
	endShape();
  	pop();

}

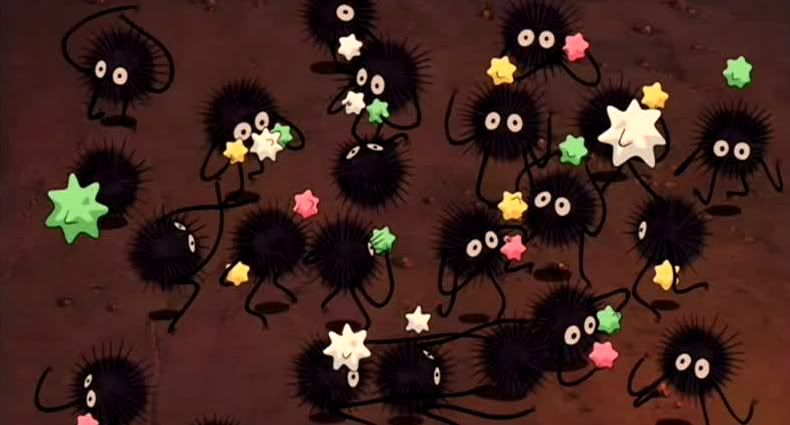
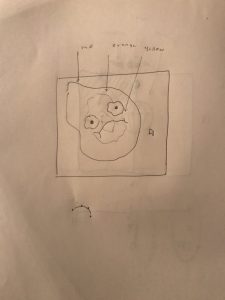
For this project, I was inspired by the moving circle in the example given. I used this to attempt to recreate one of my favorite characters from Studio Ghibli, Calcifer. The moving points give Calcifer the feel of a live fire.

Yingyang Zhou-Project-07-Curves

Curves

//Yingyang Zhou
//Section A
//yingyanz@andrew.cmu.edu
//Project-07


function setup() {
  createCanvas(480, 480);
}

function draw() {
  background(250);
  drawAstroid();
  drawEpispiral();
  drawRadialCurve();
  frameRate(20);

function drawAstroid(){
  push();
  translate(width/2, height/2);
  var a = 200;
  var b = 200;
  for(r = 0; r < 5; r++){
    rotate(r);
    noFill();
    strokeWeight(0.1);
    var red = map(r, 0, 3.14, 0, 255);
    stroke(red,0,255-red);
    beginShape();
    for (var t = 0; t < mouseX; t++){
      x = a*cos(t)*cos(t)*cos(t);
      y = a*sin(t)*sin(t)*sin(t);
      curveVertex(x + random(0, 1),y + random(0, 1));
    }
    endShape();
  }
  pop();
}
}

function drawEpispiral(){
  push();
  translate(width/2, height/2);
  var a = 60;
  var b = 20;
  var h = constrain(mouseX/2, 0, width/2);
  var r = mouseX/50;
  noFill();
  strokeWeight(0.5);
  stroke("red");
  beginShape();
  for (c = 0; c < 200; c++){
    var t = map(c, 0, 180, 0, TWO_PI);
    x = (a+b)*cos(t)-h*cos(c+t*(a+b)/b);
    y = (a+b)*sin(t)-h*sin(c+t*(a+b)/b);
    curveVertex(x, y);
  }
  endShape();
  pop();
}

function drawRadialCurve(){
  push();
  translate(width/2, height/2);
  beginShape();
  var angle = map(mouseX,0, width, 0, 360);
  rotate(radians(angle));
  var a = 50;
  for (var t = 0; t < 200; t +=2){
    stroke(t, 0, 0);
    strokeWeight(0.5);
    var x = 1/3*a*(2*cos(t)+cos(2*t));
    var y = 1/3*a*(2*sin(t)-sin(2*t));
    curveVertex(x,y);
  }
  endShape();
  pop();

}

In this project, I start using functions which make the code more readable and easier to revise if needed. I use three types of curves in this project all involving sin and cos but different from each other and have different movement along the changes of mouse position.

Looking outwards 7 rrandell

http://www.aaronkoblin.com/project/flight-patterns/

This is a link to his website and here are some photos of his work below:

The piece that I have chosen for this data visualization looking outwards is called Flight Patterns by Aaron Koblin. I am particularly drawn to this piece because of how clearly you can see a map start to take place over the hundreds of thousands of flights in America. Not only is the data clear, but it is also strangely beautiful and ethereal– the individual flights serve as pieces of blue-ish light that light up the dark negative space. Aaron Koblin used FAA (Federal Aviation Administration) data and parsed and plotted it to represent the artwork that is shown on his website. He also used the ‘processing’ programming environment which is a coding language designed specifically for visual arts.

Yiran Xuan – Looking Outward 07

This visualization was custom-made by a reddit user with a combination of R, Python, and Javascript and related plugins. The data used was estimated using a combination of U.S. Census data and public transportation inflow/outflow statistics. Using this visualization, we can make analyses about city activity. What I most admire about the project is the work put in to create the population estimates, and the fact that a straightforward visualization method (3D bars) can used to create an image that appears to make the city breath.

https://manpopex.us/

The City is Alive: The Population of Manhattan, Hour-by-Hour [OC] from dataisbeautiful

Anthony Ra – Looking Outwards 07

Ben Fry’s simulated visualization of every street in USA

Ben Fry works head of a design and software consultancy where he combines his knowledge in computer science and graphic design to generate visual data of different sets of information. As a fan of geography and integration of urban areas and habitation, this project called “All Streets” is basically what the title says it is – using his software of TIGER/Line shapefile to generate a series of tiles and prints out a map of every street in that country.

As a person who grew up in Boston, my bias tells me I like this print a lot

What makes me admire these sets of work so much is the negative spaces that generate in between the lines. One can see where the urban areas are, which spaces are largely inhabited and which may be resourcefully insufficient.

Canada is very sparse

The funny thing is that I have to remind myself every time that this is not a density population map or a light pollution map – these are simply streets; however, the magnitude of them is directly correlated to the number of people that use them in a given radius.