Yiran Xuan – Project 07 – Curves

The idea behind this project was to implement an “unfolding” of the involute from the surface of the circle, similar to an Asian fan or a wing. A little struggle was had in keeping track of the angle variables, whether they represented angles themselves or just the increments (out of 24).

The mouse in the horizontal direction controls the unfolding, while in the vertical the rotation of the whole drawing is affected.

sketch

//Objective: draw circle involute
//mouse control: y controls the amount of "wrapping"
//mouse control: x controls initial angle

var wrap = 0; //determines how far the involute extends out
var initangle = 0;

var increment = 12;
var radius = 25;

function setup() {
    createCanvas(480, 480);
    angleMode(RADIANS);
}

function draw() {
	translate(width/2, height/2); //shifting coordinates to the center

	rotate(constrain(mouseY, 0, 480)/240*PI); //rotation

    background('white');

	wrap = 24 - constrain(mouseX, 0, 480)/20; //number of increments to go around circle

	noFill();
	strokeWeight(3);
	stroke('orange');
	ellipse(0, 0, radius*2, radius*2); //drawing center circle

	var accumulatedincrement = 0;

	for(var i = 0; i <= wrap; i++){
		stroke('cyan');

		var currentangle = accumulatedincrement/increment*PI;
		var x1 = radius*(cos(currentangle) + currentangle*sin(currentangle)) //determining fan section start point
		var y1 = radius*(sin(currentangle) - currentangle*cos(currentangle));

		accumulatedincrement++;
		
		var nextangle = accumulatedincrement/increment*PI;
		var x2 = radius*(cos(nextangle) + nextangle*sin(nextangle)); //determining fan section end point
		var y2 = radius*(sin(nextangle) - nextangle*cos(nextangle));

		triangle(x1, y1, x2, y2, 0, 0); //drawing triangle

		stroke('red');
		line(x1, y1, radius*cos(nextangle), radius*sin(nextangle)); //drawing lines to display tangency
	}

}

Jonathan Liang – Project 7 – Curves

sketch

//Jonathan Liang
//jliang2
//Section A

function setup() {
    createCanvas(600, 600);
    frameRate(10);
  
}

function draw() {
	background(0);
	push();
	translate(300,300);
	rotate(sin(mouseX));
	drawKevin();
	pop();

	push();
	translate(300,300);
	rotate(-sin(mouseX));
	drawStanley();
	pop();
}

function drawKevin() {
    var kPoints = map(mouseX, 0, height, 0 , 500);
    var x;
    var y;
    var tj = map(mouseX, 0, width,0,8); // for iterations
    beginShape();
    for (var i=0; i < kPoints; i++){ 
        var t = map(i,0,kPoints,0,TWO_PI*tj);
        noFill();
        var colR = map(mouseX, 0, width, 0, 255);
        var colG = map(mouseY, 0, width, 0, 255);
        var colB = map(mouseX, 0, width, 0, 255);
        strokeWeight(.5);
        stroke(colR, colG, colB); // 
        //equations as listed on mathworld.wolfram.com/ButterflyCurve.html
        x = Math.sin(t) * (Math.pow(Math.E,Math.cos(t))
                        - 2*Math.cos(4*t) 
                        + Math.pow(Math.sin(t/12),5));

        y = Math.cos(t) * (Math.pow(Math.E,Math.cos(t))
                        - 2*Math.cos(4*t) 
                        + Math.pow(Math.sin(t/12),5));

        vertex(i*x,i*y);
    }
    endShape(CLOSE);  
}

function drawStanley() {
    var sPoints = map(mouseX, 0, height, 0 , 500);
    var x;
    var y;
    var tj = map(mouseX, 0, width,0,8); 

    beginShape();
 
    for (var i=0; i < sPoints; i++){ 
        var t = map(i,0,sPoints,0,TWO_PI*tj);
        noFill();
        var colR = map(mouseX, 0, width, 255, 0);
        var colG = map(mouseY, 0, width, 255, 0);
        var colB = map(mouseX, 0, width, 255, 0);
        strokeWeight(0.5);

        stroke(colR, colG, colB); // 
        //equations as listed on mathworld.wolfram.com/ButterflyCurve.html
        x = Math.sin(t) * (Math.pow(Math.E,Math.cos(t))
                        - 2*Math.cos(4*t) 
                        + Math.pow(Math.sin(t/12),5));

        y = Math.cos(t) * (Math.pow(Math.E,Math.cos(t))
                        - 2*Math.cos(4*t) 
                        + Math.pow(Math.sin(t/12),5));

        vertex(i*x,i*y);
    }
    endShape(CLOSE);  
}

I see the butterfly curve more like a ripple or a flower, growing over time. Just a flower blooms, butterflies blossom from little caterpillars to marvelous winged insects. However, as one butterfly blossoms, one must leave; which is why I made one fade away as the other became more prominent. The color becomes the most vibrant at the top right, symbolizing the butterfly’s prime, while the faded bottom right corner symbolizes its passing.

Anthony Ra – Project 07 – Curves

sketch

/* Anthony Ra
Section-A
ahra@andrew.cmu.edu
Project-07 */

function setup() {
    createCanvas(480, 480);
    frameRate(100);
}

function draw() {
    background(255);

/* mapping the colors so that it changes based on mouseX */
    var r = map(mouseX, 0, width, 140, 180);
    var g = map(mouseX, 0, width, 160, 190);

/* printing hypotrochoid */
    push();
    stroke(r, g, 255);
    strokeWeight(0.25);
    translate(width/2, height/2);
    drawHypotrochoid();
    pop();
}

function drawHypotrochoid() {
/* naming variables */
    var hypoX;
    var hypoY;
/* radius of hypotrochoid */
    var hypoRadius = 240;
/* hypotrochoid alteration with cursor */
    var a = map(mouseX, 0, width, 0, 5);
    var b = map(mouseY, 0, height, 0, 3);
    beginShape();
      for(var i = 0; i < 300; i ++) {
        var angle = map(i, 0, 200, 0, 360);
/* equation of hypotrochoid from the link */
        hypoX = (a - b) * cos(angle) + hypoRadius * cos((a - b) * angle);
        hypoY = (a - b) * sin(angle) - hypoRadius * sin((a - b) * angle);
        vertex(hypoX, hypoY);
      }
    endShape();
}

hypotrochoid chart

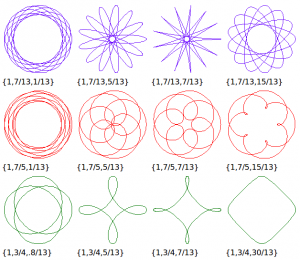
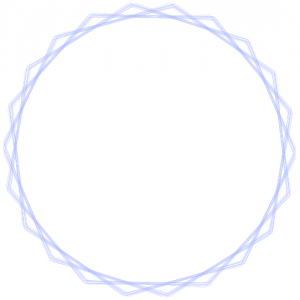
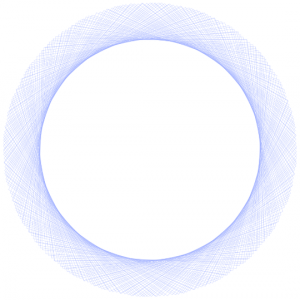
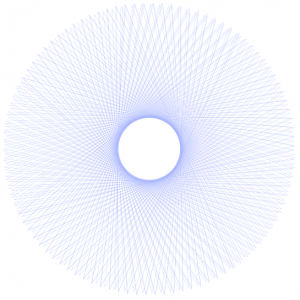
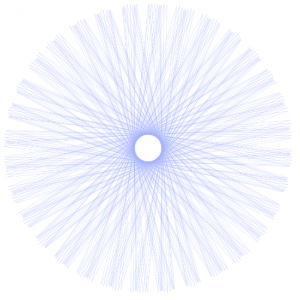
Thinking about the project that we did a couple weeks ago on string art, I focused on curves that bring lightness, tranquility, and balance in regards to symmetry and motion. The purpose of picking a hypotrochoid is the many ways in which the control points of each line or curve responds differently but respects the symmetry in balance.

variation with the largest radius

Looking back at the hypotrochoid chart, that moment of the cursor provides the twelfth iteration, producing a modular set of filleted triangular curves.

second variation
a similar variation to the above one

Kyle Leve-Project-07-Curves

sketch

// Kyle Leve
// kleve@andrew.cmu.edu
// Section A
// Project-07-Curves

var a = 40;
var b = 40;

function setup() {
    createCanvas(480, 480);
}

function draw() {
    background(255);
    translate(width/2, height/2); // Sets all the curves to the center of the canvas
    drawAstroid1(); // Draws first curve
    drawAstroid2(); // Draws second curve
    drawAstroid3(); // Draws third curve
    drawAstroid4(); // Draws fourth curve
    if (mouseX >= 0 & mouseX <= width/2) { // Makes silver side shrink/appear and red side grow/disappear
        a += -0.1 * mouseY;
        b += 0.1 * mouseY;
    }
    if (mouseX > width/2 & mouseX <= width) { // Makes red side shrink/appear and silver side grow/disappear
        a += 0.1 * mouseY;
        b += -0.1 * mouseY;
    }
}

function drawAstroid1() { // First curve
    beginShape();
    fill('red');
    for(var i = 0; i < 240 * TWO_PI; i++) { // Draws overlapping vertices to make curves
        stroke(0);
        vertex(500 * (cos(i)**a), 500 * (sin(i)**a));
    }
    endShape(); 
}

function drawAstroid2() { // Second curve
    beginShape();
    fill('silver');
    for(var i = 0; i < 240 * TWO_PI; i++) { // Draws overlapping vertices to make curves
        stroke(0);
        vertex(-500 * (cos(i)**b), 500 * (sin(i)**b));
    }
    endShape(); 
}
function drawAstroid3() { // Third curve
    beginShape();
    fill('red');
    for(var i = 0; i < 240 * TWO_PI; i++) { // Draws overlapping vertices to make curves
        stroke(0);
        vertex(500 * (cos(i)**a), -500 * (sin(i)**a));
    }
    endShape(); 
}
function drawAstroid4() { // Fourth curve
    beginShape();
    fill('silver');
    for(var i = 0; i < 240 * TWO_PI; i++) { // Draws overlapping vertices to make curves
        stroke(0);
        vertex(-500 * (cos(i)**b), -500 * (sin(i)**b));
    }
    endShape(); 
}

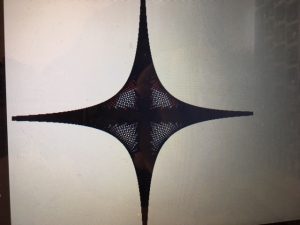
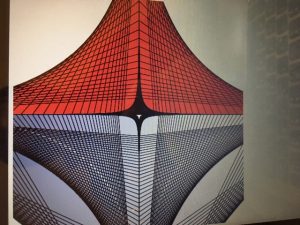
I found this project to be really interesting because I found myself using functions that I had not used in the past. I decided in this project that I wanted to have contrasting sides where when something was happening to one side, the opposite was happening to the other. This is what ended up happening with the silver and red sides of the canvas. When one side expands, the other shrinks and vice versa. This is due to both mouseX and mouseY however each one has their own distinct properties. MouseX controls how the two sides behave while mouseY controls the speed at which they happen. This project helped me better understand how to have separate entities behave in similar yet contrary ways.

Curran Zhang- Project 07- Curves

sketch

function setup(){
	createCanvas(480,480);
}

function draw(){
	background(50);
	push();
	translate(width/2,height/2);
		push();
			for (var i = 0; i < width; i+=4) {
			translate(i,i)
			rotate(PI * mouseX/150);
			drawDevilCurve();
		};
		pop();
	pop();
}

function drawDevilCurve(){
	var range = 50;
	var b = map(mouseY, 50, height-50, 0, 50);
	var a = map(mouseX, 50, height-50, 0, 50);

	noFill();
	stroke(200);
	beginShape();
	for (var i = 0; i < range ; i++) {
		var t = map (i, 0, range, 0,  2* PI);
		var SINS = sq(sin(t));
		var COSS = sq(cos(t));
		var x = cos(t) * sqrt(((sq(a) * SINS) - (sq(b)*COSS)) / (SINS - COSS));
		var y = sin(t) * sqrt(((sq(a) * SINS) - (sq(b)*COSS)) / (SINS - COSS));
		vertex(x,y);
	}
	endShape();
}

For this project, I began with a Devil’s Curve. Upon its creation, I began playing around with the different parameters of the curve to find an interesting shape. The two parameters involving the location of the mouse includes the different shape that the function would create and the location in which the curves would spiral.

http://mathworld.wolfram.com/DevilsCurve.html

Project 7 Liz Maday

emadayflames

//Elizabeth Maday
//Section A
//emaday@andrew.cmu.edu
//Project 7

var nPoints = 450;

//background color
var r = 0;
var g = 0;
var b = 0;
//red fire colors
var r1 = 255;
var b1 = 0;
var g1 = 0;
var r2 = 255;
var g2 = 85;
var b2 = 0;
var r3 = 255;
var g3 = 164;
var b3 = 0;
var r4 = 255;
var g4 = 204;
var b4 = 0;
//blue fire colors
var R1 = 7;
var G1 = 83;
var B1 = 130;
var R2 = 27;
var G2 = 125;
var B2 = 186;
var R3 = 73;
var G3 = 174;
var B3 = 237;
var R4 = 105;
var G4 = 185;
var B4 = 234;
//shadow colors red
var rr = 108; //inside
var gg = 22;
var bb = 0;
var rrr = 255;//outside
var ggg = 58;
var bbb = 0;
//shadow colors blue
var RR = 4; //inside
var GG = 22;
var BB = 33;
var RRR = 22; //outside
var GGG = 63;
var BBB = 89;
//water colors blue
wr = 47;
wg = 102;
wb = 191;
//water colors green
WR = 12;
WG = 201;
WB = 72;

function setup() {
	createCanvas(400, 400);
	frameRate(6);
	strokeWeight(0.7);
}

function mouseClicked() {	
	if (r1 === 255) { 
		r1 = R1;
		g1 = G1;
		b1 = B1;
		r2 = R2;
		g2 = G2;
		b2 = B2;
		r3 = R3;
		g3 = G3;
		b3 = B3;
		r4 = R4;
		g4 = G4;
		b4 = B4;
		r = 4; 
	    g = 22;
	    b = 70;
	    rr = RR;
	    gg = GG;
	    bb = BB;
	    rrr = RRR;
	    ggg = GGG;
	    bbb = BBB;
	    wr = WR;
	    wg = WG;
	    wb = WB;
	} else if (r1 === 7) { 
		r1 = 255;
		g1 = 0;
		b1 = 0;
		r2 = 255;
		g2 = 85;
		b2 = 0;
		r3 = 255;
		g3 = 164;
		b3 = 0;
		r4 = 255;
		g4 = 204;
		b4 = 0;
		r = 0;
		g = 0;
		b = 0;
		rr = 108;
		gg = 22;
		bb = 0;
		rrr = 255;
		ggg = 58;
		bbb = 0;
		wr = 47;
		wg = 102;
		wb = 191;
	}
}

function draw() {
	background(r, g, b);
	translate(200, 200);
    shadows(0, 0); 
    fire(0, 0);
    water2(0, 0);  	
    textSize(15);
    text('Click!', -170, 170);
}

function shadows(x, y) {
	translate(x, y);
	push();
    ellipseMode(CORNER);
    fill(rrr, ggg, bbb); //outside
    ellipse(-35, 5, random(125, 130), random(40, 50));
    fill(rr, gg, bb); //inside
    ellipse(-25, 5, 70, random(20, 30));
	pop();
}

function fire(x, y) {
	translate(x, y);
	beginShape();
	fill(r1, g1, b1);
	//outermost part
	for (var i = 0; i < nPoints; i += 1) {
		var num = random(1, 1.4);
		var r = num - sin(theta);
		var theta = map(i, 0, nPoints, 0, TWO_PI);
		var grow = (dist(mouseX, mouseY, width/2, height/2))/3.5;
        var x = grow * (r*cos(theta));
        var y = grow * (r*sin(theta));
        vertex(x, y);
	}
	endShape(CLOSE);
	//second to outermost part
	beginShape();
	fill(r2, g2, b2);
	for (var i = 0; i < nPoints; i += 1) {
		var num = random(0.9, 1.2);
		var r = num - sin(theta);
		var theta = map(i, 0, nPoints, 0, TWO_PI);
		var grow = (dist(mouseX, mouseY, width/2, height/2))/3.5;
        var x = grow * (r*cos(theta));
        var y = grow * (r*sin(theta));
        vertex(x, y);
	}
	endShape(CLOSE);
    //second to innermost part
	beginShape();
	fill(r3, g3, b3);
	for (var i = 0; i < nPoints; i += 1) {
		var num = random(0.6, 1);
		var r = num - sin(theta);
		var theta = map(i, 0, nPoints, 0, TWO_PI);
		var grow = (dist(mouseX, mouseY, width/2, height/2))/3.5;
        var x = grow * (r*cos(theta));
        var y = grow * (r*sin(theta));
        vertex(x, y);
	}
	endShape(CLOSE);   
    //innermost part
	beginShape();
	fill(r4, g4, b4);
	for (var i = 0; i < nPoints; i += 1) {
		var num = random(0.2, 0.5);
		var r = num - sin(theta);
		var theta = map(i, 0, nPoints, 0, TWO_PI);
		var grow = (dist(mouseX, mouseY, width/2, height/2))/3.5;
        var x = grow * (r*cos(theta));
        var y = grow * (r*sin(theta));
        vertex(x, y);
	}
	endShape(CLOSE);	
}

function water2(x, y) {
	translate(x, y);
	fill(wr, wg, wb);
	for (var i = 0; i < nPoints; i += 1) {
        var x = dist(mouseX, mouseY, width/2, height/2) * 1.2;
        var y = dist(mouseX, mouseY, width/2, height/2) * 1.2;
        var size = dist(mouseX, mouseY, width/2, height/2)/4;
		ellipse(x, y, size, size);
		push();
		fill(255);
		ellipse(x - 2, y, size - (size*0.6), size - (size*0.6));
		pop();

		var x1 = (dist(mouseX, mouseY, width/2, height/2)) * -1;
		var y1 = dist(mouseX, mouseY, width/2, height/2);
		var size1 = dist(mouseX, mouseY, width/2, height/2)/5;
		ellipse(x1, y1, size1, size1);
		push();
		fill(255);
		ellipse(x1 - 2, y1, size1 - (size1*0.6), size1 - (size1*0.6));
		pop();

		var x2 = (dist(mouseX, mouseY, width/2, height/2)) * -1.2;
		var y2 = (dist(mouseX, mouseY, width/2, height/2)) * -1.2;
		var size2 = dist(mouseX, mouseY, width/2, height/2)/4;
		ellipse(x2, y2, size2, size2);		
		push();
		fill(255);
		ellipse(x2 - 2, y2, size2 - (size2*0.6), size2 - (size2*0.6));
		pop();

		var x3 = (dist(mouseX, mouseY, width/2, height/2));
		var y3 = (dist(mouseX, mouseY, width/2, height/2)) * -1;
		var size3 = dist(mouseX, mouseY, width/2, height/2)/5;
		ellipse(x3, y3, size3, size3);	
		push();
		fill(255);
		ellipse(x3 - 2, y3, size3 - (size3*0.6), size3 - (size3*0.6));
		pop();

		var x4 = width/2;
		var y4 = (dist(mouseX, mouseY, width/2, height/2)) * -1.5;
		var size4 = dist(mouseX, mouseY, width/2, height/2)/5;
		ellipse(x4 - 200, y4, size4, size4);	
		push();
		fill(255);
		ellipse(x4 - 200, y4, size4 - (size4*0.6), size4 - (size4*0.6));
		pop();

		var x5 = width/2;
		var y5 = (dist(mouseX, mouseY, width/2, height/2)) * 1.5;
		var size5 = dist(mouseX, mouseY, width/2, height/2)/5;
		ellipse(x5 - 200, y5, size5, size5);	
		push();
		fill(255);
		ellipse(x5 - 200, y5, size5 - (size5*0.6), size5 - (size5*0.6));
		pop();
	}
}
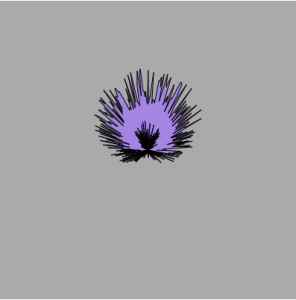


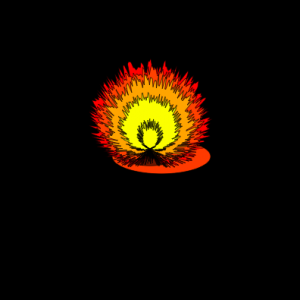
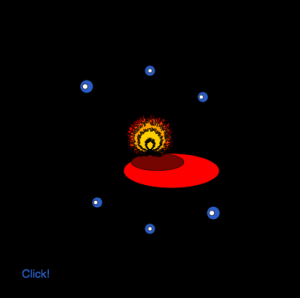
I liked working on this project because I gained a better understanding of how extensively you can use math in P5. I discovered how to make the flames by accident by randomizing one of the values in the equation of the curve. Once this happened, I was able to come up with a concept for the rest of the project. I liked working with colors and the mouseIsPressed conditional to change the image from red fire to blue fire. In the future, I would like to have a better ability to implement the map() function, as I feel that it would have been useful for my goals in this project.

Project 07 Curves – Sara Frankel

sketch

// Sara Frankel
// sfrankel
// Project 07
// Section A

function setup() {
    createCanvas(480, 480); 
}

var perwidth = 480.0; 
var constrainmin = 1.0;
var constrainmax = 1.4;

function draw() {
	
	background('pink');
	var changecenter = width/4 * mouseX / perwidth * constrain(1 - (mouseY / perwidth), constrainmin, constrainmax); // variable to insert into drawDevilsCurve to help assiciate its position from the 
																													// center curbe proportionately in both the x and y direction with the mouse

	//center curve
	drawDevilsCurve(true, width/2, height/2, 180, 150, 100);
	drawDevilsCurve(false, width/2, height/2, 180, 150, 100);
	
	//top left curve
	drawDevilsCurve(true, width/2 - changecenter, height/2 - changecenter, 40, 30, 35);
	drawDevilsCurve(false, width/2 - changecenter, height/2 - changecenter, 40, 30, 35);
	
	//bottom left curve
	drawDevilsCurve(true, width/2 - changecenter, height/2 + changecenter, 40, 30, 35);
	drawDevilsCurve(false, width/2 - changecenter, height/2 + changecenter, 40, 30, 35);

	//top right curve
	drawDevilsCurve(true, width/2 + changecenter, height/2 - changecenter, 40, 30, 35);
	drawDevilsCurve(false, width/2 + changecenter, height/2 - changecenter, 40, 30, 35);

	//bottom right curve
	drawDevilsCurve(true, width/2 + changecenter, height/2 + changecenter, 40, 30, 35);
	drawDevilsCurve(false, width/2 + changecenter, height/2 + changecenter, 40, 30, 35);
}

//-------------------------------------------------------

function drawDevilsCurve(isSide, centerX, centerY, maxA, maxB, nPoints) {
	
	var x;
	var y;
	var hx = mouseX / perwidth; //puts mouseX on a percent scale
	var hy = mouseY / perwidth; //mouseY on a percent scale
	var a = maxA * hx; //correlates maxA and hx for shape below
	var b = maxB * hy; //correlates maxB and hy for shape below
	var t = radians(2 * a); //angle of shape in relation to a

	beginShape();
	for (var i = 0; i < nPoints; i++) { //for loop to create the devils curve shape

		colorMode(HSB);
		stroke(280 * i, map(100 - i, 100, 0, 60, 0), 100 * i); //maps the color so that each curve corrolates in color (dependant on how many points are on the shape) in terms of pink
		
		var t = map(i, 0, nPoints, 0, TWO_PI); //maps the angle of the curve to corrolate with the number of points and i
		x = cos(t) * sqrt(((a * a) * (sin(t) * sin(t)) - (b * b) * (cos(t) * cos(t)) / (sin(t) * sin(t)) - (cos(t) * cos(t))));
		y = sin(t) * sqrt(((a * a) * (sin(t) * sin(t)) - (b * b) * (cos(t) * cos(t)) / (sin(t) * sin(t)) - (cos(t) * cos(t))));
		
		if(isSide){ //if statement that flips the curve over y=x so that it creates the same curve perpendicular to the original
			var temp = x;
			x = y;
			y = temp;
		}

		vertex(x + centerX, y + centerY); //draws curve
		vertex(-x + centerX, -y + centerY);	//draws inverse of curve (gives it the cool pointy look)

	}

	endShape(CLOSE);
	noFill();


}

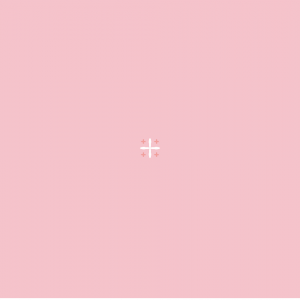
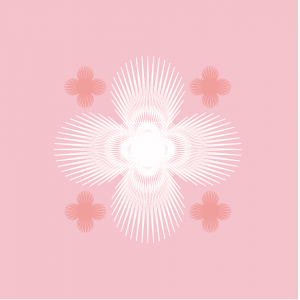
When I was looking through the catalog of curves, there was something that caught my eye about the devils curve. The proportions and visual aspects fascinated me. I decided to make almost these flower shapes in proportion of one another (as well as the mouse) and track along more or less the y = x plane. Screenshots as follow:


Pictured is what to expect when the shape is almost as small as it can go. It is a plus shape surrounded by smaller “+”s.


Pictured is medium size expected when x and y are closer to the center

Looking Outwards 07 – Min Lee


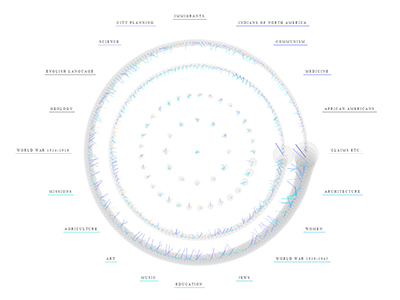
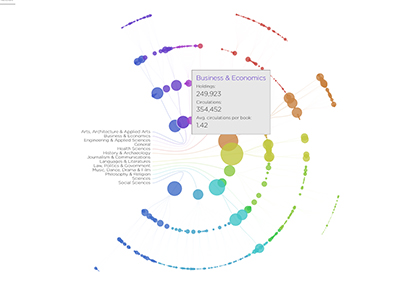
                               The Library Project’s Futuristic UI
    The Interface makes every collection and connections visible.

The Library Project created by Spacial Information Digital Lab is a digital interface for browsing all collections and connections at the Columbia University Library in a very visible way. It allows for easy browsing that invites curiosity in the readers. The reason this project stood out to me is its amazingly futuristic UI design. It’s the first step to a modern and forward-looking design for educational purposes. What I particularly admire is the institution’s design choices to make an interface that motivates readers. I could imagine this being a standard piece of technology used for education in the next decade or so.


Source: http://www.visualcomplexity.com/vc/project_details.cfm?id=967&index=967&domain=

Audrey Zheng – Project – 07

sketch

//Audrey Zheng
//Section A
//audreyz@andrew.cmu.edu
//Project-07


function setup() {
    createCanvas(400, 600);
}

function draw() {
	background(81,60,85);
    push();
    translate(width / 2, height / 3);

	drawHypotrochoid();
	drawHypocycloid();
	drawEpicycloid();

	pop();

	drawFlower(40,20);
    
}

function drawFlower(x,y) {

    translate(x, y);
	drawHypotrochoid();
	drawHypocycloid();
	drawEpicycloid();


}

function drawHypotrochoid() {
	var x;
	var y;

	var a = 100; //radius
	//var a = map(mouseX,0,width, 50,90);
	var b = 20; //spirograph radius

	//var b = map(mouseX,0,width,5,20);
	 //distance pen to center of spirograph

	var h = map(mouseX, 0, width, 40,60);

	
	//var h = map(mouseX, 0, width, 40,60);

	angleMode(DEGREES);
	stroke(189,230,137);
	fill(82,82,115);

	beginShape();


	for (var t = 0; t < 360; t++) {
		x = (a - b) * cos(t) + h * cos(((a - b)/b) * t);
		y = (a - b) * sin(t) - h * sin(((a - b))/b * t);


		vertex(x,y);


	}

	endShape(CLOSE);


}

function drawHypocycloid() {
	var x;
	var y;

	var a = 50; //radius
	//var a = map(mouseX,0,width, 50,90);
	var b = 10; //spirograph radius
	var n =  a/b;

	angleMode(DEGREES);

	stroke(98,210,159);
	fill(57,138,166,70);

	beginShape();
	var multiple = map(mouseY,0,height, -1,1)

	for (var phi = 0; phi <360; phi ++) {
		
		x = (a/n) * ((n-1) * cos(phi) - cos((n-1) * phi));

		y = (a/n) * ((n-1) * sin(phi) + sin((n-1) * phi));

		vertex(multiple *x,multiple *y);

	}
	endShape(CLOSE);
}

function drawEpicycloid() {
	var x;
	var y;

	var a = 40; //radius
	//var a = map(mouseX,0,width, 50,90);
	var b = 5; //spirograph radius

	angleMode(DEGREES);


	beginShape();


	var multiple = map(mouseY, 0, height, 1,2);;

	for (var phi = 0; phi <360; phi ++) {
		
		x = (a+ b) * cos(phi) - b * cos(((a + b)/b) * phi);

		y = (a + b) * sin(phi) -  b * sin(((a+b)/b) * phi);

		vertex(multiple *x, multiple *y);


	}
	endShape(CLOSE);

}


Jonathan Liang – Looking Outwards – 07

“I’m not a sheep” – Christopher Hitchens

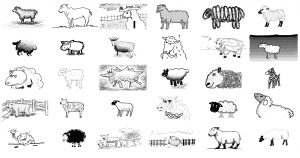
The Sheep Market is a work by digital artist Aaron Koblin. Koblin payed 2 cents to 10,000 workers in Amazon’s Mechanical Turk to draw a sheep facing left in 105 seconds. Amazon’s Mechanical Turk is an intelligence department within the company that employs people to perform and coordinate tasks that computers and artificial intelligence could not currently do. This project is a direct reflection of the values of the department, showing that computers could not generate the little differences from human experience and individuality. Only people could generate completely different sheep, a computer would computationally generate sheep that have different traits, but are fundamentally similar. The emphasis on human individuality and experience is what I appreciate about this particular project.

http://www.thesheepmarket.com/