Among the looking outwards projects by peers, I find Kevin (Riordan)’s Week 5 post very fascinating. I agree with Kevin on that I find the project amazing as it makes a highly intricate art work of very high quality, comparable to those in animated movies with two commonly used tools, python and maya. It is admirable how Caballer has developed the project in a way that allows to control extreme details. The project is able to demonstrate various facial and body structures, enabling expressions to be displayed. The body structure reflects the real structure of an animal; each eyeball, each eyelid, and each individual muscle on the eye are all separated, allowing the movements to be autonomous. These movements are delicately manipulated to show hundreds of different expressions and to display natural speech. The algorithm of allowing such details to be shown is joint-based system over a coordinate plane, which is a relatively simple algorithm for such a sophisticated work.
3D Troglodita Rig project by Sergi Caballer in 2012
Link to the original work: http://www.cgmeetup.net/home/troglodita-rig-demo-by-sergi-caballer/
Link to Kevin’s post: https://courses.ideate.cmu.edu/15-104/f2018/2018/09/27/kevin-riordan-looking-outwards-05-section-c/
I found Sharon’s Looking Outwards 04 post very interesting. She talked about how the creator wanted to add a new dimension to food and meals. I found the most interesting of the three projects to be the edible robotics embedded in a dessert, and think this has the most applications. I feel that the project focused too much on tying art into it, and I feel this could have valuable practical applications. For example, the idea of edible robotics is something that should definitely be explored further. Though this idea is very interesting, I think that further projects into this area could do much more imaginative and visually cooler stuff than this. I agree with Sharon that tying food and art together in this way is very cool though.
/*Sharon Yang
Section C
junginny
Project-09
*/

var underlyingImage;

function preload() {
    var myImageURL = "https://i.imgur.com/ZnYAlHy.jpg"; //image of my boyfriend smiling
    underlyingImage = loadImage(myImageURL);
}

function setup() {
    createCanvas(480, 480);
    background(0);
    underlyingImage.loadPixels();
    frameRate(300);
}

function draw() {
    var px = random(width); //the coordinates of where shapes created are randomized
    var py = random(height);
    var ix = constrain(floor(px), 0, width-1);
    var iy = constrain(floor(py), 0, height-1);
    var theColorAtLocationXY = underlyingImage.get(ix, iy); //get the colors of the pixel

    noStroke();
    fill(theColorAtLocationXY);
    drawShape(px, py, 5, 10);
}

function drawShape(x, y, radius1, radius2) { //draw star shape
    var angle = TWO_PI/5;
    beginShape();
    for (var i = 0; i < TWO_PI; i += angle) {
    var starX = x + cos(i) * radius2;
    var starY = y + sin(i) * radius2;
    vertex(starX, starY);
    starX = x + cos(i+angle/2) * radius1;
    starY = y + sin(i+angle/2) * radius1;
    vertex(starX, starY);
  }
  endShape(CLOSE);
}
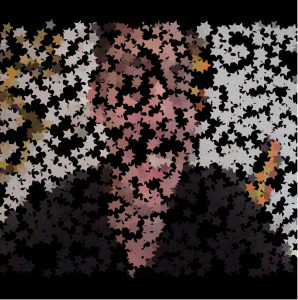
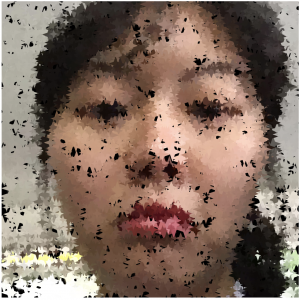
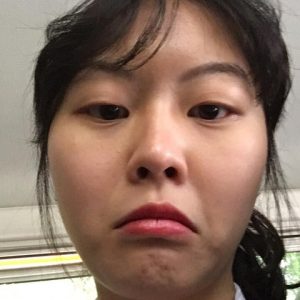
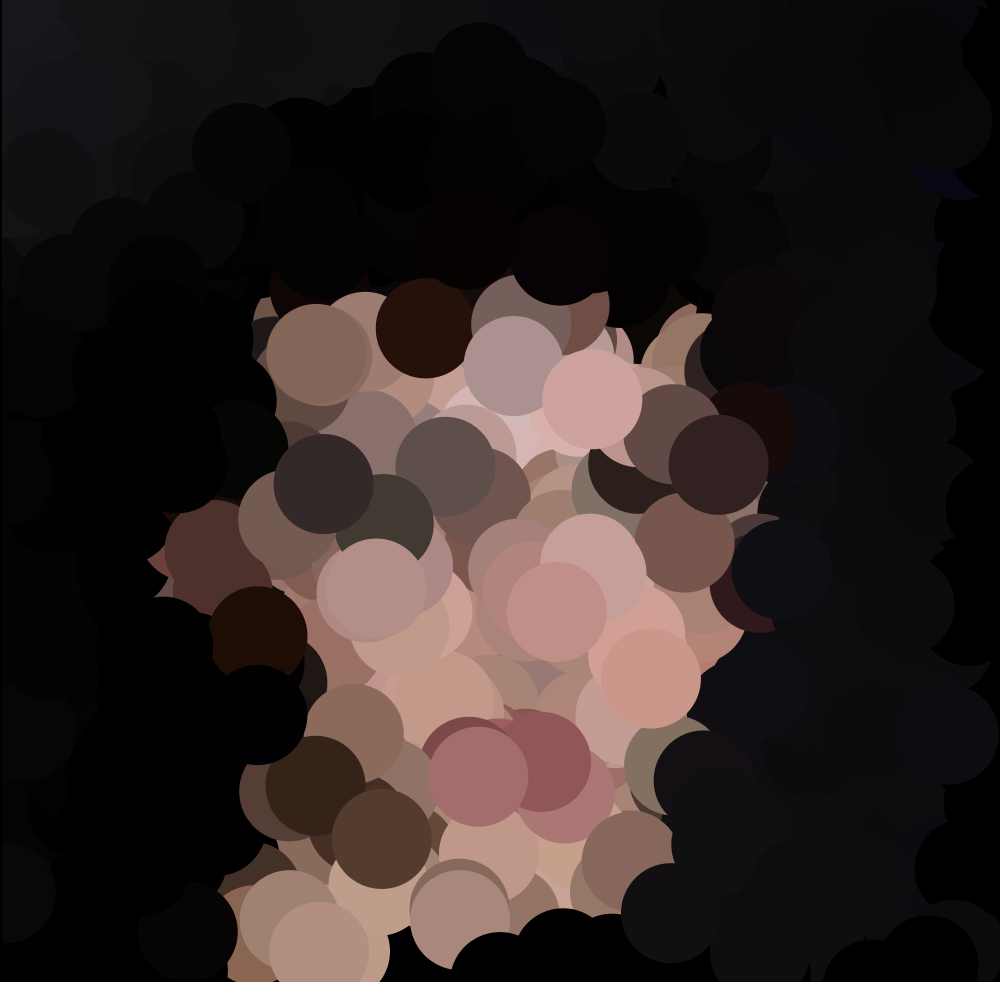
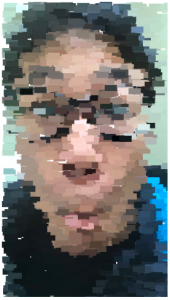
I have used an image of my boyfriend. The project incorporated a very interesting concept. However, because I used the star shape, and also the image was quite blurry, it became really hard to make out of what the image is.
/*Kevin Riordan
Section C
kzr@andrew.cmu.edu
project_09*/
var underlyingImage;
//making count variable, for end point and for switching point
var count = 0;

function preload() {
    var myImageLink = "https://i.imgur.com/UPry60m.jpg";
    myImage = loadImage(myImageLink);
}

function setup() {
    noStroke();
    createCanvas(480, 480);
    background(0);
    myImage.loadPixels();
}

function draw() {
    var posX = random(width);
    var posY = random(height);
    rectMode(CENTER);
    //front half uses createRect function
    if(count <= 5000) {
        var countMap1 = map(count,0,5000,100,20);
        createRect(int(posX),int(posY),countMap1 / 10);
        count++;
    }
    //back half uses detailedRect function
    else if(count <= 10000) {
        createDetailRect(posX,posY,2);
        count++;
    }
}
//making larger crosses at the beginning
function createRect(initialX, initialY, size) {
    var iX = constrain(floor(initialX), 0, width - 1);
    var iY = constrain(floor(initialY), 0, height - 1);
    var pixelColor = myImage.get(iX, iY);
    fill(pixelColor);
    for(var i = size; i > 0; i --) {
        var cCoord = map(i,0,size,size * 2,0);
        rect(initialX + cCoord,initialY,i,i);
        rect(initialX - cCoord,initialY,i,i);
        rect(initialX,initialY - cCoord,i,i);
        rect(initialX,initialY + cCoord,i,i);
    }
}
//making detailed shapes for the end
function createDetailRect(initialX, initialY, size) {
    var iX = constrain(floor(initialX), 0, width-1);
    var iY = constrain(floor(initialY), 0, height-1);
    var pixelColor = myImage.get(iX, iY);
    fill(pixelColor);
    for(var change = 0; change <= 12; change ++) {
        var side = map(change,0,12,1,0);
        rect(initialX + (change / 2),initialY,size * side,size * side);
        rect(initialX,initialY + (change / 2),size * side,size * side);
        rect(initialX + (change / 2),initialY + (change / 2),size * side,size * side);
        rect(initialX - (change / 2),initialY,size * side,size * side);
        rect(initialX,initialY - (change / 2),size * side,size * side);
        rect(initialX - (change / 2),initialY - (change / 2),size * side,size * side);
        rect(initialX + (change / 2),initialY - (change / 2),size * side,size * side);
        rect(initialX - (change / 2),initialY + (change / 2),size * side,size * side);
    }
}
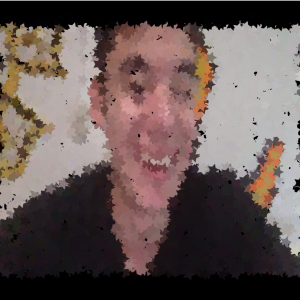
I started this project by making a function based on the example code in the project description. It was pretty cool modifying the code and seeing what shapes appeared, and I played around with making an overall count variable that caused the size to decrease, increasing the detail. If I had more time, I would have played around with constraining the detailing after the count was above 5000, to constrain it to areas that had not been filled in. Overall, though, I am pretty satisfied with this project.
picture at beginning (count <2500)picture during middle (count = 5000)picture at end (count = 10000)reference picture i used for underlying image
/*
Connor McGaffin
Section C
cmcgaffi@andrew.cmu.edu
Project-09
*/

var nick;
var i = 17.5;
var circ = i / 2;

function preload() {
    var myImageURL = "https://i.imgur.com/v0CY2zp.jpg";
    nick = loadImage(myImageURL);
}

function setup() {
    createCanvas(480, 480);
    nick.loadPixels();
    frameRate(10);
    noStroke();
}

function draw() {
        gridImg();
        bar();
        repaint();
}

function bar() {
    if(mouseIsPressed){
        fill(0, 45, 80);
        rect(0, 0, width, 2 * i);
    } else {
        fill(0, 80, 45);
        rect(0, 0, width, 2 * i);
    }
}

function repaint(){
    if(mouseIsPressed){
        for(var px = 0; px < width; px += i){
            for(var py = 2 * i; py < height; py += i){
                fill(random(0,20),random(50,90),random(50,110));
                ellipse(px + (i / 2), py + (i / 2), circ);
            }
        }
    }
}

function gridImg() {
    for(var px = 0; px < width; px += i){
        for(var py = 0; py < height; py += i){
            var ix = constrain(floor(px), 0, width - 1);
            var iy = constrain(floor(py), 0, height - 1);
            var theColorAtLocationXY = nick.get(ix, iy);
            fill(theColorAtLocationXY);
            rect(px, py, i, i);
            fill(random(0,20),random(50,110),random(50,90));
            ellipse(px + (i / 2), py + (i / 2), circ);
        }
    }
}
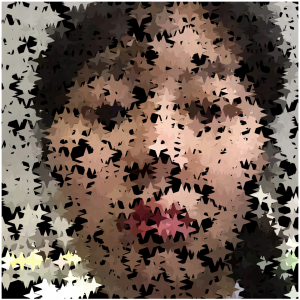
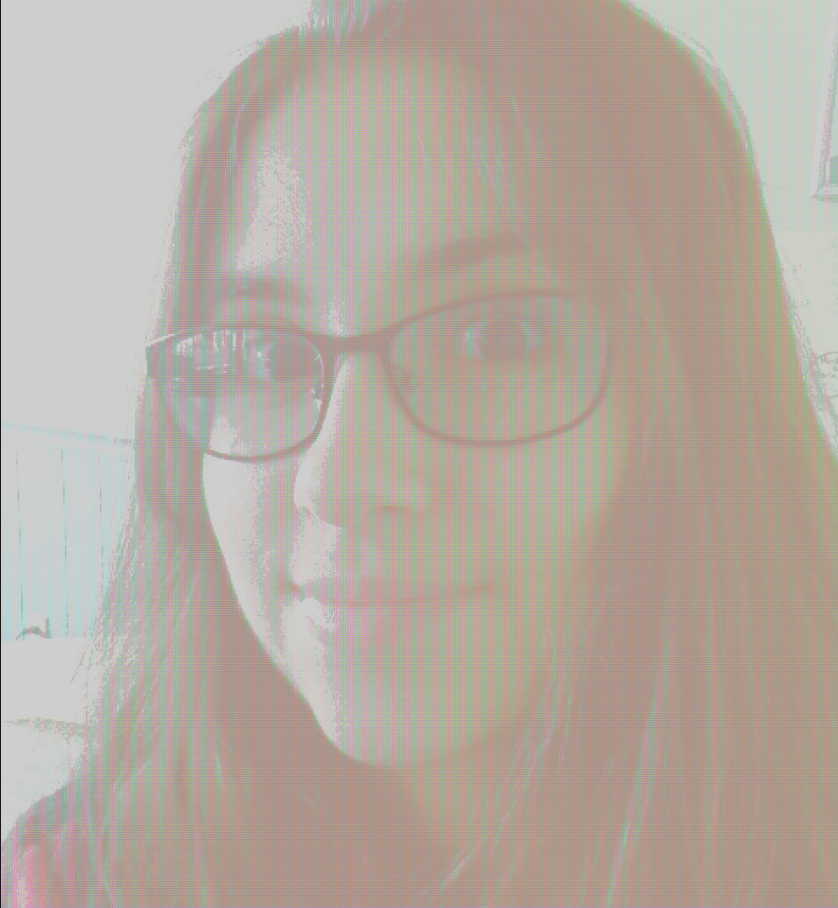
In the project brief, I was most excited by the work of Chuck Close. I was interested in the construction of his portraits and how he can create new colors simply by nesting circles within polygons. I wanted to find the overlap between systematic painting techniques and digital media. Knowing that Close uses complimentary colors to create his specific optical hues, I selected green and blue to compliment the pinks and rust oranges in the photo of my friend, Nick.
Once I created the gridded out and dotted portrait, I wanted to make it feel less static. To do this, I randomized each circle so that the colors are statistically more likely to be a shade of green, but when the viewer clicks on the portrait, these dots shift towards favoring shades of blue.
I genuinely enjoyed this project once I got the hang of it. Sending progress pictures of the portrait to my friend drove me to keep pushing myself forward.
the original photoearly experimentation where the “#” symbol was generating his face over timethe result of scaling up the ellipses encouraged me to explore the more abstract
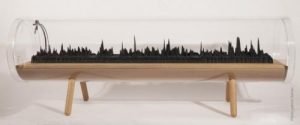
Images from the UK cities line
When going through various Looking Outwards, I found a post by Curran which talked about a 2018 Craig Taylor/Ito Design project called Coral Cities that was an interesting take on mapping cities. As a fellow architecture student, I found this project really cool but also really simple. It’s not much different than what Walkscore’s doing (here‘s an example using their API) in measuring travel times from a point, and it just takes that data, adds an aesthetics-only gradient and gradually increases its elevation and tapers off. I think what helps is the really stunning rendering that’s clean and makes the forms really pop. I think it’s worth noting that the run of data that focused on the most livable cities came from an existing list by Mercer and the displayed data is only travel distance in 30 minutes from the city center. Additionally I wouldn’t see this as a functional map, but instead as just a translation of utilitarian data into art. I’d argue that maps as they are now work well and don’t need to change. The map went from paper and static to digital and interactive, like Google Maps. However, art pieces using maps are great case studies, as road maps are what we think of in architecture. They’re site-specific. They’re made by and for humans. There’s an organic randomness that’s very deliberate. That side of maps are a cool field to look into.
Kthies sketch
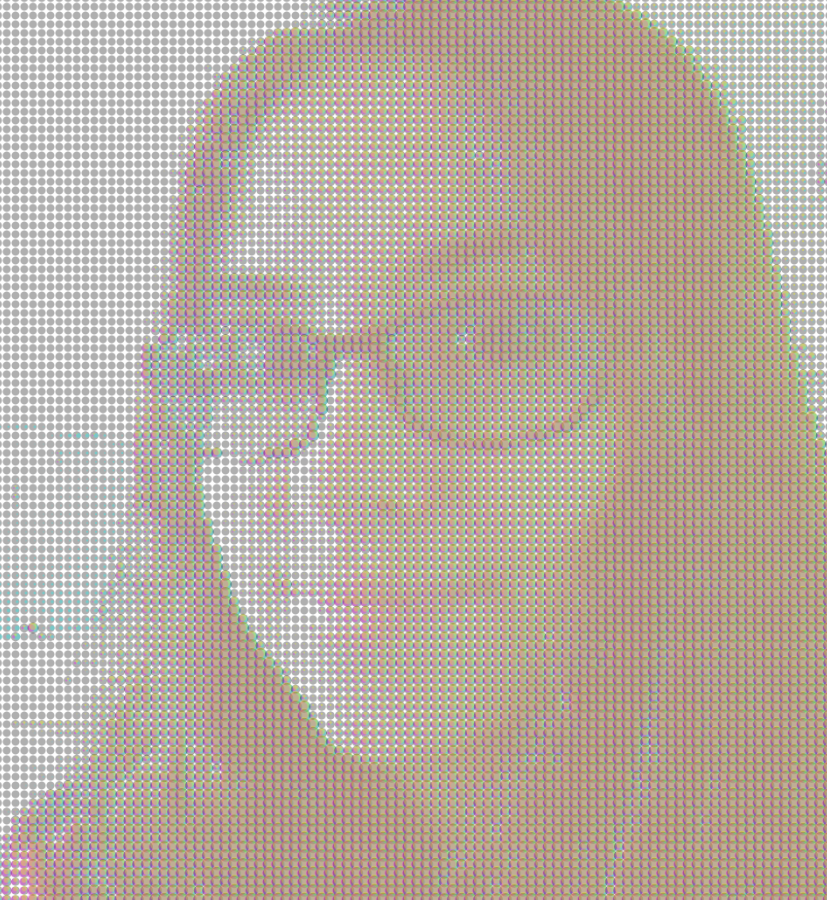
So originally, I was planning on doing just a greyscale image that used the white space to display grayscale, but my friend Raven (pictured) has been working on a project related to superheros, which made me think of comics and how those were printed early on, so I expanded the project scope to take an image and break it down into simulated CMYK values (it’s just RGB in the end because screens) with each of those being slightly offset from the analyzed pixel. I think it turned out really well and makes cool-looking images! This is when the distance between “pixels” is 1 This is when the distance between “pixels” is 5
// Kevin Thies
// Section C
// kthies@andrew.cmu.edu
// Project 09 - Computational Portrait

var portrait;           // the image
var pixels = [];        // holds the pixels
var step = 6;           // distance between "pixels"
var radiusV;            // radius of value circles
var radiusR;            // radius of red circles
var radiusG;            // radius of green circles
var radiusB;            // radius of blue circles
var rgb = [];           // holds RGBA values of pixels


// preload image
function preload() {
    var myImageURL = "https://i.imgur.com/sveeELP.jpg";
    portrait = loadImage(myImageURL);
}

function setup() {
    createCanvas(480, 520);
    background(255);
    portrait.loadPixels();
    noLoop();
    noStroke();
}

function draw() {
    // get a grid of positions one step apart

    for(var x = 0; x < width; x += step) {
        for(var y = 0; y < height; y += step) {

            // value ===============================================

            // kept darker than the color values to just balance it out
            // RGB is structured the same way, just not using brightness but direct
            // R, G, and B values

            // sets the radius of the circle, remapping the value of color/brightness
            // to a circle between 0 and step * 1.3 in diameter
            // with step > 1, it means the colors can overlap, hiding the white background
            radiusV = map( brightness( portrait.get(x * 2, y * 2) ),
                          255, 0,
                          0, step * 1.5 );

            // sets the fill color with transparency
            fill(0, 0, 0, 80);

            // draws the ellipse at the point
            ellipse(x, y, radiusV, radiusV);

            // RGB ==================================================

            // rgb takes on the [R, G, B, A] values as an array
            rgb = portrait.get(x * 2, y * 2);

            print(rgb[0] + "  " + rgb[1] + "  " + rgb[2] + "  " + rgb[3]);
            // by filling the color with 255 of not that color, when stacked up the
            // colors match - ex. red = 0,255,255 g = 255,0,255 b = 255, 255, 0
            // basically I translated RGB to CMY

            // red / cyan
            radiusR = map(rgb[0],
                          255, 0,
                          0, step * 1.3);
            fill(0, 255, 255, 80);
            ellipse(x + step / 5, y, radiusR, radiusR);

            // green / magenta
            radiusG = map(rgb[1],
                          255, 0,
                          0, step * 1.3);
            fill(255,0,255, 80);
            ellipse(x - step / 5, y, radiusG, radiusG);

            // blue / yellow
            radiusB = map(rgb[2],
                          255, 0,
                          0, step * 1.3);
            fill(255,255,0,80);
            ellipse(x, y - step / 5, radiusB, radiusB);
        }
    }
}
//Christine Seo
//Section C
//mseo1@andrew.cmu.edu
//Project 9

var sisterImg;

function preload() {
	//loading the picture
    sisterImg = loadImage("Sister.png");
}

function setup() {
	//set up canvas
    createCanvas(480, 480);
    background(0);
    sisterImg.loadPixels();
    //load 200 times in a minute
    frameRate(200);
}

function draw() {
    var px = random(width);
    var py = random(height);
    var cx = constrain(floor(px), 0, width-1); //constraining the placement of pixels
    var cy = constrain(floor(py), 0, height-1);
    var colorAtLocationXY = sisterImg.get(cx, cy);

    //draw traingles
    noStroke();
    fill(colorAtLocationXY);
		triangle(px-random(20), py-random(20), px-random(20), py-random(20), px+random(20), py+random(20));

}
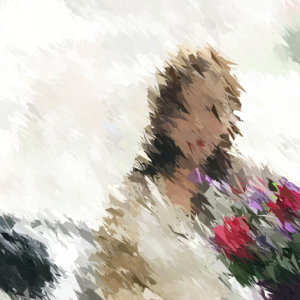
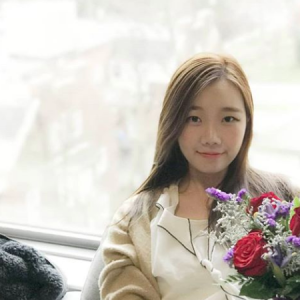
Potential Final ImageOriginal image of my sister
I created an abstract portrait of my sister holding flowers. I wanted to use randomly sized triangles to represent the pixels. I was quite happy with the result as it made the portrait quite abstract but you could still tell what the picture is to a certain degree.
I decided to discuss rjpark’s Looking Outwards 03, about Gilles Azzaro’s 3D printed sculptures based on sound. This project is interesting to me because it is a way for people to visualize audio in physical form. According to the blog post, the artist uses audio samples of events or speeches that he values. I agree that the 3D sculptures serve as a beautiful representation of historical events, whether it may be global or local; memories or past events are very important because they have the power to define individuals or groups of people. In the future, it would be great if the artist used a much bigger 3D printer to make bigger versions of the audio. They can be like landmarks that help bring people together.
// Justin Yook
// jyook@andrew.cmu.edu
// Section C
// Project 09

var underlyingImg;

function preload() {
    var imgURL = "https://i.imgur.com/25HDnhA.jpg";
    underlyingImg = loadImage(imgURL);
}
function setup() {
    createCanvas(270, 480);
    background(255);
    underlyingImg.loadPixels();
    frameRate(60);
}

function draw() {
    var x = random(width);
    var y = random(height);
    var px = constrain(floor(x), 0, width-1);
    var py = constrain(floor(y), 0, height-1);
    var theColorAtLocationXY = underlyingImg.get(px, py);

    noStroke();
    fill(theColorAtLocationXY);
    rect(x, y, 20, 10);
}
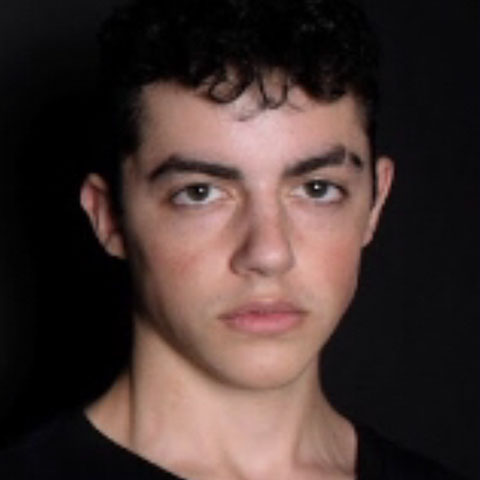
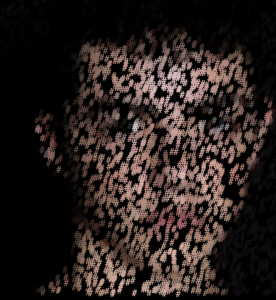
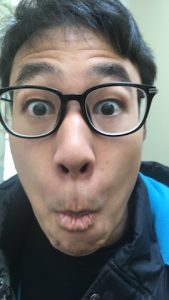
For the portrait, I used my friend’s face. I kept playing around with the style of points being drawn, but I decided on a long rectangle because it reminded me of actual old paintings; in addition, the slight obscurity of his face made it look less boring. I also set the frame-rate to be higher so it paints the portrait faster.
![[OLD FALL 2018] 15-104 • Introduction to Computing for Creative Practice](../../../../wp-content/uploads/2020/08/stop-banner.png)