LookingOutwards-07: Sec C Sophia Kim

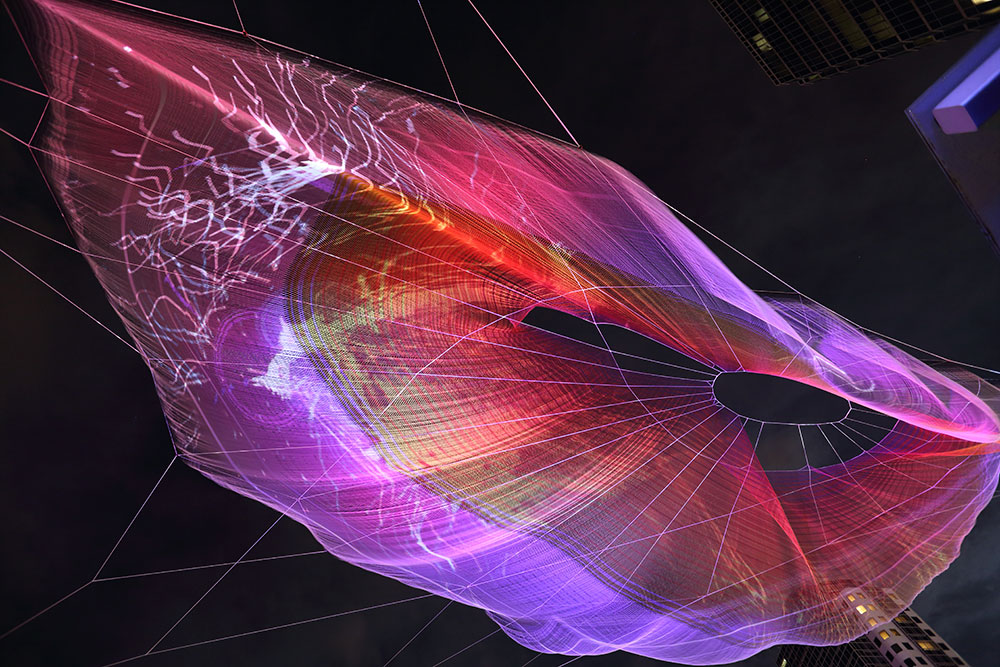
“Unnumbered Sparks” is an interactive sculpture that was created by Janet Echelman, Aaron Koblin and his team at the Google Creative Lab. This massive sculpture in the sky is mainly crowd-controlled, because the users are the ones who create the visuals, which are projected from their mobile devices. Ever since I studied fine arts and transitioned into design, I always had a passion for interactive, digital, and societal art. “Unnumbered Sparks” is a perfect example of the type of art I enjoy, combining digital and interaction. I love how Echelman and Aaron achieved their goal of making this project mainly run by the common people. Users are able to draw different lines and shapes with various colors just on their phone. I admire how each interaction a person has is very different and personal. Seeing their own art floating in the sky gives the user a celestial-like experience. Also, I enjoy how there are other elements like sound that is part of this experience, which also adds ambience to the environment.

This sculpture mainly uses a website that’s on a browser. This interactive art is very easy to use. The user only needs to connect to the WIFI to get access to a “remote control”-like website to draw. The Google Creative team used projection mapping to visualize the drawings. To allow this collaboration, the team used a program, which they created, called “Go.” It is similar to two coding programs: Python and C. “Go” is useful for high throughput networking. To create a 3D model, the team used Chrome and WebGL. These programs allowed the team to perfectly project onto the complex sculpture. With all these complex steps, all the designers had to consider other elements like weather, temperature, and wind change.

ChristineSeo- Looking Outwards – 07

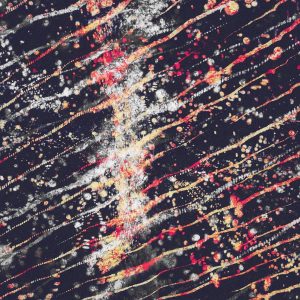
A physical simulation was used to control organically moving lines and curves.
Abstract geometric shapes visualize raw sensor data without the involvement of humans.
Geometric textures form the baseline for reflections on the car’s beautiful surface.

Studio NAND wanted to capture the experience of driving through data visualization with light and motion. They used realtime video production to interact cars and humans together by projecting onto walls. They used speed, acceleration, heart rate, and sound to create textures, patterns and dynamic shapes to visualize the data. The installation was originally for Infinity, as they wanted to visually replicate the experience in the car: they wanted to focus on design and technology in order to communicate in meaningful and engaging ways. Studio NAND work with different teams in design and production to work with various clients and inventions.

I think it is very intriguing how the project shows something that are usually not visually represented. Experience is something that requires practical contact and encounter with the specific observation of the event. However, Studio NAND was able to take a step further to visualize the data into a beautiful artwork. I also think the interaction between humans are cars are interesting too, as humans have to drive the car in order for it to work; and having them interact physically through data (such as hear rate and acceleration) is very fascinating. However, I wish that instead of only two walls being used to protrude the data, there were more (front and back) to capture a greater sense of the experience. The project not only reaches beyond the expectations of the experience inside of the car, but also has a deeper meaning through the connection of technology and men.

https://nand.io/projects/infinity

Robert Oh- Project07- Abstract Clock

version2

//Robert Oh
//Section C
//rhoh@andrew.cmu.edu
//Project-06-Abstract_Clock

//assigning variables
var i = 0;
var rainArrayX = [];
var rainArrayY = [];
var currSec = 0;

//making the rain cloud
function cloud(x, y) {
    noStroke();
    fill(255);
    ellipse(x - 40, y, 60, 50);
    ellipse(x - 20, y, 50, 55);
    ellipse(x, y, 50, 55);
    ellipse(x + 25, y, 60, 50);
}

//x and y are the bottom left part of the cup, y2 is the water level
function cup(x, y, y2) {
    //the actual cup
    fill(198, 201, 255);
    quad(x, y, x - 5, y - 40, x + 25, y - 40, x + 20, y);

    //the water level
    fill(155, 255, 238);
    quad(x, y, x - ((y - y2) / 40 * 5), y2, x + 20 + ((y - y2) / 40 * 5), y2, x + 20, y);
}

function setup() {
    createCanvas(400, 400);
    noStroke();
}

function draw() {
    background(116, 121, 232);
    var H = hour() % 12;
    var M = minute();
    var S = second();

    //this nested for loop draws all the cups and correct water levels
    for (i = 0; i < 2; i++){
        for (j = 0; j < 6; j ++){
            if (i * 6 + j < H){
                cup(j * 65 + 20, 300 + i * 80, 300 + i * 80 - 40);
            }
            else if (i * 6 + j == H){
                cup(j * 65 + 20, 300 + i * 80, 300 + i * 80 - (40 * M / 60));
            }
            else {
                cup(j * 65 + 20, 300 + i * 80, 300 + i * 80);
            }
        }
    }

    //drawing the cloud
    cloud(H % 6 * 65 + 40, 50);

    //checking which cup row to go to
    if (H % 12 < 6){
        var k = 0;
    }
    else {
        var k = 1;
    }

    //adding a rain drop every second by using an array
    if (currSec != S){
        rainArrayX.push(H % 6 * 65 + 30);
        rainArrayY.push(80);
        currSec = S;
    }
    
    for (m = 0; m < rainArrayX.length; m ++){
        if (rainArrayY[m] >= (300 + k * 80 - 8)){
            rainArrayX.shift();
            rainArrayY.shift();
            m --;
        }
        else {
            fill(155, 255, 238)
            rect(rainArrayX[m], rainArrayY[m], 2, 8);
            rainArrayY[m] += 1;
        }
    }
}

I remember when I started brainstorming for this project, I looked outside my window and noticed that it was raining. And so, I thought to myself, “how can I add rain to this project?” After a lot more thinking, I was able to come up this project. I really enjoyed incorporating time into this project. Each cup represents the hour (in a 12-hour cycle), each minute increases the water level, and each second adds another rain drop.

Rjpark – Project 06 – Abstract Clock

rjpark_abstractclock

var H; // current hours
var M; // current minutes
var S; // current seconds
var hr; // hour rgb
var hg;
var hb;
var mr; // minute rgb
var mg;
var mb;
var sr; // second rgb
var sg;
var sb;
var bc; // background color
var lc; // line color

function setup() {
    createCanvas(380, 480);
}

function draw() {
	H = hour();
	M = minute();
	S = second();

	var mapH = map(H, 24, 0, height, 0);
	var mapM = map(M, 59, 0, height, 0);
	var mapS = map(S, 59, 0, height, 0);

	// switching colors depending on day or night
	// day = midnight (0:00) to noon (12:00)
	// night = noon (12:00) to midnight (24:00)
	if (H < 12) { // day
		hr = 170;
		hg = 40;
		hb = 250;
		mr = 45;
		mg = 250;
		mb = 45;
		sr = 30;
		sg = 185;
		sb = 250;
		bc = 220;
		lc = 0;
	}
	if (H >= 12) { // night
		hr = 50;
		hg = 5;
		hb = 75;
		mr = 10;
		mg = 60;
		mb = 10;
		sr = 30;
		sg = 35;
		sb = 90;
		bc = 30;
		lc = 255;
	}

	// day or night colored rectangles
    fill(hr, hg, hb);
    noStroke();
    rect(0, 0, width / 3, height);
    fill(mr, mg, mb);
    noStroke();
    rect(width / 3, 0, width / 3, height);
    fill(sr, sg, sb);
	noStroke();
	rect(2 * width / 3, 0, width / 3, height);

	// moving of rectangle for hours
	fill(bc);
	noStroke();
	rect(0, 0, width / 3, mapH);

	// moving of rectangle for minutes
	fill(bc);
	noStroke();
	rect(width / 3, 0, width / 3, mapM);

	// moving of rectangle for seconds
	fill(bc);
	noStroke();
	rect(2 * width / 3, 0, width / 3, mapS);

	// markings for hours, minutes, seconds
	for (var hi = 0; hi < 24; hi ++) {
		stroke(lc);
		strokeWeight(1);
		line(0, (height / 24) * hi, width / 12, (height / 24) * hi);
		if (hi == 3 || hi == 6 || hi == 9 || hi == 12 || hi == 15 || hi == 18 || hi == 21) {
			line(0, (height / 24) * hi, width / 6, (height / 24) * hi);
			line(width / 3, (height / 11.9) * hi, 6 * width / 12, (height / 11.9) * hi);
		}
	}
	for (var mi = 0; mi < mapM; mi ++) {
		stroke(lc);
		strokeWeight(1);
		line(width / 3, (height / 11.9) * mi, 5 * width / 12, (height / 11.9) * mi);
	}
	for (var si = 0; si < mapM; si ++) {
		stroke(lc);
		strokeWeight(1);
		line(2 * width / 3, (height / 5.9) * si, 3 * width / 4, (height / 5.9) * si);
	}
}

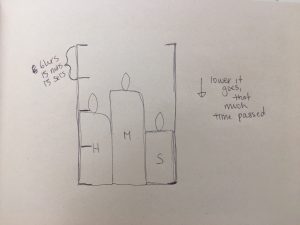
I drew my inspiration from candle clocks which was used a long time ago to tell time. You can tell how much time as passed by seeing how much of the candle has melted. Similarly, I created an abstract clock that mimics the candle clock, only mine has tick markings on the side so you can better tell what time it is.

(in regards to longer tick markings) It goes from 12am to 6am to 12pm to 6pm to 12 am again for the hours. It goes from 0 to 15 to 30 to 45 minutes. The seconds go by 10s. Also, when the time hits 12pm, the colors switch from bright (day) to dark (night) colors.

Joanne Lee – Looking Outward 06

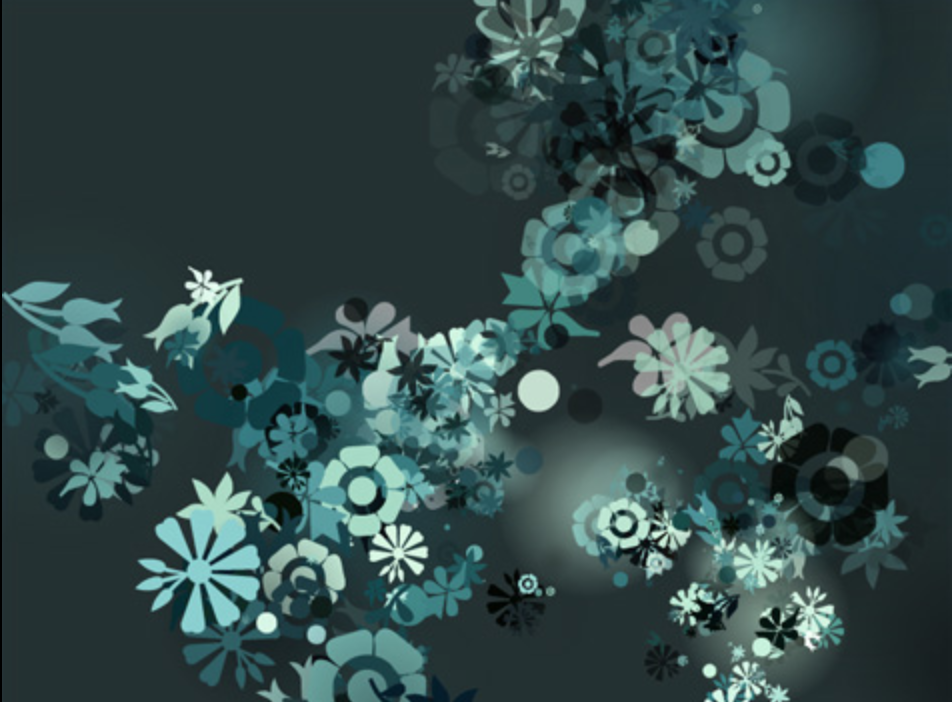
James White’s early forge output using flower dingbats and the color palette from a scene in ‘300’ (2007).

James White created a program called Forge, which helps White to create art pieces where many elements are out of his control. I admired that not only did he want to create random art, but he also created a program / tool to help himself and other artists do the same. He stated that, “The program forces me to allow elements to react unto themselves.” I think as an artist, you usually want to be in control of every element and it is interesting that he wanted to help himself let go more.

Although I am not sure how the algorithm runs, I am assuming that he is able to input certain general shapes or patterns he likes and the program is able to iterate them in different sizes, colors, and positions randomly. The artist still has control in the sense that they are able to decide what sorts of shapes and patterns are in the artwork, however, must let go in order to get the full effect of randomness. By using a program to aid him, it is truly random since humans struggle to make random choices. The result is a beautiful piece of art and it seems like White has modified the image afterwards adding fade effects, etc. I admire that he created his own program to aid his work.

Alexandra Kaplan – Looking Outwards – 06

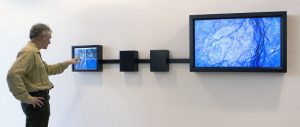
What the E-volver looks like
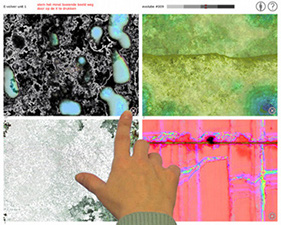
Illustrates the human interaction component

The concept of the project E-volver (created in 2006) is to have humans introduce the concept of randomness. It is a software that has an “image breeding machine” that a human “gardener” can collaborate with in order to create a piece of art. I am not completely sure how the algorithm works, but it seems that there are 4 animations that go into it and randomly interact with each other. Humans add another component of randomness to it by choosing an image to be left out of the algorithm until the next person comes by and chooses the image they wish to be left out. I thought that this project was really interesting in how it had an interactive component that was essential to the purpose of the piece.

Video of one of the final pieces of art.

Sophie Chen – Project 06 – Abstract Clock

sketch

var yoff = 0.0 ; 


function setup() {
    createCanvas(600, 600);
    
}

function draw() {
	background(255, 250, 200);
    // Current time
    var H = hour();
    var M = minute();
    var S = second();

    // Map time to dimensions
    var mappedH = map(H, 0, 23, 0, height); // sun is at the bottom of the canvas at midnight, and moves up as each hour passes and is at the top of the canvas by noon.
    var mappedM = map(M, 0, 59, height - 245, 0 - 265); // minutes wave starts at the bottom of the canvas and ends at the top
    var mappedS = map(S, 0, 59, height - 265, 0 - 360); // seconds wave starts at the bottom of the canvas and ends at the top 
    
    // Sun
    fill(255, 215, 0);
    noStroke();
    ellipse(width / 2, mappedH, 200, 200);
    
    // Minutes
    fill(50, 170, 250, 90);
    beginShape(); 
    var xoff = 0;

    for (var x = 0; x <= width; x += 10) {
    // Noise
    var y = map(noise(xoff, yoff), 0, 1, 200, 300) + mappedM; // the level of the wave increases horizontally each minute
    // Set vertex
    vertex(x, y); 
    // Increase x dimension for noise
    xoff += 0.04;
  }
    // Increase y dimension for noise
    yoff += 0.005;
    vertex(width, height);
    vertex(0, height);
    endShape(CLOSE);
    
    // Seconds
    fill(50, 190, 150, 90);
    beginShape(); 
    var xoff = 0;     
    
    for (var x = 0; x <= width; x += 10) {
    
    // Noise
    var y = map(noise(xoff, yoff), 0, 1, 200, 400) + mappedS; // the level of the wave increases horizontally each second
    // Set vertex
    vertex(x, y); 
    // Increase x dimension for noise

    xoff += 0.04;

  }
    // Increase y dimension for noise
    yoff += 0.005;
    vertex(width, height);
    vertex(0, height);
    endShape(CLOSE);
}

For this project I wanted to create something more environmental and fluid in contrast to the constant and rigid nature of time passing. My concept was to have the sun move up or down according to the hour and two different layers of landscape/waves, one indicating seconds and one indicating minutes. I thought perlin noise would be perfect for this, and although it took me a while to understand how to manipulate the variables, I think it came together nicely in the end.

sketch

Sophia Kim-Project 6-Abstract Clock/Sec C

sketch

// Sophia S Kim
// Section C 1:30
// sophiaki@andrew.cmu.edu 
// Project-06-Abstract Clock


function setup() {
  createCanvas(480, 480); 
}

function draw() {
  //time variables 
  var H = hour();
  var M = minute();
  var S = second();

  //gets darker by the HOUR
  background (233 - (2*H), 237 - (2*H), 255 - (2*H));

  // variables for objects 
  var lemonWidth; //width of lemon
  var lemonHeight; //height of lemon 
  var liquidY = 190; //liquid Y psition
  var liquidH = 210; //liquid height
  var dropX = []; //water drop X
  var dropY = []; //water drop Y


  //static table 
  noStroke();
  fill(140, 94, 3);
  rect(0, 350, 480, 100); //top of table

  noStroke();
  fill(102, 69, 2);
  rect(0, 450, 480, 30); //side of table

  //static beach sand 
  noStroke();
  fill(242, 211, 148); 
  rect(0, 240, 480, 110);

  //beach water
  //water gets darker ever hour 
  noStroke();
  fill(62 - (2*H), 214 - (2*H), 255 - (2*H));
  ellipse(240, 240, 600, 130);
  rect(0, 140, 480, 80);

  //lemon 
  //changes lemon width and height every SECOND 
  //pattern of not squeezed and squeezed
  fill(226, 239, 48);
  if((S%2) > 0) {
    lemonWidth = 70;
    lemonHeight = 70;
  } 
  else {
    lemonWidth = 60;
    lemonHeight = 40;
  }
  ellipse(295, 180, lemonWidth, lemonHeight);

  //drink glass
  noStroke();
  fill(161, 235, 255);
  rect(185, 180, 110, 220);
  ellipse(width/2, 398, 110, 60);

  //drink liquid
  noStroke();
  fill(234, 117, 117);
  ellipse(width/2, 398, 100, 50);
  rect(190, liquidY + (3*M), 100, liquidH - (3*M));
  //allows liquid to decrease every MINUTE
}

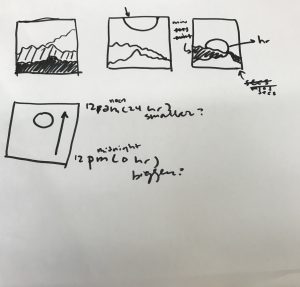
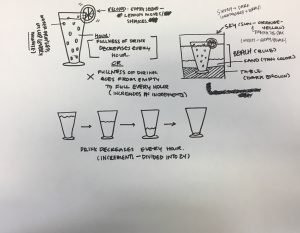
I wanted to make an illustration that relaxed the viewers and made them not too anxious about time. The possible settings I was thinking about were beaches, mountains, and waterfalls. I was craving bubble tea this whole week, so I decided to make a drink with a beach view. At the beginning of sketching, I got very excited with my concept. However, overtime, I decided to change the original parts of the abstract clock to something new. At first, I wanted to make water droplets to form on the glass every minute. Instead, I made the liquid level to decrease by every minute. For every hour, I changed the sky color and the ocean water color to become darker. At first, I had a hard time with how the time variables would interact with the shapes and colors. Midway through the process, I started to get the hang of where the time variables can be used in the code. I had a lot of fun with this assignment, because seeing the colors and the liquid height change were very satisfying.

Sharon Yang Looking Outwards -06 Randomness in Art


Vladimir Kanic’s Random Generative Art

Generative art pieces based on randomness that I find admirable is Vladimir Kanic’s art pieces. The artist was inspired by chaos theory and explored using randomness as a structure of his works. The type, the genre and the content of his works were determined through observing and measuring random events. In order to do this, he devised a system which models randomness called ‘Magic Box’, which is twelve boxes being given to random art directors, and each one put a random number of randomly selected objects inside. Then, a group of random people placed the objects in the boxes a completely random and unorganized stash, and the artist chose one of the boxes to generate art out of it. He mainly created a film out of these random objects, generating patterns using various algorithms to create even more randomness in his pieces.

Catherine Coyle – Looking Outwards – 06

Jackson Pollock is on of my favorite artists and as he was mentioned in the description for this assignment, his work with ‘drip painting’ (splatter paint) is the definition of randomness in art.

Pollock’s work ‘Autumn Rhythm’


It is hard to say what his intentions and feelings were when making these paintings, I’ve heard this style called ‘action painting’ because the artist can literally be just throwing paint at the canvas. In this way, the art can feel very emotional while also being completely random. There’s no real way/reason to predict where the paint will land on the canvas, but that is part of the emotion and feeling behind it.

I think Pollock’s work in this area is very admirable as it was extremely experimental but it caught on. I think it is amazing how even pure randomness can create beautiful artworks.