Alexandra Kaplan – Project 07 – Curves

curves

/* 
Alexandra Kaplan
Section C
aekaplan@andrew.cmu.edu
Project - 07 
*/


var nPoints = 400; // length of all for loops

function setup() {
    createCanvas(480, 400);
    background(220);    
}

function draw() {
	background(150, 200, 255);
	drawStem1();	
	drawEpicycloid1();
	drawCenter1();
	drawStem2();
	drawEpicycloid2();
	drawCenter2();
	drawStem3();
	drawEpicycloid3();
	drawCenter3();
}

// draws middle flower
function drawEpicycloid1() { 
	var x;
	var y;
	var b = 4 + (mouseX/50); // frequency of curves
	var a = map(mouseY, 0, 400, 200, 0); // diameter of path of curve
	var h = 10 // distance from path to outer curve

	fill(220, 200, 100);
	stroke(180, 160, 60);

    beginShape();
	for (var i = 0; i < nPoints; i += 1) {
        var t = map(i, 0, nPoints, 0, 360);
        x = (a + b) * cos(radians(t)) - h * cos((radians(a + b)/ b) * t);	
        y = (a + b) * sin(radians(t)) - h * sin((radians(a + b)/ b) * t);
        vertex(x + width / 2, y + mouseY);    
        
    }
    endShape(CLOSE);
}

// draws center of middle flower
function drawCenter1(){
	fill(50);
	var centerW1 = 1
	centerW1 = map(mouseY, 0, 400, 200, 1)
	ellipse(width / 2, mouseY, centerW1, centerW1);
}

// draws middle stem
function drawStem1(){
	fill(50, 150, 50);
	stroke(20, 120, 20);
	rect(width / 2 - 5, mouseY, 10, 1000);
}

// draws left flower
function drawEpicycloid2() {
	var x;
	var y;
	var b = 3 + (mouseX / 50); // frequency of curves
	var a = map(mouseY, 0, 400, 50, 0); // diameter of path of curve
	var h = 10 // distacne from path to outer curve

	fill(220, 200, 220);
	stroke(160, 140, 160);

    beginShape();
	for (var i = 0; i < nPoints; i += 1) {
        var t = map(i, 0, nPoints, 0, 360);
        x = (a + b) * cos(radians(t)) - h * cos((radians(a+b)/ b) * t);	
        y = (a + b) * sin(radians(t)) - h * sin((radians((a+b)/b) * t));
        vertex(x + width / 4, y + mouseY + 170);    
        
    }
    endShape(CLOSE);
}


// draws left center
function drawCenter2(){
	fill(50);
	var centerW2 = 0;
	centerW2 = map(mouseY, 0, 400, 50, 1);
	ellipse(width / 4, mouseY + 170, centerW2, centerW2);
}

// draws right stem
function drawStem2(){
	fill(150, 250, 150, 150);
	stroke(100, 200, 100);
	rect(width / 4 - 5, mouseY + 170, 10, 1000);
}

// draws right flower
function drawEpicycloid3() {
	var x;
	var y;
	var b = 2 + (mouseX / 50); // frequency of curves
	var a = map(mouseY, 0, 400, 20, 0); // diameter of path of curve
	var h = 6 // distance from path to outer curve

	fill(155, 155, 250);
	stroke(130, 130, 230);

    beginShape();
	for (var i = 0; i < nPoints; i++) {
        var t = map(i, 0, nPoints, 0, 360);
        x = (a + b) * cos(radians(t)) - h * cos((radians(a + b) / b) * t);	
        y = (a + b) * sin(radians(t)) - h * sin((radians(a + b) / b) * t);
        vertex(x + width - width/4, y + mouseY + 250);         
    }
    endShape(CLOSE);
}

// draws right center
function drawCenter3(){
	fill(50);
	var centerW3 = 0;
	centerW3 = map(mouseY, 0, 400, 20, 0);
	ellipse(width - width / 4, mouseY + 250, centerW3, centerW3);
}

// draws right stem
function drawStem3(){
	fill(100, 200, 100, 200);
	stroke(80, 180, 80);
	rect(width - width / 4 - 5, mouseY + 250, 8, 1000);
}


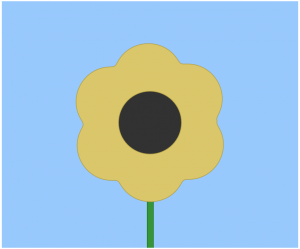
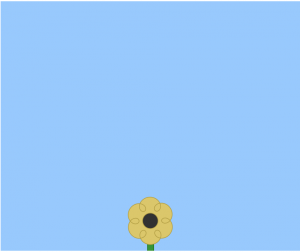
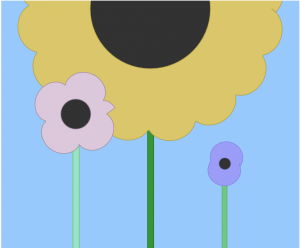
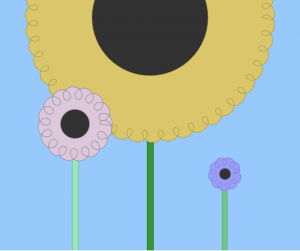
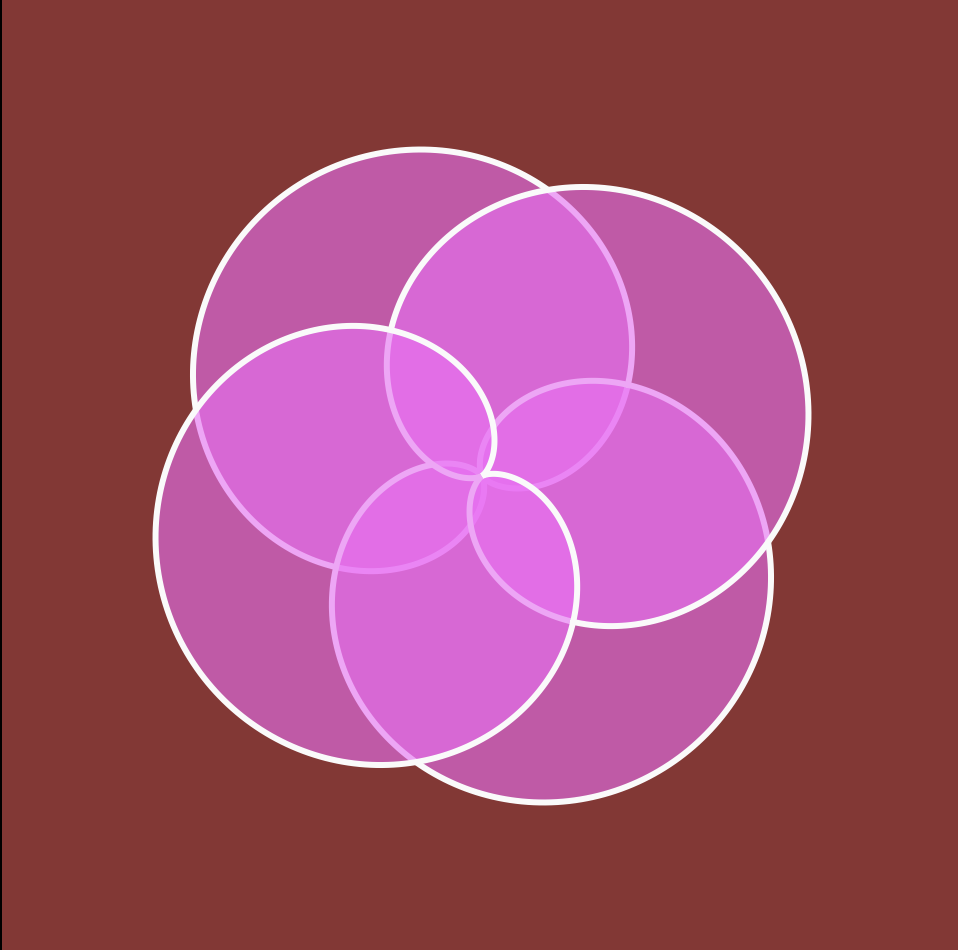
When looking at the description for this project, my mind immediately went to flowers and the different shapes of flower petals. It was pretty difficult at first to figure out how to insert the equations from the website into my code, but once I did it was fun to play around how I could then change the curves. Here are some screenshots of different x and y combinations:

Earlier iteration with only one flower

Sharon Yang Looking Outwards 07 Information Visualization

Information is often presented in a form of or with an appealing visual for the audience to be interested in the subject as well as grasping the palpable information more easily. Rachel Binx is an artist and a data scientist that has built Meshu, ManyMaps, Cliffs&Coasts, Monochōme, and Gifpop which are applications used to process data and make them into presentable visuals. A art piece by Binx that attracted my attention is Facebook Stories: Virality. She explains that it is a series of video clips that visualizes a single published content on Facebook being shared and being spread across hundreds of thousands of individuals on Facebook. She has captured the speed as well as the breadth at which the content travels to be spread across the Internet. A series of branches stem from a single person to represent the contents shared by her or him. As the branches grow, they are split to show the re-shares, sometimes creating a whole new generation of re-shares, sometimes showing a short-lived burst of activity. For the project, she worked with Zach Watson to build the WebGL framework that was used to generate the visualizations. I admire the creativity and the message that she conveys through the project, which can be perceived quite alarmingly as a content published thoughtlessly may go viral just in a second and reach unimaginably distant parts of the world.


A screenshot from Rachel Binx’s Facebook Stories: Virality

Connor McGaffin – Project 07 – Curves

sketch

/*
Connor McGaffin
Section C
cmcgaffi@andrew.cmu.edu
Project-07
*/
var nPoints = 1;
var x;
var y;

function setup() {
    createCanvas(480, 480);
}

//--------------------------
function draw() {
    background(250);
    angleMode(DEGREES);

    //top row
    push();
    rotate(1 * mouseX / 2);
    cardioids();
    pop();

    push();
    translate(width / 2, 0);
    rotate(1 * mouseX / 2);
    cardioids();
    pop();

    push();
    translate(width, 0);
    rotate(1 * mouseX / 2);
    cardioids();
    pop();

    //middle row
    push();
    translate(0, height / 2);
    rotate(1 * mouseX / 2);
    cardioids();
    pop();

    push();
    translate(width / 2, height / 2);
    rotate(1 * mouseX / 2);
    cardioids();
    pop();

    push();
    translate(width, height / 2);
    rotate(1 * mouseX / 2);
    cardioids();
    pop();

    // bottom row
    push();
    translate(0, height);
    rotate(1 * mouseX / 2);
    cardioids();
    pop();

    push();
    translate(width / 2, height);
    rotate(1 * mouseX / 2);
    cardioids();
    pop();

    push();
    translate(width, height);
    rotate(1 * mouseX / 2);
    cardioids();
    pop();


}

function cardioids(){

    var mY = constrain(mouseY, width / 4, width / 2) * .4;
    var a = mY;
    
    noStroke(0);

    //horiz axis
    //pink
    beginShape();
    fill('rgba(250, 100, 250, 0.6)');
    for(i = 0; i < 360; i++){
        var t = map(i, 0, nPoints, 0, nPoints);
        x = a * sin(t) * (1 - sin(t));
        y = a * cos(t) * (1 - sin(t));
        vertex(x, y);
    }
    endShape(CLOSE);
    //dark blue
    beginShape();
    fill('rgba(10, 100, 250, 0.6)');
    for(i = 0; i < 360; i++){
        var t = map(i, 0, nPoints, 0, nPoints);
        x = a * sin(t) * (1 - sin(t));
        y = a * cos(t) * (1 - sin(t));
        vertex(-x, -y);
    }
    endShape(CLOSE);

    //vert axis
    //rotate 90
    push();
    rotate(90);
    //light blue
    beginShape();
    fill('rgba(50, 150, 220, 0.6)');
    for(i = 0; i < 360; i++){
        var t = map(i, 0, nPoints, 0, nPoints);
        x = a * sin(t) * (1 - sin(t));
        y = a * cos(t) * (1 - sin(t));
        vertex(x, y);
    }
    endShape(CLOSE);
    //
    beginShape();
    fill('rgba(180, 10, 250, 0.6)');
    for(i = 0; i < 360; i++){
        var t = map(i, 0, nPoints, 0, nPoints);
        x = a * sin(t) * (1 - sin(t));
        y = a * cos(t) * (1 - sin(t));
        vertex(-x, -y);
    }
    endShape(CLOSE);

    //white hub
    //fill(250);
    //ellipse(0, 0, a * .6, a * .6);

    pop();
}


This project was tricky. I definitely would have struggled a lot more if I didn’t have the example code in the project brief, but once I found a curve I was drawn to and started plugging variables in for interaction, the project became a playful process.

I used s series of cardioid curves to create small pinwheel like elements, which I then organized in rows and columns on the screen. Moving the mouse up and down will scale the pinwheels, whereas moving side to side changes its direction.

I hope to revisit this code, because I know that there are ways to display it in a more compact way and achieve similar results. This is one of the few projects thus far that I feel genuinely proud of its final product.

Below are screenshots of earlier iterations, when I was still figuring out color palettes and general composition of my canvas.

Sharon Yang Project 07 Curves

Project

/*Sharon Yang
Section C
junginny
Project-07
*/

var nPoints = 100;

function setup() {
  createCanvas(480, 480);
}

function draw() {
  background(254, 200, 200);
  push();
  translate(width/2, height/2);
  rotate(PI); //rotating the shape 180 degrees
  drawHeart(); //call the function to draw the shape
  pop();
}

function drawHeart() { //function to create the heart shape
  noStroke();
  if (mouseX <= 240 & mouseY <= 240) { //the mouse X and Y determines the color of the shape
    fill(255, 0, 0); //red
  }
  else {
    fill(200, 25, 60); //burgundy
  }
  beginShape(); //create the heart shape
  for (var i = 0; i < nPoints; i++) {
    var t = map (i, 0, nPoints, 0, TWO_PI);
    var consMouseX = constrain(mouseX,0,width/2);
    var consMouseY = constrain(mouseY,0,height/2.2);//constrain to stay within the canvas border 
    x = 16 * pow(sin(t), 3);
    y = 13 * cos(t) - 5 * cos(2 * t) - 2 * cos(3 * t) - cos(4 * t); //formula for the shape
    x = map(x,0,16,0,consMouseX);
    y = map(y,0,16,0,consMouseY);
    vertex (x, y)
  }
  endShape(CLOSE);
}

This project was particularly difficult to start as a mathematical equation also had to be incorporated for the geometric shape. However, once making the shape with begin and end shape, it was quite straightforward to make the shape increase and decrease in size and make the color change with mouse X and Y. The following are the screenshots of the varying image with different mouse X and Y.

Project 07 – Sean McGadden

Project 07 Curves

This project was super interesting to make and play with. Some of the math involved with the manipulation of more complex curves eluded me a little. However, I found overlaying the Dumbbell Curve and Devil Curve to be really pleasing to spin around and mess with the sizing of them. This was a difficult assignment and I wish I could’ve para-metricized the curves more into a perspective or abstract three dimensional volumes. This project looks really flat and I think after more practice I would like to impose more perspective lines and curves that reach beyond the canvas in a more interesting composition.


The Dumbell Curves make nice looking clover shapes that have some hidden shapes behind it from the Devil’s Curve.

sketch

//Sean McGadden
//smcgadde@andrew.cmu.edu
//Project 07
//Section C

 
//Drawing Setup
function setup() {
    createCanvas(640, 400);
    
}

//Chosing to call from curveX or curveY
function draw() {
  background(160, 190, 255);
    push();
    translate(width / 2, height / 2);
    drawCurve(false, false);
    drawCurve(false, true);
    drawCurve(true, true);
    drawCurve(true, false);
    pop();    
}

//Drawing Dumbell Curve 
//basic varible defintion and instantiation of Dumbell Curve
function drawCurve(isDumbell, isFlipped) {
    
    var x;
    var y;
    var nPoints = 100;
    
    var percX = mouseX / 640.0;
    var percY = mouseY / 400.0;
    rotate(TWO_PI * percY);
    
    var a = 200.0 * percX;
    var t 
    
    stroke("lightcyan");
    fill("green");
    beginShape();
    for (var i = 0; i < nPoints; i++) {
        var t = map(i, 0, nPoints, 0, TWO_PI);
        
        x	=	curveX(isDumbell, a, t);
        y	=	curveY(isDumbell, a, t);
        
        if (isFlipped) {
            var temp = x;
            x = y;
            y = temp;
        }
        vertex(x, y);
    }
    endShape(CLOSE);
}

//Returns x value of the desired curve
//Choosing between Dumbell Curve or the Devil's Curve based on a and t
//Devil's Curves uses thrid variable called b initialized below
function curveX(isDumbell, a, t) {
    if(isDumbell){
        return a * sin ( t);
    } else {
        var b = a / 2.0;
        return cos(t) * sqrt(((a * a * sin(t) * sin(t))-(b * b * cos(t) * cos(t)))/((sin(t) * sin(t)) - (cos(t) * cos(t))));
    }
    
}
//Returns y value of the desired curve
//Choosing between Dumbell Curve or the Devil's Curve based on a and t for the 
//Devil's Curves uses thrid variable called b initialized below
function curveY(isDumbell, a, t) {
    if(isDumbell){
        return a * sin(t) * cos(t);
    } else {
        var b = a / 2.0;
        return sin(t) * sqrt(((a * a * sin(t) * sin(t))-(b * b * cos(t) * cos(t)))/((sin(t) * sin(t)) - (cos(t) * cos(t))));
    }
}


Sean McGadden

ChristineSeo – Project 07 – Curves

sketch

// Christine Seo
// Section C
// mseo1@andrew.cmu.edu
// Project-07

var leftColor;
var rightColor; 
var inBetweenColor;
var scaledVal;

function setup() {
  createCanvas(450, 450);
  rightColor = color(249, 185, 226); 
  leftColor = color(226, 213, 248); 
  inBetweenColor = color(182, 115, 138);
  scaledVal = 0; 
  strokeColor = 0;

}

function draw() {
  background(0);
  translate(width / 2, height / 2); //drawing is place to the center of canvas
  Hypotrochoid();
  angleMode(DEGREES);
}

function Hypotrochoid() {
    scaledVal = map(mouseX, 0, width, 0,1);  //color of the strokes change from left to right
    inBetweenColor = lerpColor(leftColor, rightColor, scaledVal);
    noFill();
    stroke(inBetweenColor);
     if (mouseX < (width / 1.5)) {
      stroke(strokeColor);
      strokeColor = map(mouseX, 0, width, 0, 255);
    }

    var x;
    var y;
    var x2;
    var y2;
    var c = constrain(mouseX, 50, 10, width); //constrained distance of the radius of the circles 
    var r = 175; //radius of outter circle
    var r2 = 5; //radius of inner circle 
    var b = r / constrain(mouseY, 50, height);  //constrained radius of small circles

    beginShape();
     for (var i = 0; i < r; i ++) {

     var t = map(i, 10, r, 10, 360);

     var x = (r + b) * cos(t) - c * cos (((r + b) / b) * t); //Hypotrochoid equation (outter circle)
     var y = (r + b) * sin(t) - c * sin (((r + b) / b) * t);
     var x2 = (r2 + b) * cos(t) - c * cos (((r2 + b) / b) * t); //inner circle
     var y2 = (r2 + b) * sin(t) - c * sin (((r2 + b) / b) * t);
           
     vertex(x, y); //outter circle
     vertex(x2, y2); //inner circle
        }  

    endShape();
}

For this project, I loved exploring all the variety of shapes and forms that the Hypotrochoid function could make. Although the mathematical equations seemed difficult at first, I was able to successfully make intriguing shapes that I wanted to create. I also explored to make colors of the strokes change using the mouse. I have two different sets of Hypotrchnoid in the project, that gives the overall product to have a “core” in the middle of the canvas. If you move the mouse more slowly, you are able to see that there are a lot of different shapes that can be made through your mouse. I found out that the constrain function is very useful in this project and for future projects as well. It is really interesting how it looks like the shapes are rotating consistently; I definitely want to explore more functions such as Hypotrochoid and epitrochoid.

Catherine Coyle – Looking Outwards – 07

Information visualization can make a huge difference in how viewers feel about certain data and how it comes across. For this week, I decided to do my looking outwards post on the Fitbit CES animations done by Rachel Binx. She was one of the designers that was recommended on our website and I like her work a lot.

Fitbit Animations from Rachel Binx on Vimeo.

Above is a preview of her animations for this project.

For this work, I assume that she was given heart-rate/Fitbit data to work from and made these clean looking animations to visualize it. I would assume that the algorithms behind it are basic because it is mostly displaying different charts and numbers, rather it is the art that accompanies it that makes the work admirable. She wrote the animations so that they feel very smooth and fit the ‘Fitbit’ general aesthetic which I admire a lot.

Looking Outward 07 – Sean McGadden

Looking Outward

Sean McGadden

Studio NAND – London 2012 Olympics Tweet Visualization

Studio NAND captured and visualized a few aspects of the global response to the London 2012 Olympic Games by creating an emoto. It was a two part project made up an online visualization as well as an actual installation. The instillation was created using millions of tweets concerning the Olympics to understand the widespread feeling toward any specific part of the Olympic Games such as teams, games, events, etc..

The online visualization was a real time parallel to the actual games and created visualizations throughout the events. This visualizations allowed for exploration and discovery of new events and opinions.

The Physical Instillation was an accumulation and representation of all the data and information collected throughout the games in an interactive and overlayed series of models looking at time of Tweets as well as sentiment.


Kevin Riordan Project-07-Curves

kzr project 07

/*Kevin Riordan
Section C
kzr@andrew.cmu.edu
project_07*/
function setup() {
    createCanvas(480,480);
}
//this function checks whether a point is close enough to the step value to be drawn
function latticeCloseEnough(xc, yc, c1X, c1Y, c2X, c2Y, step, bSquare) {
    //define two variables that the function will return for the if case in draw
    var smaller = false;
    var bigger = false;
    //checking four corners of the "rectangle" i have defined around the point xc, yc
    for(var x = xc - step/2; x <= xc + step/2; x += step){
        for(var y = yc - step/2; y <= yc + step/2; y += step){
            //distance used to check
            r1r2 = dist(x,y,c1X,c1Y) * dist(x,y,c2X,c2Y)
            if (r1r2 <= bSquare) smaller = true;
            else bigger = true;
        }
    }
    return smaller & bigger;
}
//this is my curve function for cassiniOvals on mathworld
function cassiniOvals(c1X, c1Y, c2X, c2Y, colorStretch) {
    //this step variable determines how defined the latticegrid is, higher numbers make it very defined but lag the program badly
    var step = 8;
    //formula for this curve is dist1 * dist 2 = b^2
    var dist1 = dist(c1X, c1Y, mouseX, mouseY);
    var dist2 = dist(c2X, c2Y, mouseX, mouseY);
    var bSquare = dist1 * dist2;
    //these drew intermediate points used to test code
    //point(c1X,c1Y);point(c2X,c2Y);
    //these variables determine how wide and how many curves are drawn around the center points for each oval function
    var range = 3;
    var scale = 0.2;
    var start = 4;
    //converts bsquare into an array
    var bSquareArray = Array.apply(null, Array(range)).map(function (_, i) {return bSquare * scale * (i + start);});
    //drawing the ovals by checking across each point on the canvas, as determined by the step variable
    for (var y = 0; y <= height; y += step) {
        for (var x = 0; x <= width; x += step) {
            for (var pos = 0; pos < bSquareArray.length; pos ++) {
                var posColor = map(pos,0,range - 1,0,255);
                //changing the color for each size of oval in each cassiniOval
                stroke((posColor + 50) * colorStretch,(posColor - 50) * colorStretch,posColor * colorStretch);
                //calling the latticechecking function to see if a point should be drawn
                if(latticeCloseEnough(x, y, c1X, c1Y, c2X, c2Y, step, bSquareArray[pos])){
                    point(x,y);
                }
            }
        }
    }
}

function draw() {
    background(0);
    strokeWeight(2.5);
    //left center coordinates
    var c1X = width / 2;
    var c1Y = height / 2;
    //started by having two variables c1x and c2x when testing one cassiniOval, but both centers ended up only depending on c1x
    //var c2X = 7*width/8;
    var c2Y = height / 2;
    var amount = 4;
    //drawing the cassiniOVals
    for (var i = 1; i <= 2; i += (1 / amount)) {
        //declaring variable to change the color for each complete cassiniOval function
        var colorStretch = map(i,0,2,0.1,1);
        cassiniOvals(c1X * i,c1Y,c1X * (2 - i),c2Y, colorStretch);
    }
}

This project was really cool to me. I used the Cassini Oval curve for this project from the MathWorld site. The main part of this project for me was creating a lattice checking function, so that the points did not get wider apart as the distances from the centers increased for larger increments. When I used a basic distance checking function, when the b-squared distance increased, the “bands” of points got thicker. I also used the .apply function I found online, which was hard for me to learn at first because I did not know about lambda expressions.  Overall, this project really forced me to learn how to reorganize my code and the structure overall.

Below is a screenshot on the right of a standard overlapping Cassini ovals when distance is short, and another screenshot on the left when the mouse is towards one side of the canvas, making the distances from the two centers larger.

Kevin Riordan Looking Outwards-07

For Looking Outwards this week, I chose to do the project This Exquisite Forest, which is a project created by Aaron Koblin and Chris Milk between 2012 and 2014.

This Exquisite Forest Introduction Video.

I admire this project because of how community driven it is. The creators made the framework, but then as shown in the pictures below, the community was in charge of all of the actual content of the ‘forest’.  The artist’s sensibilities are actually barely manifested in the final form of the project, as it is community driven for what animations are used. The actual form of the trees is controlled by the creators, however, and is very clean and minimalist. The overall structure was also created by them as well, and I admire how when you click on a leaf at the end of a tree, you can see the entire ‘story’ that it took to get there. As shown below in the first picture, each individual tree’s community creator has the option of adding as detailed of instructions as they want.

An Individual Tree’s instructions
Interface for adding to a segment of a tree.