Ankitha Vasudev – Project 06 – Abstract Clock

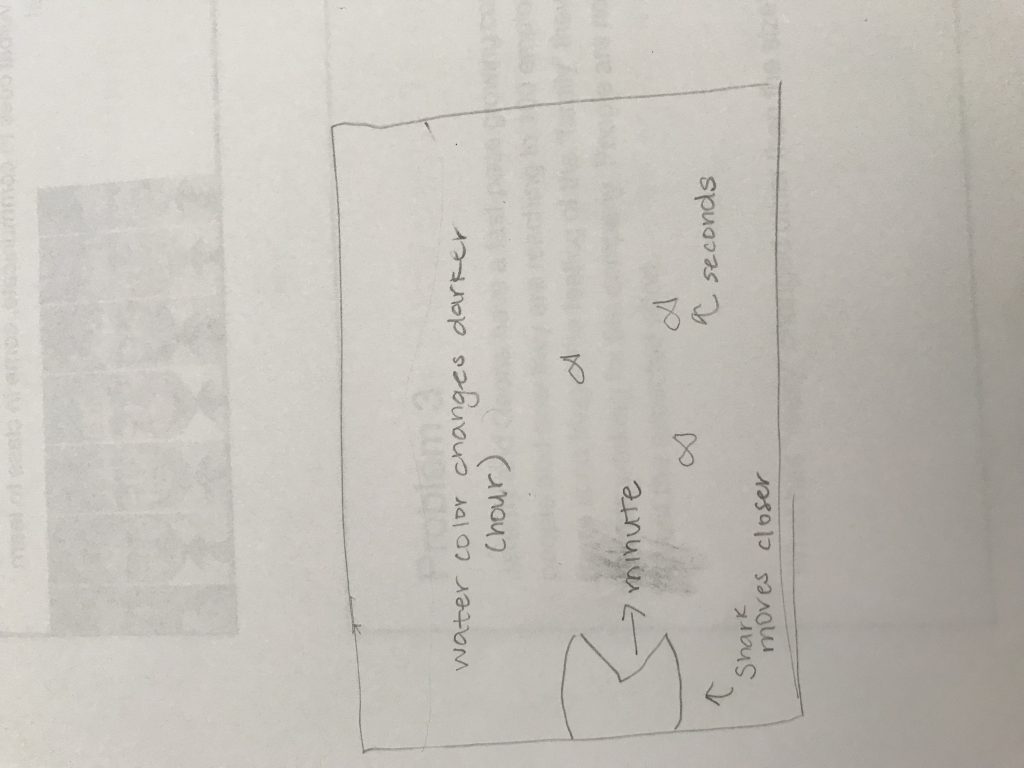
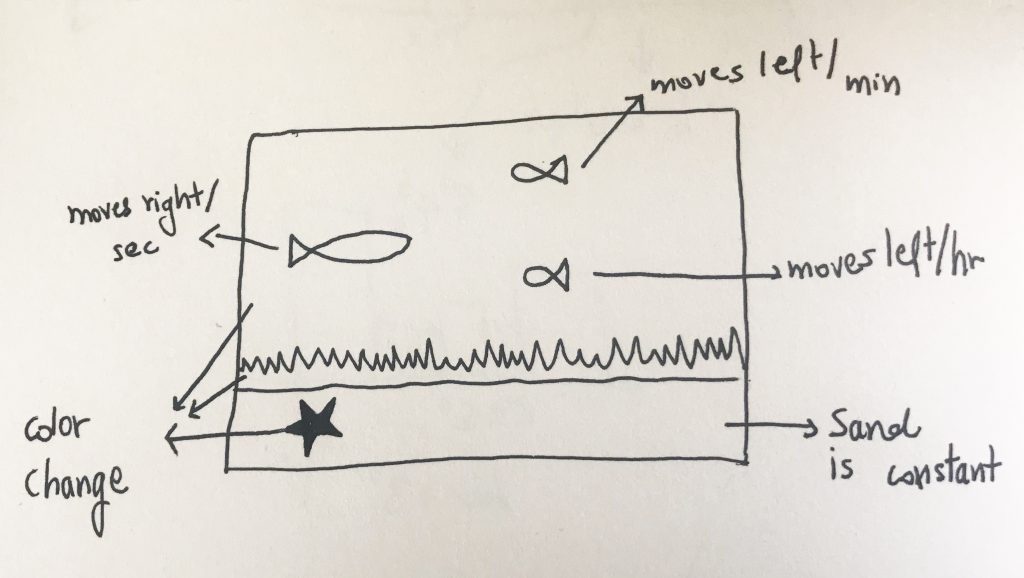
sketch

//Ankitha Vasudev
//ankithav@andrew.cmu.edu
//Section B
//Project 06

//global variables 
var r = 148; // color of background
var g = 222;
var b = 255;
var r1 = 255; // color of starfish
var g1 = 130;
var b1 = 180;
var r2 = 120; // color of seaweed
var g2 = 200;
var b2 = 100;
var fishy = 200; //y position of fish 

var x = [50, 65, 70, 62, 65, 50, 35, 39, 30, 45];
var y = [365, 372, 375, 380, 395, 385, 395, 380, 375, 370];

function setup() {
    createCanvas(400, 400); 
}

function draw() { 

    // Current Time
    var H = hour();
    var M = minute();
    var S = second();

    // Changes background color based on 8-hour periods 
     if (H >= 0 & H <= 8) {
        background(r, g, b);
    } else if (H > 8 & H < 16) {
        background(r-50, g-50, b-20);
    } else if (H >= 16 & H <= 24) {
        background(r-150, g-150, b-50);
    }

    //position of fish according to seconds
    fishx1 = map(S, 0, 59, 0, width+110);
    fishx2 = map(M, 0, 59, width-20, -40);
    fishx3 = map(H, 0, 23, width-20, -30);

    //star color changes every second 
    //becomes lightest at the end of each minute
    r1 = map(S, 0, 59, 200, 255);
    g1 = map(S, 0, 59, 50, 200);
    b1 = map(S, 0, 59, 50, 200);
    
    //changes seaweed color every minute 
    r2 = map(M, 0, 59, 150, 0);
    b2 = map(M, 0, 59, 120, 0);

    //fish moving every second
    noStroke();
    fill(236, 185, 0);
    ellipse(fishx1-55, fishy, 90, 30);
    triangle(fishx1-95, fishy, fishx1-110, fishy-20, fishx1-110, fishy+20);

    //fish moving every minute
    fill(217, 180, 123);
    ellipse(fishx2+20, fishy-100, 40, 15);
    triangle(fishx2+30, fishy-100, fishx2+40, fishy-90, fishx2+40, fishy-110);

    //fish moving every hour
    fill(111, 72, 2);
    ellipse(fishx3, fishy+100, 50, 15);
    triangle(fishx3+20, fishy+100, fishx3+30, fishy+95, fishx3+30, fishy+105);

    //seaweed
    for (i = 0; i < width+5; i += 5) {
        fill(r2, g2, b2);
        triangle(i-5, height-30, i, height-60, i+15, height-30);
    }

   //sand 
    fill(240, 210, 142);
    rect(0, height-40, width, 50);

    //starfish
    fill(r1, g1, b1);
    beginShape();
    for (var i = 0; i < 10; i++) {
        vertex(x[i], y[i]);
    endShape();
}
    //text displaying time as reference 
    fill(100);
    text("Hour: " + H, 10, 20);
    text("Minute: " + M, 10, 35);
    text("Second: " + S, 10, 50);
}

For this project I wanted to create an animation that included changing positions and colors according to the time. Each fish moves at a different pace – one every second, one every minute and one every hour. The starfish changes color every second and camouflages with the sand by the of every minute. The seaweed changes color every minute and is the greenest at the end of every hour. The color of the sea varies at 8-hour intervals to show the time of the day(morning, afternoon or evening). 
Xu Xu – Looking Outwards – 06

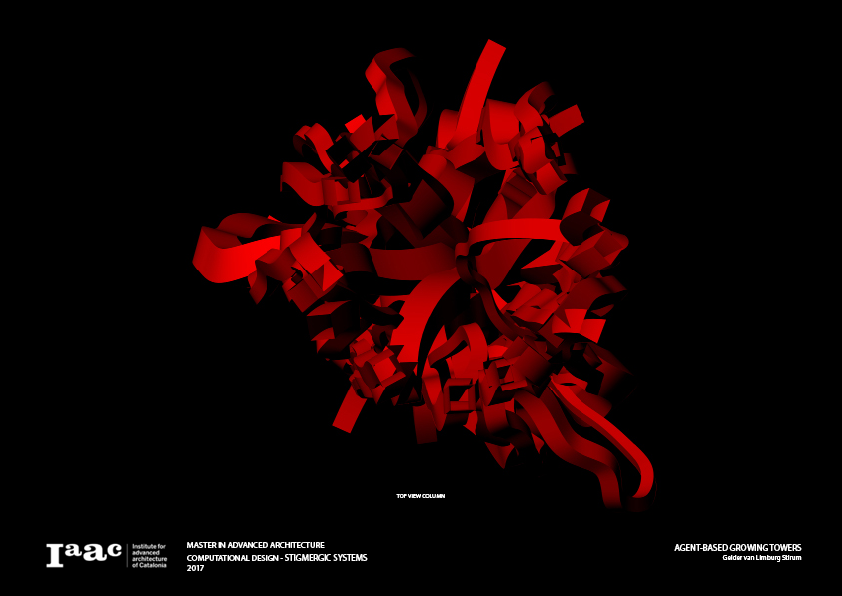
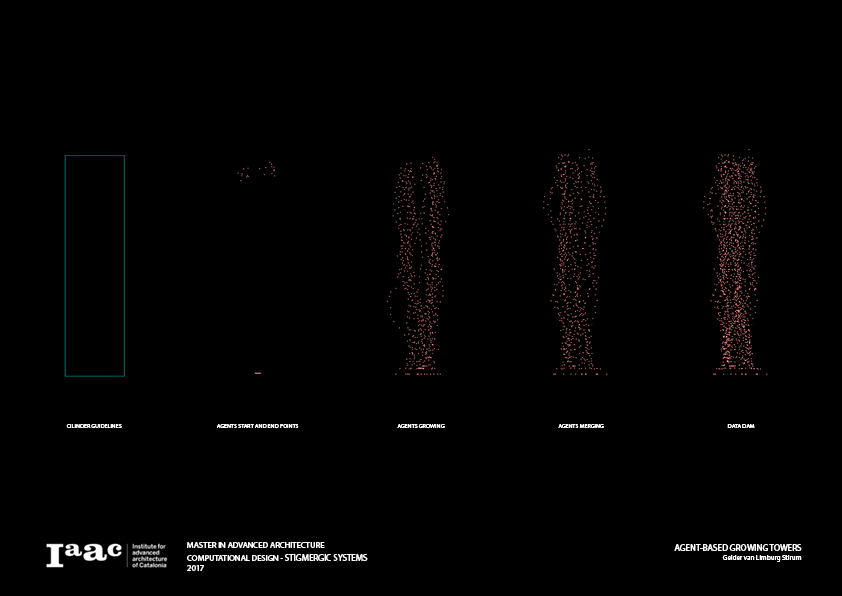
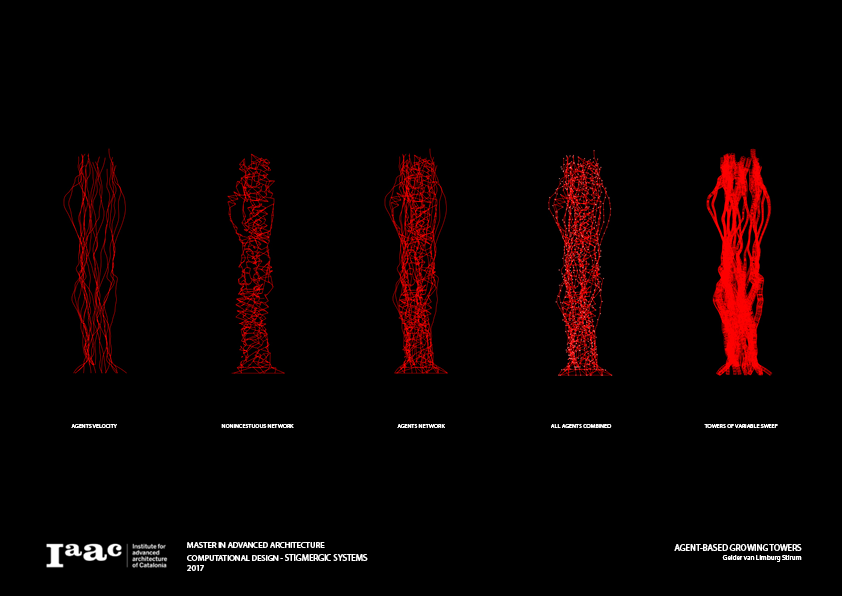
The stigmergic system is an agent-based growing tower created by Institute for advanced architecture of Catalonia. Through the use of this multi-agent-based system in a stigmergic environment, a column is created. The column starts at designated coordination points and moves to certain endpoints (or targets) following specific paths (or desired velocity). With the use of grasshopper code, the agents are guided through ‘steering’ so they move within the cylindrical shape. The Data Dam collects the agents with the network between adjacent points.

Afterwards, the velocity lines and network lines become visible, and the ‘variable-sweep’ makes the tower apparent. The combination of those towers creates the column, which happens in a bottom-up growing manner. The data inputs simply guide the agents, but the output is the randomness combined with steering and velocity. I admire the use of randomness in creating structures, which I can envision being applied to future architectural designs. Using randomness as part of our architectural creation is beginning to be introduced to the world.

A03 GVanlimburgstirum

Siwei Xie – Looking Outwards 07

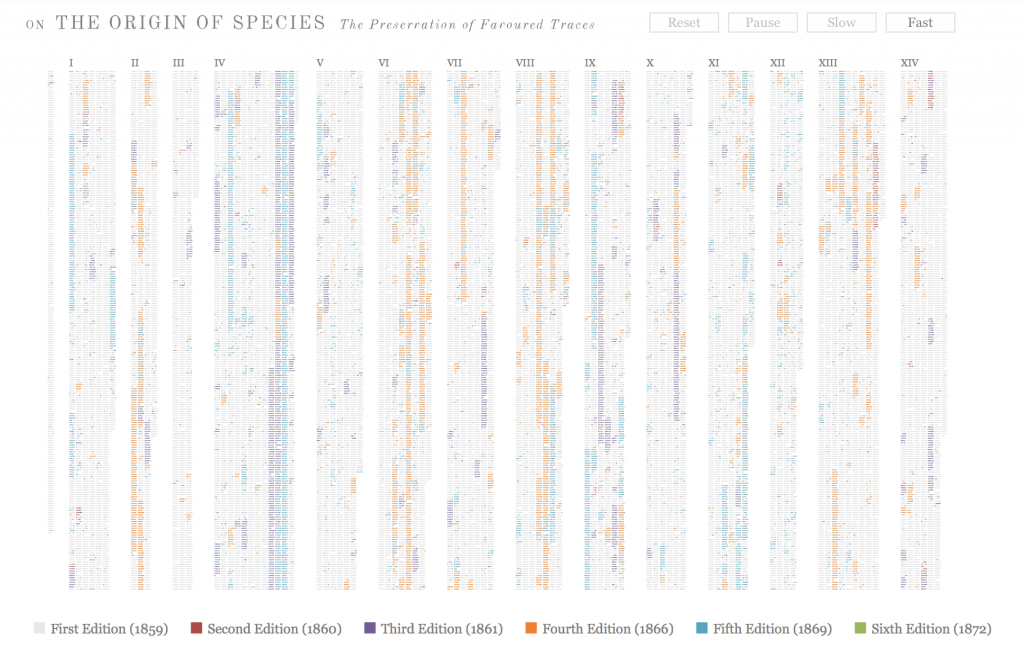
Ben Fry, Sept. 2009, Watching the evolution of the “Origin of Species”

Ben Fry created a dynamic presentation of Darwin’s multiple editions of “On the Origin of Species.” In the changes are refinements and shifts in ideas, including increasing the weight of a statement, adding details, or even a change in the idea itself. The artist uses different colors to depicts 6 different editions, and show the changes in animations. 

I admire how accessible and clear the presentation is. Darwin scholars are of course familiar with the evolution of “On the Origin of Species.” Yet the animations allow more audiences to view the changes directly, both on a macro-level as it animates, or word-by-word as they examine pieces of the text more closely. The artist might use drawing and coding software such as p5.js to draw the dots, then animate the map.

Creator’s artistic sensibility manifests by harmonize the shapes and colors of the animation. The coordinates on the layouts are simple and clear, creating soothing changes in color when the animation progresses.

Original source here.

Claire Lee – Looking Outwards – 06

I decided to write about Yale architecture student Aaron Tobey’s Randomness Project. It seems to have been for a coding-based architecture course, and essentially runs a program that draws a randomly-generated set of lines and shapes on 36 canvases. I found it really interesting because each of the 36 canvases were in the same format (same background and same color/weight of line) but seemed like they were generated with different programs. I admired that despite these variations, the entire piece is cohesive and comes together in an aesthetically pleasing way.

Random Video Project, Aaron Tobey, 2015.

Trying to think around the algorithms that might have created this piece was really interesting because unlike some of the previous works I’ve found, this was a student’s work. I still think that it goes a little beyond the scope of what I’ve learned to do so far, but the script used to create this visual piece uses a set of rules to overlap circles, triangles, and lines in a random but constrained space, with a defined frame per second rate. It starts out with a “base” piece–a set of randomly generated canvases containing shapes that don’t change– and then layers dynamic shapes on top of that. I’m not sure whether these bases are hard-coded (for aesthetic purposes?) or not, but they seem fairly random.

Xiaoyu Kang – Looking Outwards – 06

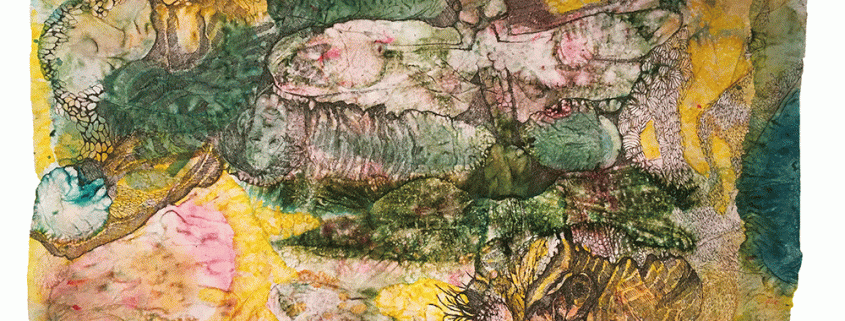
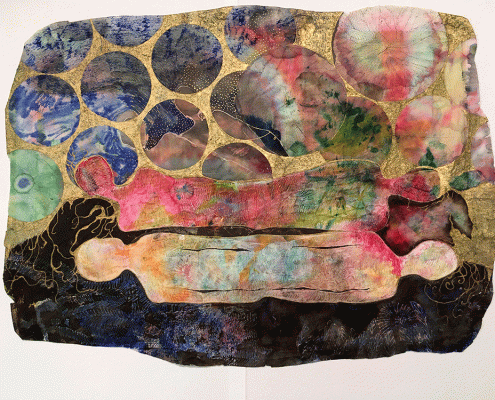
This projected is first presented at the exhibition at the Louchard Gallery in December, 2017. It consist of a series of small to medium sized drawings that are in relations to chaos and order. They all focuses on the idea of “directed randomness”. The drawings are all done on rice paper and watercolor. Gold refers are also used in reference to traditonal Inian art as a sacred art elements.

The project is started first by applying watercolor pigments randomly to the canvas. After the application, the author alters the rythem of the watercolor with an iron as a drawing tool. So as a result, the final drawing is presented with a combination of conscious and unbconscious act, which in the end creates a new form of order. The pigment application process is uncontrolled but the water drying process is controlled.

Chelsea Fan-Project 06

AbstractClock

/* Chelsea Fan
Section 1B
chelseaf@andrew.cmu.edu
Project-06
*/

var ocean = 255; //background "ocean" color
var fishx = [];
var fishy = [];


function setup() {
    createCanvas(480, 400);
    for (i = 0; i<=59; i++) { //from 0-59 seconds
    	fishx[i]= random(100, width); //random location of fish x coord
        fishy[i] = random(175, 275); //random location of fish y coord
    }
}

function draw() {
	noStroke();
    var S = second();
    var M = minute();
    var H = hour();
	//var mappedH = map(H, 0, 23, 0, width);
    
    //changing background color to darken every hour
    background(240-5.31*(H-1), ocean-5*(H-1), 255);

	for (i=0; i<S; i++) { //draw for number of seconds on clock
		fill(255, 160, 122); //orange fish color
		ellipse(fishx[i], fishy[i], 15, 5); //fish bodies
		triangle(fishx[i], fishy[i], fishx[i]-10, fishy[i]+4, fishx[i]-10, fishy[i]-4);//fish tails
	}
	//Shark moving across screen counts minutes
	//measured at inner corner of shark's mouth
    fill(160, 160, 160, 170); //gray color
	arc(20+M*(1/59*width)-30, height/2, 400, 150, QUARTER_PI, 11*PI/6); //shark head
    triangle(M*(1/59*width)-100, height/2, M*(1/59*width)-400, height/2-75, M*(1/59*width)-400, height/2+75); //shark tail
	fill(255); //white color
	ellipse(M*(1/59*width)+20, height/2-45, 20, 20); //outer eye
	fill(0); //black color
    ellipse(M*(1/59*width)+20, height/2-45, 10, 10); //inner eye

}

It took me a while to come up with a good idea for an abstract clock. My mind kept returning to ideas similar to the example bar length or a circular clock with standard hands. I had some difficulty figuring out the ratio of colors to keep the background blue (background changes based on the hour). Overall it was an interesting project. I don’t enjoy not being able to run through everything to see the colors of every hour. However, I did enjoy being able to create a “clock” or time measurer without any restrictions. I was able to create whatever I wanted in whatever shape, size, color, etc. I enjoy having that freedom.

Emma NM-LO-07

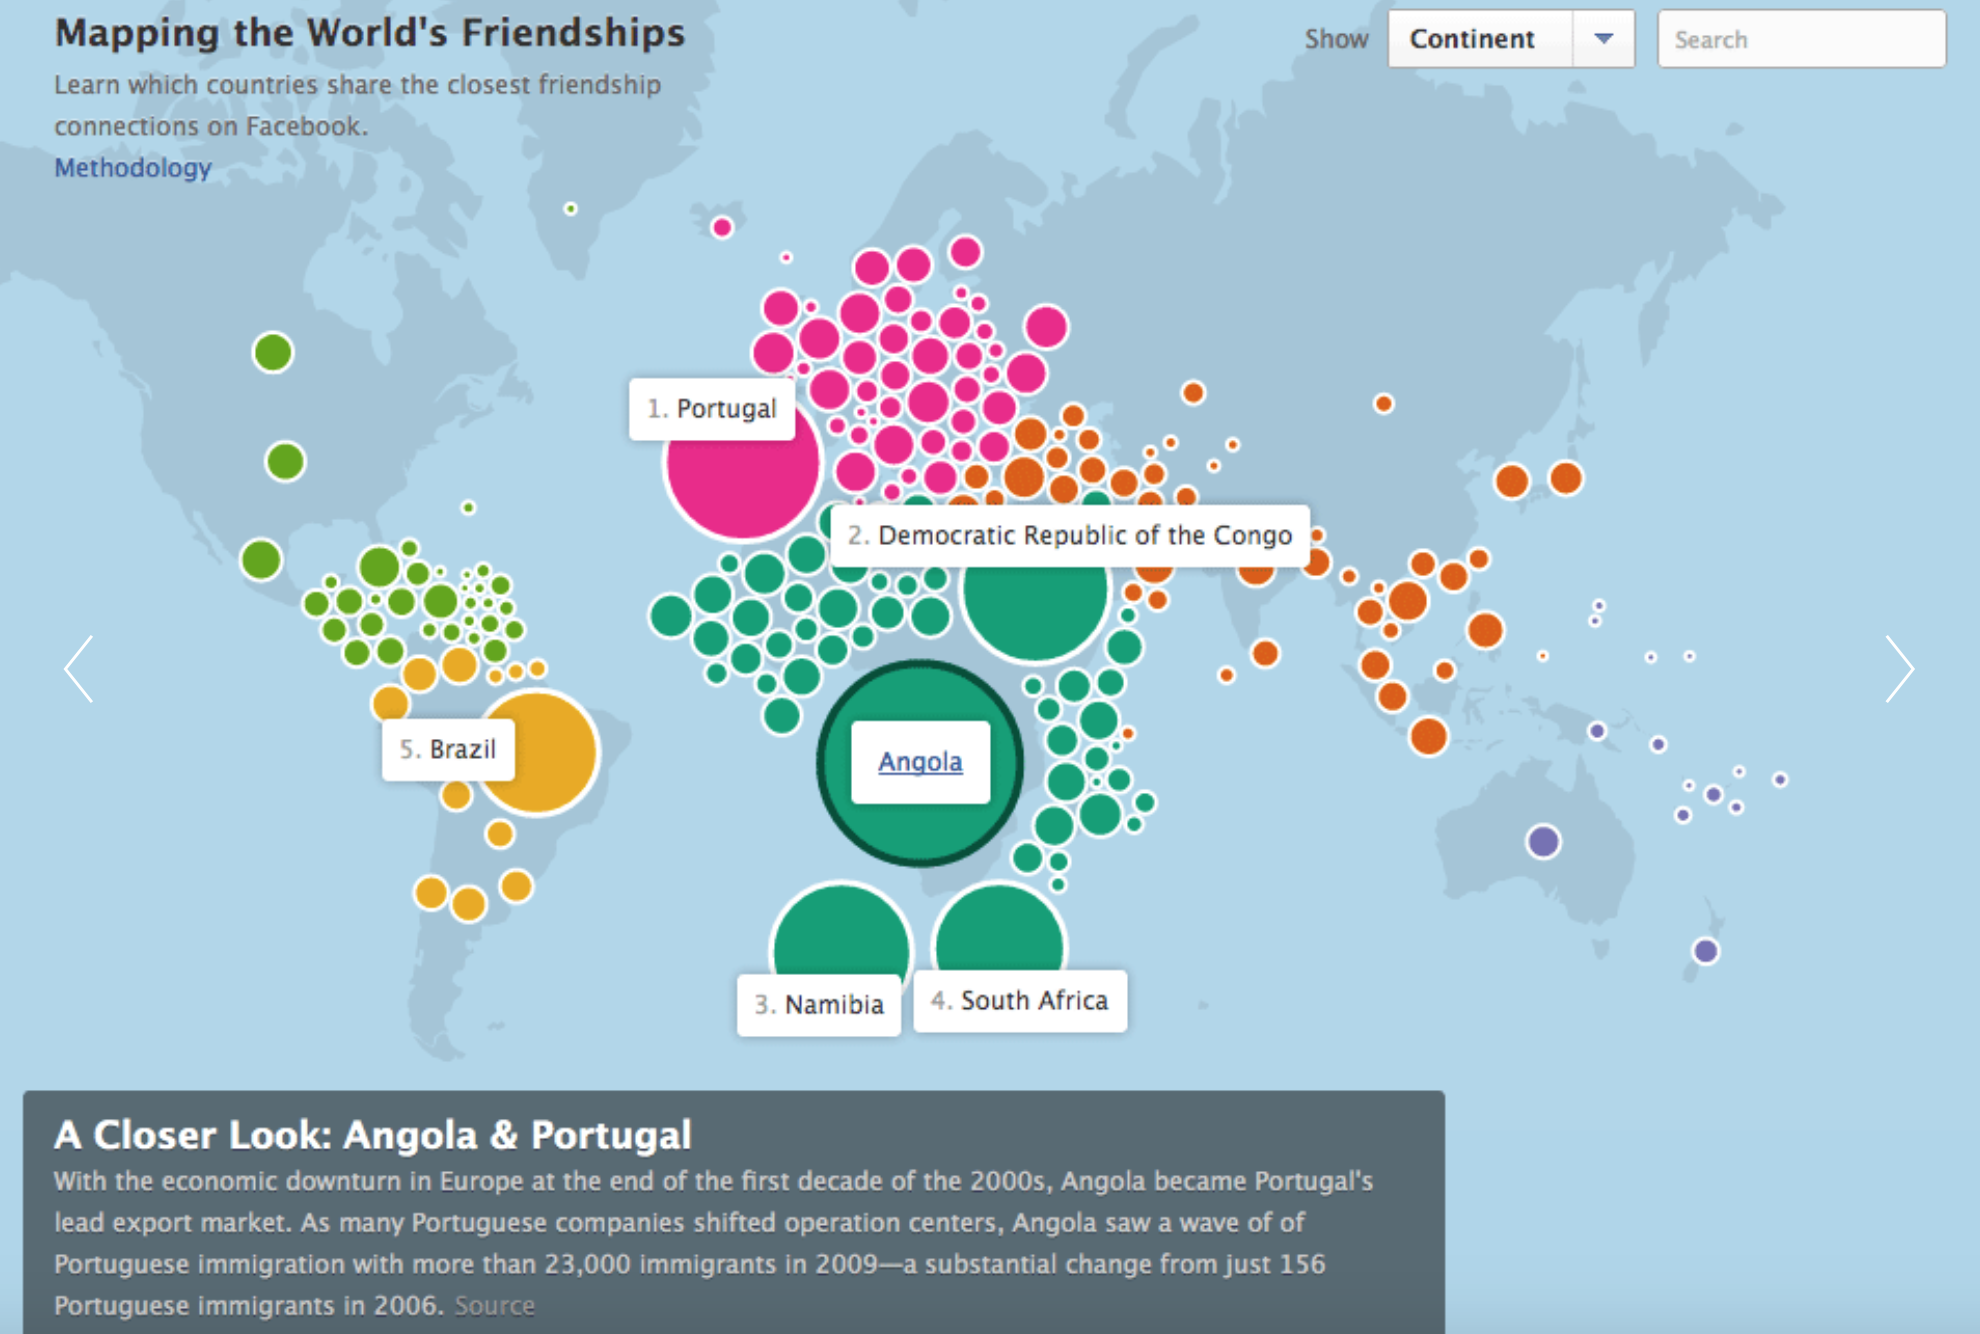
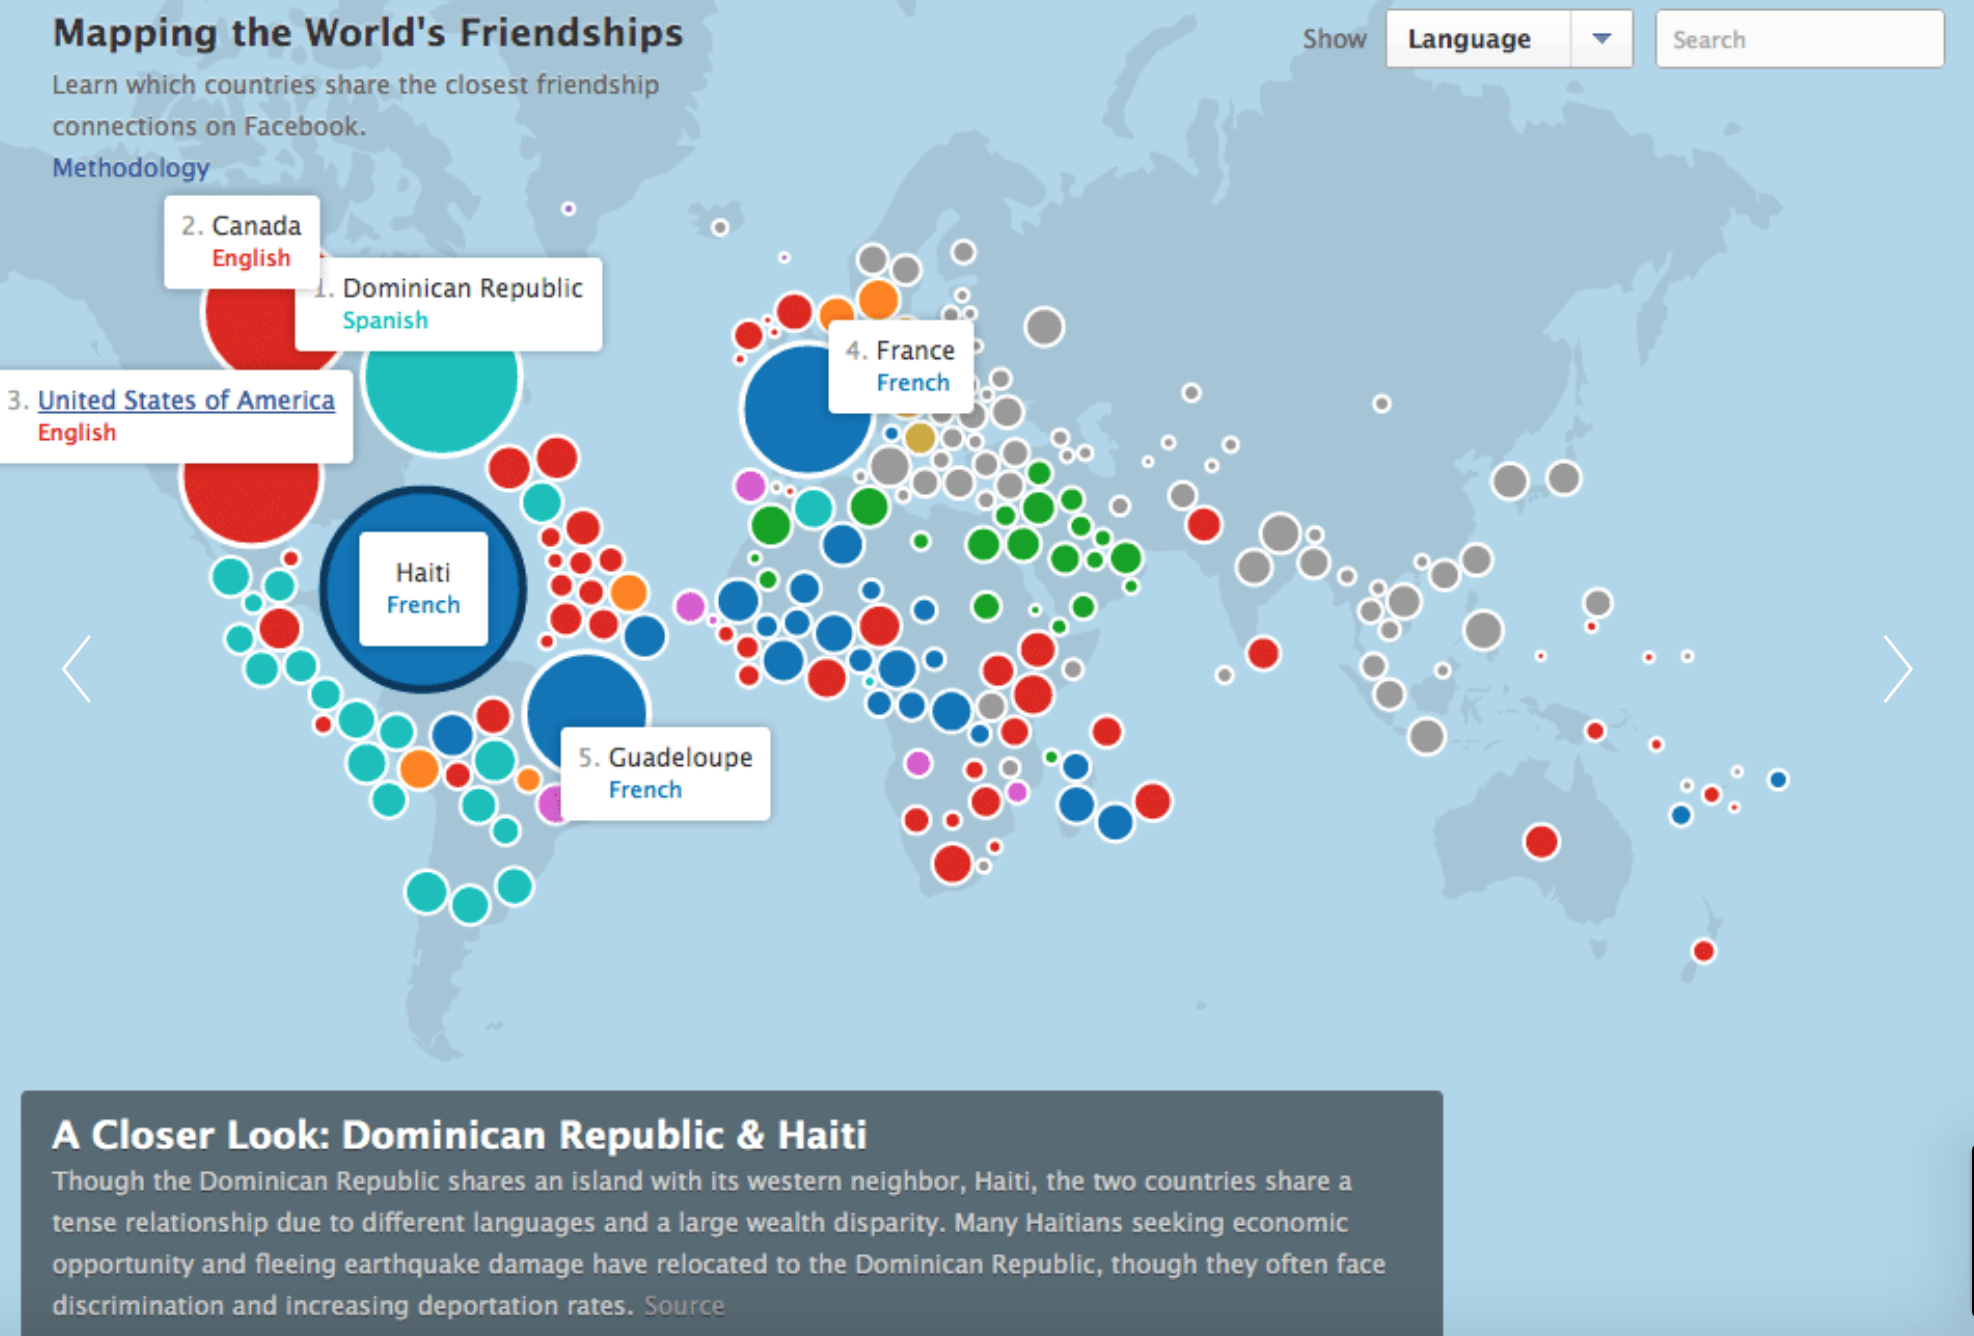
Stamen Design — Mapping the World’s Friendships

Data visualization is really interesting and cool to me. I found Stamen Design that mapped the world’s friendships through data visualization. It uses Facebook friendships the new stories feature to map interconnectedness between countries. The countries are divised by how many Facebook friendship there are between the countries, and the total number of Facebook friendships in that country. I found it interesting because you can see a bit of history through this project. You can tell where a country has been (ie. US occupied some far island in the 1980s). I think it is also really great to see us connecting outside of our country. It is important to have diverse friendships to learn about different cultures and nuances. The algorithm must map number of friendships to size and also group countries that have friendships together in the same color. The creator’s artistic sensibilities come through by how he/she chose to represent the data, specifically, the colors chosen and the use of circles to represent areas.

Emma NM-Project-06(Abstract Clock)

abstractClock

/* 
Emma Nicklas-Morris
Section B
enicklas
Project-06 (Abstract clock)
*/

var adj = 85;
var rMin = 200; // radius of min circle
var rH = 300; // radius of hour circle
var rectW = 18;
var rectH = 8;
var totMin = 60;
var hours = 12;
var mAngle = 6; // minute angle
var hAngle = 30; // hour angle
var start;
var stop;
// for color gradient
var center = 128;
var width2 = 127;
var y = - 165; // y position of rectangle


function setup() {
    createCanvas(400, 400);
     
}

function draw() {
    background("#f2f2f2");
    
    // sets the time
    var sec = nf(second(), 2);
    var min = nf(minute(), 2);
    var hourCir = hour() % hours; // accounts for a 12 hour clock, not 24 hour
    if (hourCir === 0) { // if 0, set to 12
        hourCir = numHours;
    }

    // draws the current time in the corner
    time = hourCir + ":" + min + ":" + sec; 
    textSize(20);
    fill("black");
    text(time, width - adj, adj/3);
    
    // draw hours circle
    drawHours();

    // draw minute circle
    drawMinute();
    
    // draws seconds on the outside
    drawSeconds();

}

function drawSeconds() {
    var secs = nf(second(), 2);
    var freq = .1;

    push();
    translate(width/2, height/2);
    for (var s = 0; s < 60; s ++) {
        rectMode(CENTER);

        // rotate the rectangles to make different circular patterns each second
        rotate(secs * mAngle);

        // color changes every second
        noStroke();
        red = sin(freq * secs) * width2 + center;
        b = sin(freq * secs + 2) * width2 + center;
        g = sin(freq * secs + 4) * width2 + center;
        fill(red, g, b);

        // draws rectangles
        rect(0, y, rectW, rectH);
            
    }

    pop();
}

function drawMinute() {
    // set minute value
    var mins = nf(minute(), 2);
    push();
    translate(width/2, height/2); // put in center of canvas
    noStroke();

    // // angles to get the left side of the purple wedge at 12 o'clock
    var top = 270;
    pAngle = mins / totMin; // slowly rotates circle constantly
    // smooth rotation for the minute 
    currAngle = mins * mAngle + (mAngle * pAngle);
    rotate(radians(currAngle + top));
    for (var m = 0; m < 360; m += 6) {
        var freq = .1;
        if (m === 0) { // if its the first wedge, start at 0
            start = 0;
        }
        else { // set the start position to the previous wedge's stop position 
            start = stop;
        }
        stop = start + TWO_PI * (1 / totMin); // sets the current wedge's stop position
        
        // colors based on sin wave to make rainbow
        i = m / 6;
        red = sin(freq * i) * width2 + center;
        b = sin(freq * i + 2) * width2 + center;
        g = sin(freq * i + 4) * width2 + center;
        fill(red, g, b);
        arc(0, 0, rMin, rMin, start, stop, PIE);
    }
    pop();
}

function drawHours() {
    //set the hour and minutes
    var hCir = hour() % hours;
    var mins = nf(minute(), 2);
    
    push();
    translate(width/2, height/2); // put in center of canvas
    noStroke();

    // angles to get the left side of the purple wedge at 12 o'clock
    var top = 270;
    partAngle = mins / totMin; // slowly rotates circle constantly
    // smooth rotation for the hour
    currAngle = hCir * hAngle + (hAngle * partAngle);
    rotate(radians(currAngle + top));

    // draws the 12 wedges
    for (var h = 0; h < 360; h += 30) {
        var freq2 = .2;
        if (h === 0) { // if its the first wedge, start at 0
            start2 = 0;
        }
        else { // set the start position to the previous wedge's stop position 
            start2 = stop2;
        }
        stop2 = start2 + TWO_PI * (1 / hours); // sets the current wedge's stop position
        
        // colors based on sin wave to make rainbow
        hWedge = h / 12;
        red2 = sin(freq2 * hWedge) * width2 + center;
        blue = sin(freq2 * hWedge + 2) * width2 + center;
        green = sin(freq2 * hWedge + 4) * width2 + center;
        fill(red2, green, blue);
        arc(0, 0, rH, rH, start2, stop2, PIE);
    }
    pop();
}


For this project I knew I wanted to use something with colors and have it still be readable to some degree. I came up with the idea of having the different colors being the “numbers” on the clock. For the seconds, I was thinking of doing rectangles increasing as it goes around the circle, but what I have in my final product, I think looks “cooler.” The most difficult part was trying to get the color gradient to work how I envisioned. As you play with the frequency, the colors change. Also, for the second, I struggled to get what I originally intended, but a happy accident happened and I like my final product. You can still tell the time to some degree. At 12:00:00 both circles will have the purple wedge at the top (left side exactly at top). And the 00 seconds have one single purple rectangle at the top too.

Chelsea Fan-Looking Outward-06

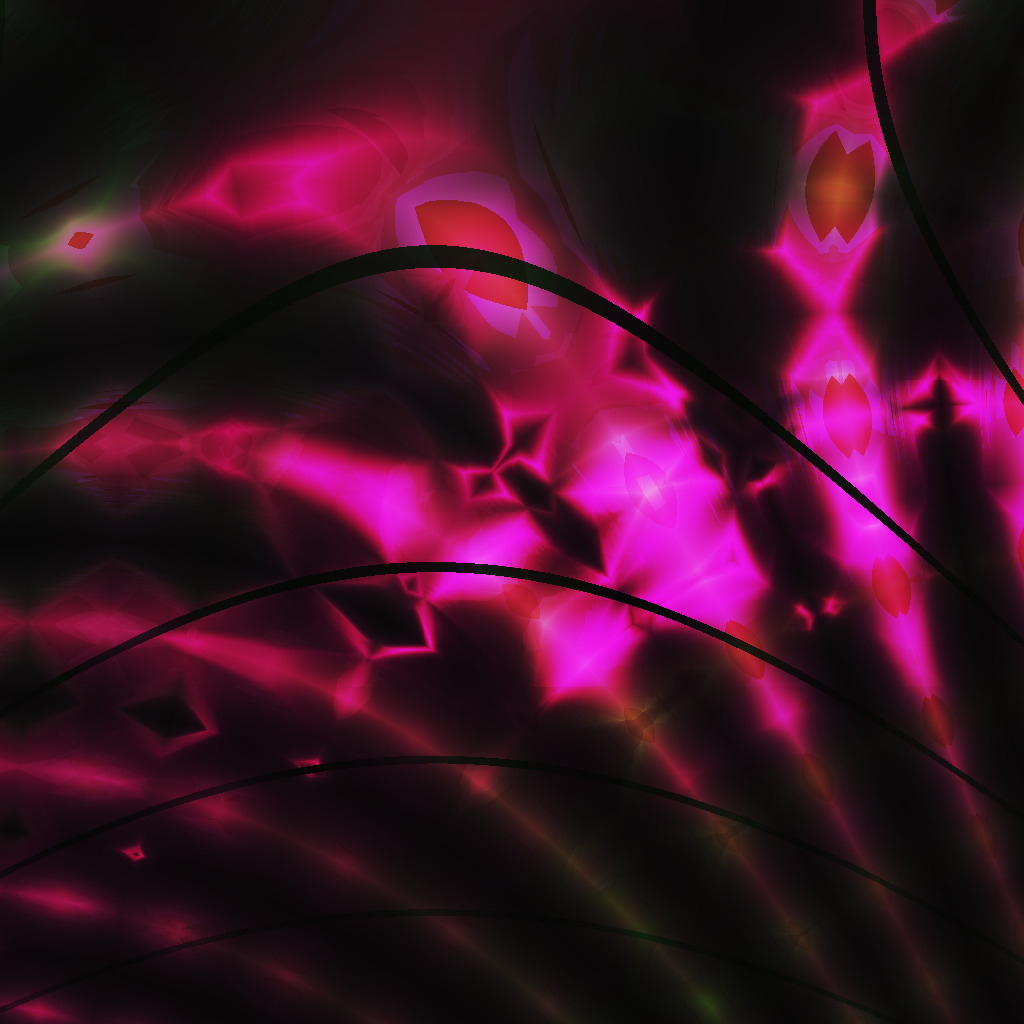
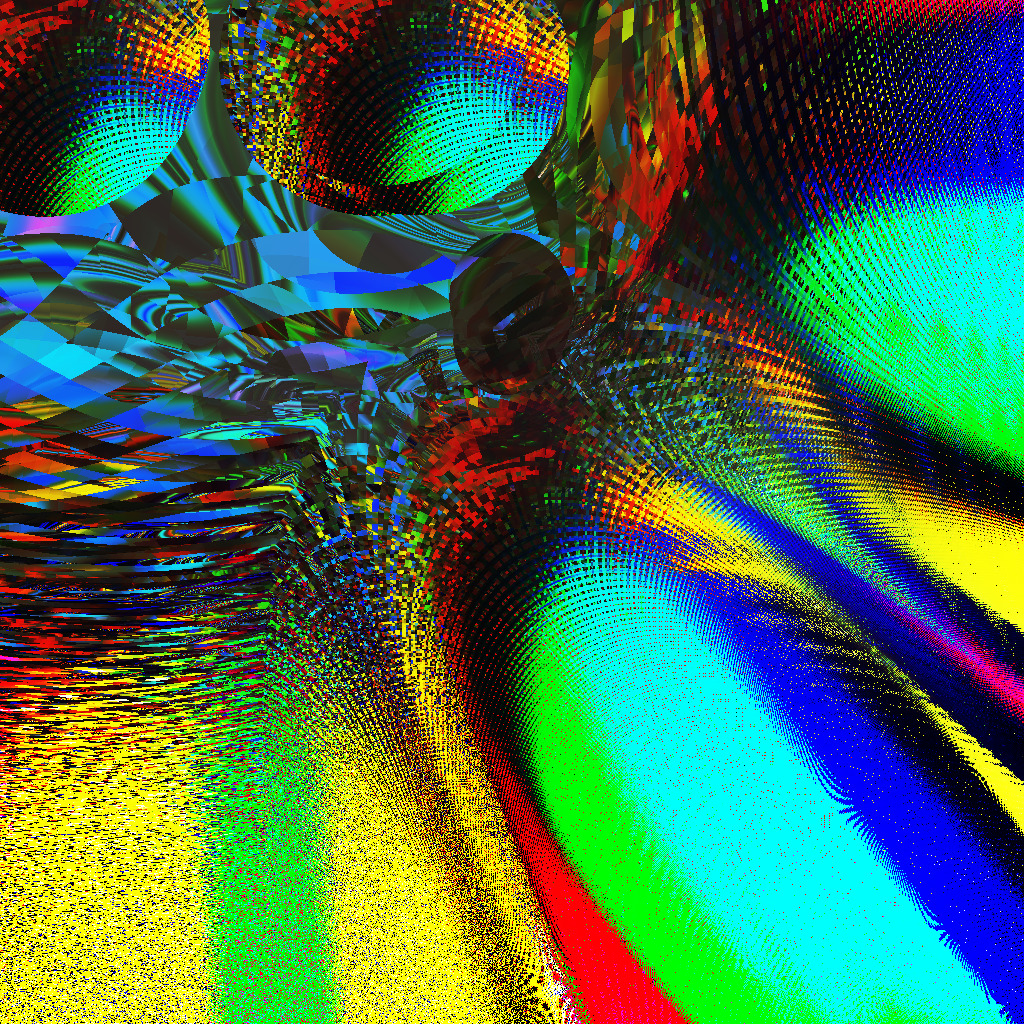
Andrej Bauer started a Random Art Project that generates expression trees that describe an image. An interesting part of his random art is the functions he uses. He does not use a generation algorithm to create his artwork.

Andrej Bauer Falcon Punch Piece (n.d.)

His website for his artwork allows viewers to rate the artwork and sort the pieces by popularity.

I admire that Bauer creates an abundance of different pieces. His artwork has a specific”style” that really represents “Andrej Bauer Art”. Because the pieces are so different and diverse, yet still similar through the style, viewers can tell a certain piece is created by Bauer. One critique I have is that his website is fairly limited and doesn’t reach a wide audience of people.

Andrej Bauer Doubledown Hoobris Piece (n.d.)

Sewon Park – LO – 06

Abstract Art drawn by the Random Number Generator designed and created by Larry Cotton (2017)

One interesting piece of art that utilized randomness is the RNG abstract art by Larry Cotton. Designing an algorithm that creates random art can be rather difficult to create. Although using random digits to dictate aspects of art such as size or color may not be too difficult using programs such as p5.js, Cotton has designed a machine that uses such algorithm to directly paint on the painting.

The machine is linked directly to the t-shaped glass panel that controls the stroke of the pen

The machine is linked directly to a computer where Cotton programs it to use random numbers to dictate color and pen stroke. In order to put some structure to the randomness, the user can dictate a certain range for the variables. As a Carnegie Mellon student, obviously I have heavy interest in engineering and other STEM subjects. As such, seeing an effective use of machinery to create abstract art was very inspiring.