//jlococo
//Jacky Lococo
var xp =0;var yp =40;var dxp =5;var bird =[];var xcir =350;var ycir =200;var angle =0;var smoke =[];var cloud =[];var tree =[];functionsetup(){createCanvas(700,400);for(var i =0; i <5; i++){ //for loop for the bird array
bird[i]=newObject();
bird[i].x = width;
bird[i].y =random(100,200);
bird[i].dx =random(-2,-4.5);
bird[i].c =color(21,76,114);}for(var i =0; i <11; i++){ //for loop for the smoke array
smoke[i]=newObject();
smoke[i].x =random(40,140);
smoke[i].y =random(0,100);
smoke[i].dx =4;
smoke[i].s =random(20,35);
smoke[i].c =150;}for(var i =0; i <9; i++){ //for loop for the clouds
cloud[i]=newObject();
cloud[i].x =random(width/2+60, width);
cloud[i].y =random(0, height/2-30);
cloud[i].dx =4;
cloud[i].s =random(70,120);
cloud[i].c =230;}for(var i =0; i <20; i++){ //for loop for the trees
tree[i]=newObject();
tree[i].x =random(width/2+60, width);
tree[i].y =random(height/2+135, height);
tree[i].s =random(70,120);}frameRate(15);}functiondraw(){background(230); //------------------ CITY ------------------
//background of city
noStroke();fill(230);beginShape();vertex(0,0);vertex(0, height);vertex(width/2-20, height);vertex(width/2+20,0);endShape(); //smokestacks
fill(200);rect(50,100,25,300);rect(100,100,25,300); //drawing the smoke
for(var i =0; i <11; i++){draw_smoke(smoke[i]);} //2nd row of buildings
fill(170);rect(50,220,100,300);rect(140,200,100,300);rect() //buildings front row
noStroke()fill(90);rect(0,200,100,420);rect(100,240,75,420);rect(175,180,45,300);rect(220,200,50,300);rect(260,300,80,200); //windows
if(mouseX < width/2){ //makes the lights turn on and off
fill(241,216,3,150);}else{fill(230); //fills them with the background when mouse is on right
}rect(220,220,10,20);rect(247,270,10,20);rect(220,340,10,20);rect(150,300,10,20);rect(110,275,10,20);rect(45,370,10,20);rect(33,230,10,20); //moving plane in the background
airPlane(xp, yp, dxp);
xp +=dxp;
//--------------- FOREST -------------------
//background of forest
noStroke();fill(185,220,236);beginShape();vertex(width/2-20, height);vertex(width/2+20,0);vertex(width,0);vertex(width, height);endShape(); //clouds
for(var i =0; i <9; i++){draw_cloud(cloud[i]);} //MOUNTAINS
fill(137,184,206); //first larger shape
beginShape();vertex(width/2+30, height);vertex(550,150);vertex(600,150);vertex(700,300);vertex(700, height);endShape(); //second shape shorter mountain
beginShape();vertex(width/2-20, height);vertex(430,240);vertex(480,240);vertex(550, height);endShape(); //circles rounding mountains
ellipse(575,161,54,54);ellipse(455,250,53,52); //HILL behind - darker shade
beginShape()fill(88,106,36);vertex(width/2-20, height);vertex(width/2-10,280);vertex(600,400)endShape() //HILL - quarter of circle
fill(127,148,68);ellipse(670, height+70,730,350); //trees
for(var i =0; i <20; i++){ //for loop for the trees
draw_tree(tree[i]);} //birds
for(var i =0; i <5; i++){draw_bird(bird[i]);if(bird[i].x < width/2){ //changing bird location after they reach midpoint
bird[i].x = width +100;}
bird[i].x += bird[i].dx; //making birds move
if(mouseX < width/2){ //making the birds stop when mouse is on city half
bird[i].dx =0}else{
bird[i].dx =random(-1,-4.5);}if(mouseIsPressed &dist(mouseX, mouseY, xcir, ycir)<30){ //making birds stop with circle pressed
bird[i].dx =0;}}
//------------------
//FOREST OPACITY FILLS
if(mouseX < width/2){noStroke();fill(0,100);beginShape();vertex(width/2-20, height);vertex(width/2+20,0);vertex(width,0);vertex(width, height);endShape();} //masking shape
fill(230);beginShape();vertex(width/2+10,80);vertex(width/2-5,230);vertex(300,230);vertex(300,80);endShape(); //OPACITY FILLS CITY AND VELOCITY STOPS
if(mouseX > width/2){noStroke();fill(0,100);beginShape();vertex(0,0);vertex(0, height);vertex(width/2-20, height);vertex(width/2+20,0);endShape();
dxp =0;}else{
dxp =5;}if(xp > width/2+30){
xp =0-50;} //Lines and circle
fill(100,150);stroke(255);strokeWeight(4);line(width/2+20,0, width/2-20,400);ellipse(xcir, ycir,60,60);noStroke();fill(255);textSize(10);text('P R E S S', xcir-23, ycir+4); //CURSOR - icons following the mouse
if(mouseX > width/2){ //mouse is flower on forest section
noStroke();flower();}else{ //mouse is three little grey smoke dots
noStroke();fill(50,100);ellipse(mouseX +9, mouseY +5,11,11);ellipse(mouseX -9, mouseY+5,11,11);ellipse(mouseX, mouseY -8,11,11);} //CIRCLE MOUSE PRESSED - if mouse is pressed on cirlce fact shows up
if(mouseIsPressed &dist(mouseX, mouseY, xcir, ycir)<30){fill(0,150);rect(0,0,700,400);
dxp =0;fill(255)textSize(15)text('Urban areas and urbanization is a major contributor of climate change,',140,100)text('making up baout 75% of CO2 emissions from global energy use.',150,130)}}
//------------ FUNCTIONS -----------
functionflower(){ //creates cursor flower
fill(233,199,10,200);ellipse(mouseX, mouseY,15,15);fill(255,154,154,200);ellipse(mouseX+10, mouseY,8,8);ellipse(mouseX-10, mouseY,8,8);ellipse(mouseX, mouseY-10,8,8);ellipse(mouseX, mouseY+10,8,8);ellipse(mouseX+7, mouseY+7,8,8);ellipse(mouseX-7, mouseY-7,8,8);ellipse(mouseX-7, mouseY+7,8,8);ellipse(mouseX+7, mouseY-7,8,8);}functionairPlane(xp, yp, dxp){ //creates airplane moving in the background
fill(200);rect(xp, yp,40,10);ellipse(xp+40, yp+5,15,10);ellipse(xp, yp,5,20);fill(175);ellipse(xp+15, yp+7,23,5);strokeWeight(2);stroke(220,180);line(xp, yp+10, xp-150, yp+10);}functiondraw_tree(t){fill(0);rect(t.x, t.y,5,10);fill(63,111,85);triangle(t.x +2, t.y-10, t.x -5, t.y+5, t.x+10, t.y+5);}functiondraw_bird(b){fill(b.c);ellipse(b.x, b.y,10,10);fill(214,216,3);ellipse(b.x -6, b.y,4,4);fill(13,39,56);ellipse(b.x +4, b.y,7,5);}functiondraw_smoke(s){fill(s.c,160);circle(s.x, s.y, s.s);}functiondraw_cloud(c){fill(c.c,150);circle(c.x, c.y, c.s);}
``
//Jacky Lococo
//jlococo
//Section C
var photoFace; //stores the image
var size =10 //stores size of the images
functionpreload(){
photoFace =loadImage('https://i.imgur.com/vdN43xy.png?1');}functionsetup(){createCanvas(345,400);imageMode(CENTER);noStroke();
photoFace.loadPixels();}functiondraw(){background(255);drawPixleate();fill(0);textSize(15)text('P R E S S', mouseX, mouseY); // writes press
size =map(mouseX,0, width,10,50); // will map the size of the
if(size ==0) size =1;}functiondrawPixleate(){for(var y =5; y < height +50; y += size){for(var x =5; x < width +50; x += size){print(photoFace.width);var pix = photoFace.get(x, y); //extracts color from the image
fill(pix);if(mouseIsPressed){ellipse(x, y, size, size); //ellipse instead of rectangles when mouse is pressed
}else{rect(x, y, size, size);//rectangled when mouse is not pressed
}}}}
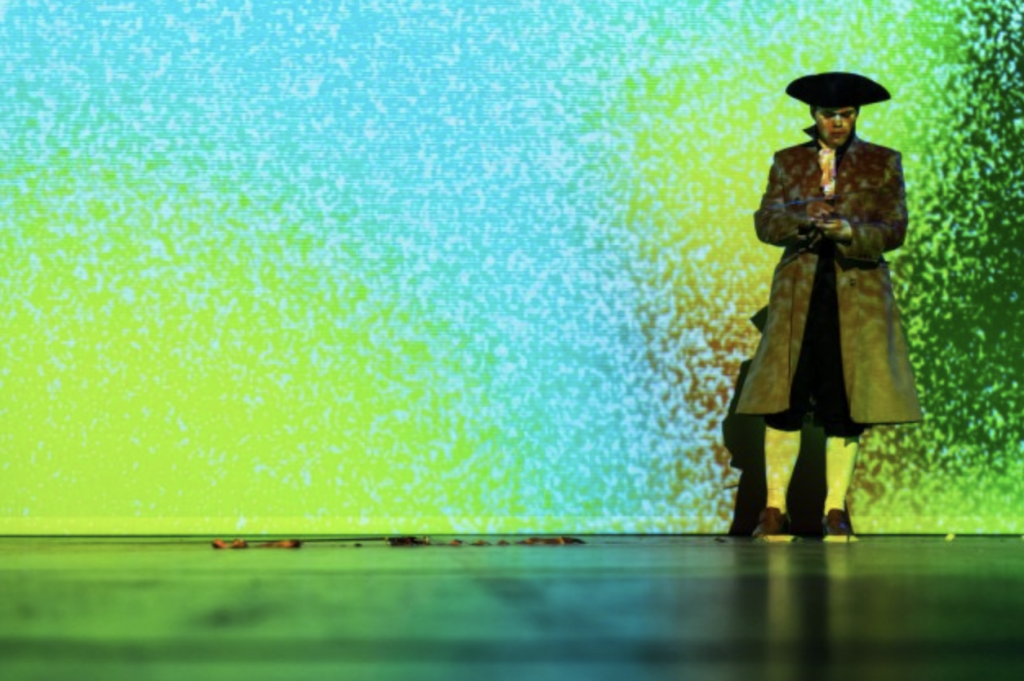
One female artist that I find inspiring is Eva Schindling. She got a MSc. in art and technology from Chalmers University in Sweden. She “creates hardware and software solutions in the interdisciplinary zone between art, science, technology and design.” Her work has been exhibited all over the world including the Japan Media Arts festival, Hong Kong’s Museum of Art, Moscow’s Biennale of Contemporary Art, and even Burning Man! A project that I find very interesting from her portfolio is La Figure de la Terre. This was a work for the contemporary Finish Opera La Figure de la Terr and it is an Audio-reactive video software. There is not that much explaining the piece, but from the images it seems like this was used as a background to the opera itself. I think it is always exciting to see different applications of computer generated art, and this marriage between theater and computer generated art is especially inspiring!
Link: http://www.evsc.net/projects/la-figure-de-la-terre Artist: Eva Schindling
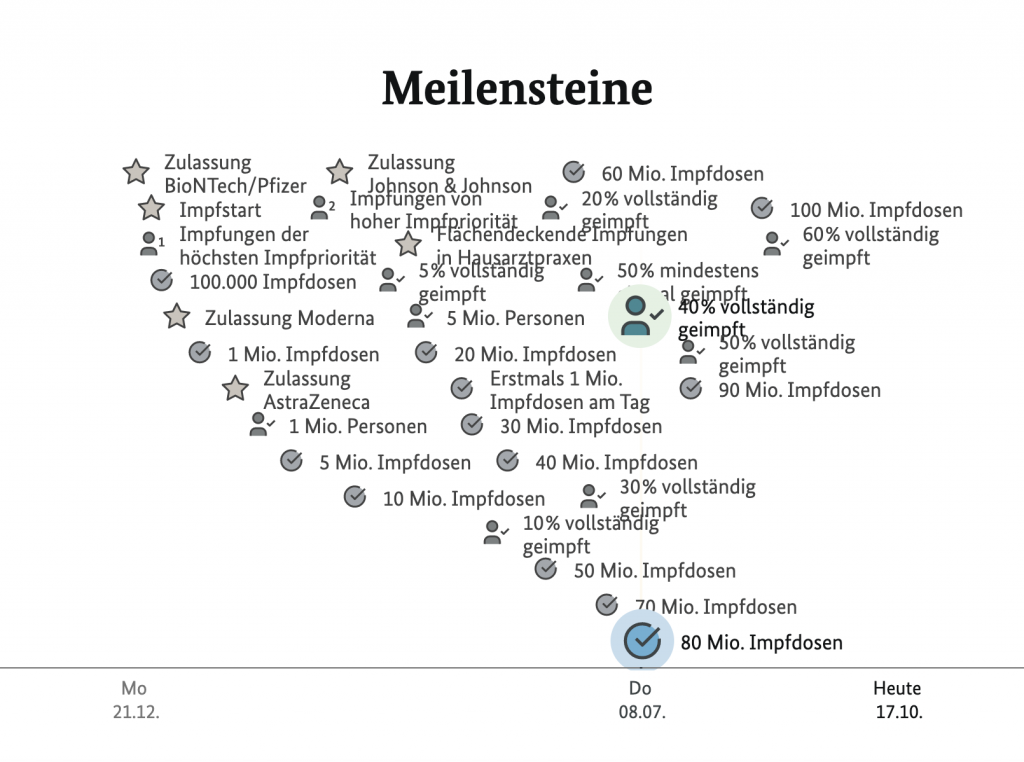
Link: https://impfdashboard.de/ Project: Visualizing the vaccination progress in Germany Creators: Nand.io
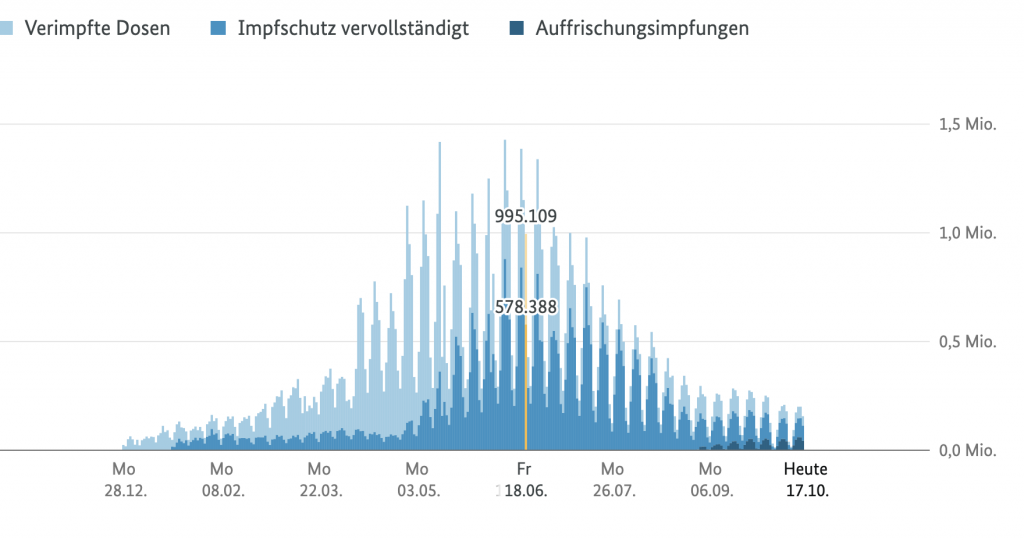
The project that I found interesting was one from Nand.io which visualizes vaccination progress in Germany. On the web page that they made, there are a plethora of interactive maps that the user is able to hover over and see the progression of vaccination rates. A part that I found extremely interesting was their tracking of different milestones within the pandemic (see below). The user is able to see a timeline with different milestones all piled on top of each other. They can then hover over different sections and see more information about them and when they took place. This is something I’ve never seen before in tracking covid cases or vaccinations which I think is really interesting to visualize. What I admire most about this project is that it is using data visualization for a very important purpose. I think especially now, being able to make progress tangible and visual can help people move forward and be hopeful for change.
//Jacky Lococo
//jlococo
//Section C
var nPoints =50; // points on the epispiral and ranunculoid
functionsetup(){createCanvas(480,480);}functiondraw(){background(255);push()translate(width/2, height/2)rotate(mouseX/2, mouseY/2)epispiralOne() //espiral - will repeat this shape to make more spiral lines
epispiralOne()rotate(mouseX/4, mouseY/2)epispiralOne()ranunculoid() //flower curve -- will repeat to create spirals
rotate(mouseX, mouseY)scale(2.0)ranunculoid() //flower curve scaled by factor of 2
ranunculoid()scale(0.5)ranunculoid()pop()push()scale(2.0) //scaled up flower in top left corner
ranunculoid()pop()ranunculoid() // flower in top left corner
push()translate(width, height)ranunculoid()// flower in bottom right corner
scale(2.0)//scaled up flower in right corner
ranunculoid()pop()ellipse(width/2, height/2, mouseY/30, mouseY/30) //creates scaling ellipse
}functionepispiralOne(){ //episprial with two curves
var a =40var b = a /2.0;var h = mouseX
var ph = mouseX /50.0noFill()strokeWeight(2)stroke(0,100, mouseY)beginShape();for(var i =0; i < nPoints; i++){var t =map(i,0, nPoints,0, TWO_PI);
x =(a + b)*cos(t)- h *cos(ph + t *(a + b)/ b); //formulas
y =(a + b)*sin(t)- h *sin(ph + t *(a + b)/ b);vertex(x,y)}endShape()}functionranunculoid(){ // type of Epicycloid with four petals
var a = mouseY /30 // changes the size of the shape
noFill()stroke(mouseX,0,100) // changes just the red value
strokeWeight(1)beginShape();for(var i =0; i < nPoints; i++){var t =map(i,0, nPoints,0, TWO_PI);
x = a*(6*cos(t)-cos(6*t)); //formulas
y = a*(6*sin(t)-sin(6*t));vertex(x,y)}endShape()}
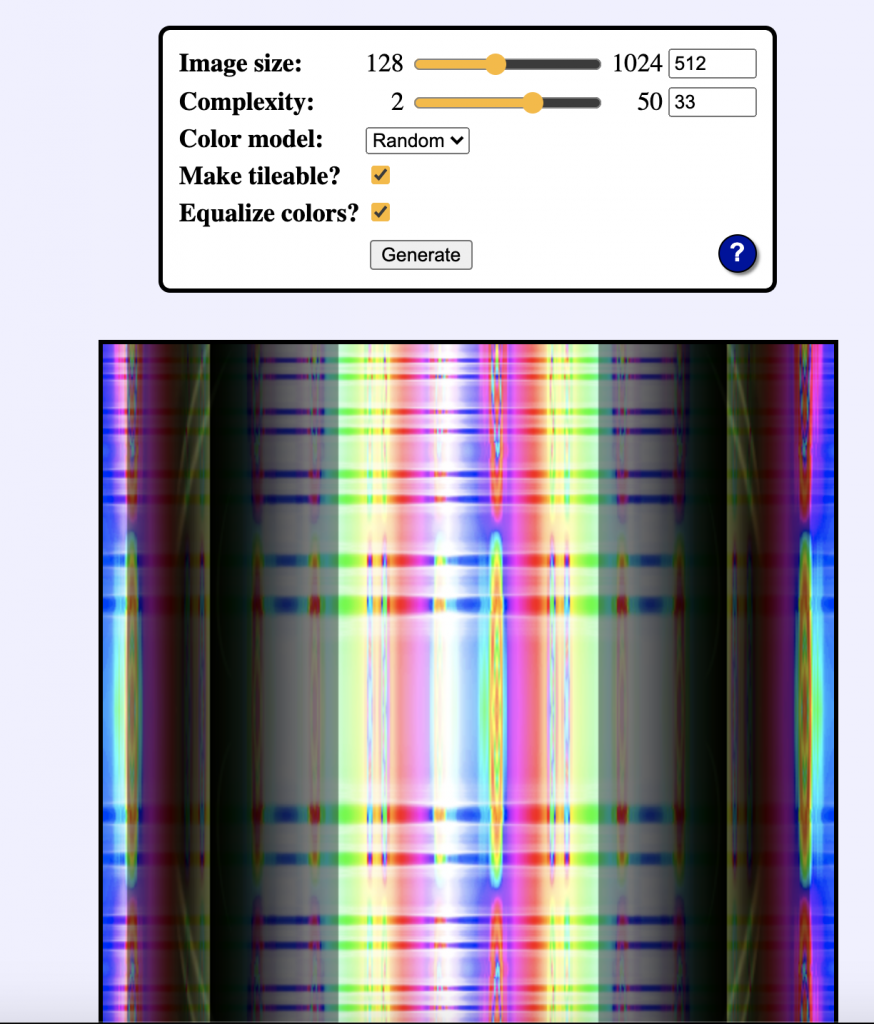
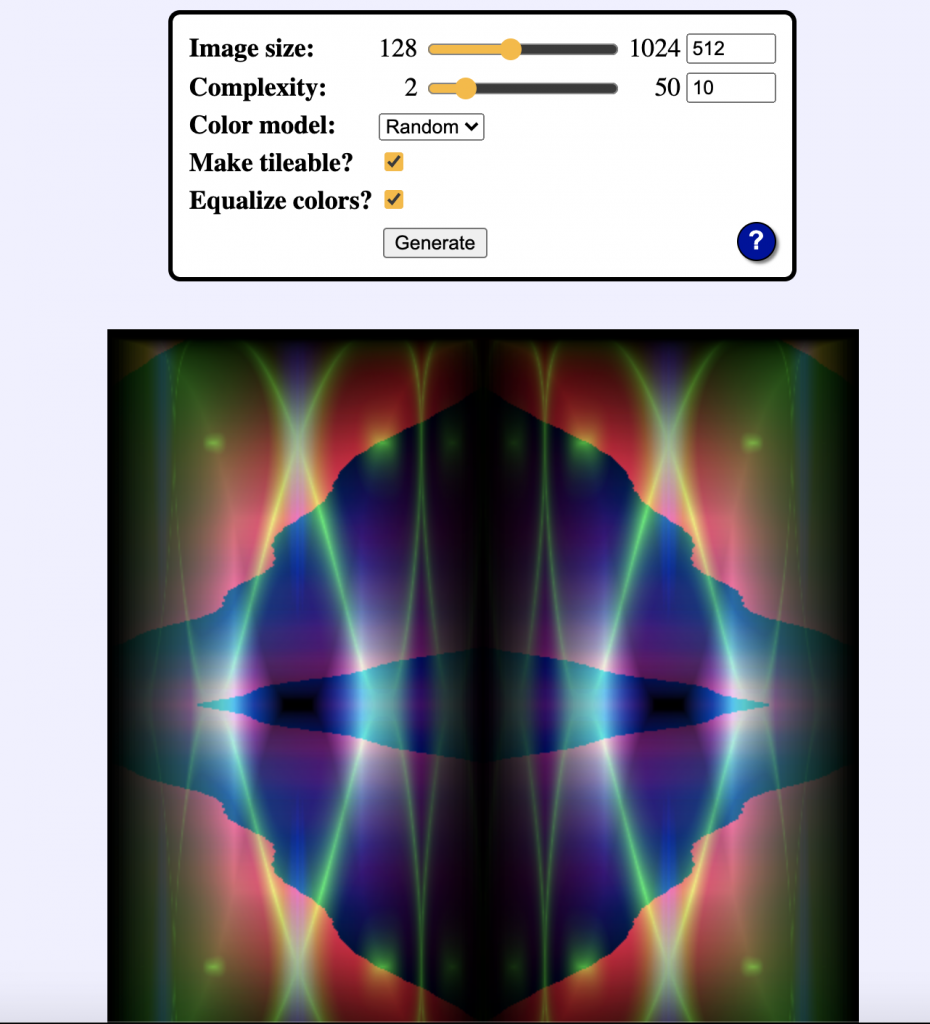
While looking for examples of random art on google, something that came up was “Scott Pakin’s Random Art Generator.” In this webpage, the user is able to toggle a few settings in order to create a randomly generated image. They have the ability to adjust the canvas size, the complexity, the color model, and whether they equalize color or not. By adjusting these, the computer then generates a unique image of random color, lines, and shapes. The outcome of the graphics mostly stick to being a similar style, as seen below, but they do change with the inputs you give them. I admire that the engineer of this website is able to create an algorithm that can produce these unique images. I think the algorithm they use is similar to the one that we use in class where colors are generated within a specific random set and so are graphics/canvas size.
I found this project a little challenging, but I do like what I was able to make in the end! There were elements that I was really hoping to add, like an inverted color for the background and lines between the morning and afternoon, but my hours function was not working so I wasn’t able to include that aspect. But I mainly wanted to create a clock that created a full picture with the end of a day. The circles on the right count the minutes and sections and the lines on the right create a grid that has lines added each hour.
//Jacky Lococo
//jlococo
//Section C
functionsetup(){createCanvas(370,600);}functiondraw(){background(0);var sec =second() // variable ofr the seconds
var min =minute() // variable for minutes
var h =hour()var strokeLine =255 // varible for stroke (ended up not working)
//white lines that divide seconds, minutes, hours
strokeWeight(1)stroke(strokeLine)line(330,0,330,600)strokeWeight(1)stroke(strokeLine)line(290,0,290,600) //y value for the seconds cirlces
for(var y =10; y <=10*(sec); y +=10){strokeWeight(0)fill(255,204,204)ellipse(350, y,10,10);} //y value for the minutes since x is the same for each added cirlce
for(var ym =10; ym <=10*(min); ym +=10){strokeWeight(0)fill(255,102,102)ellipse(310, ym,10,10)} //hour-horizontal and verticle lines will be drawn with each hour to create a grid
//y value change for the hours - horizontal visualization
for(var yh =25; yh <=25*(h); yh +=25){strokeWeight(1)stroke(strokeLine)line(0, yh,290, yh)} //x valye for the change in hour - verticle depiction
for(var xh =290/24; xh <=(290/24)*(h); xh +=290/24){strokeWeight(1)stroke(strokeLine)line(xh,0, xh,600)} //red cirlces that follow the hour lines
strokeWeight(0)fill(255,51,51)ellipse(275, yh -25,10,10)strokeWeight(0)fill(255,51,51)ellipse(xh-290/24,580,10,10)}
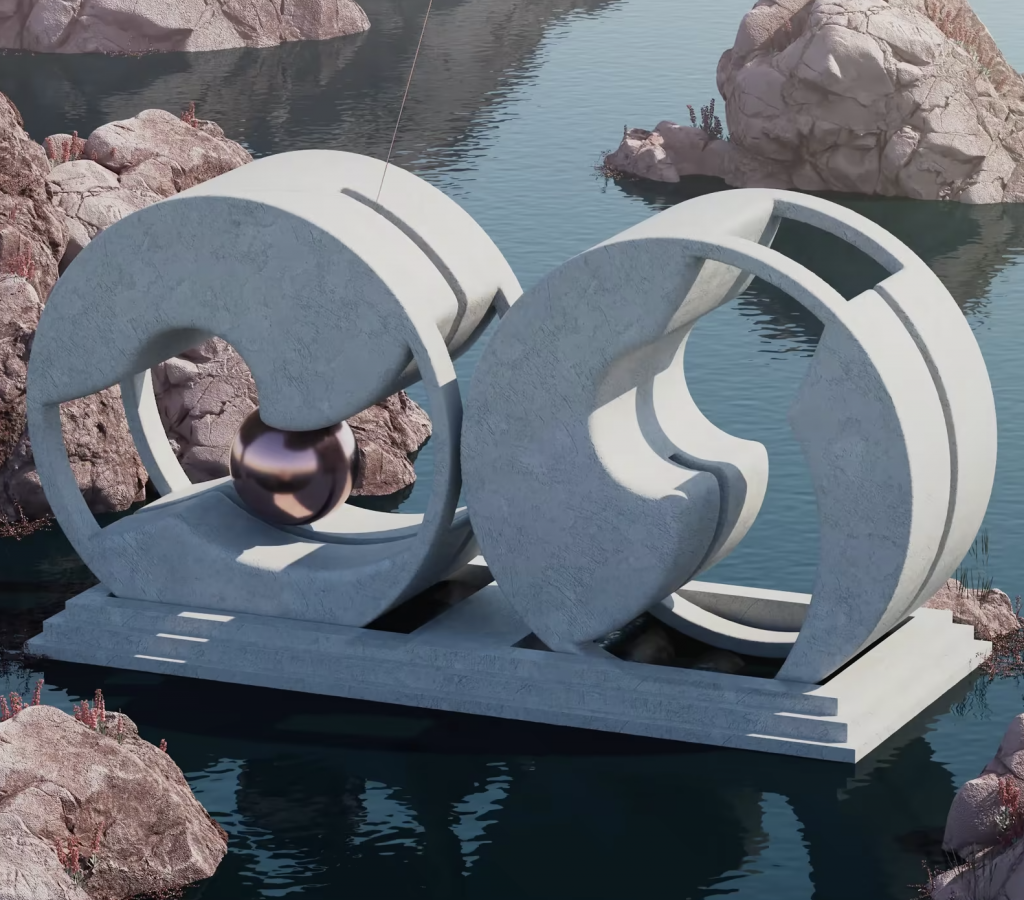
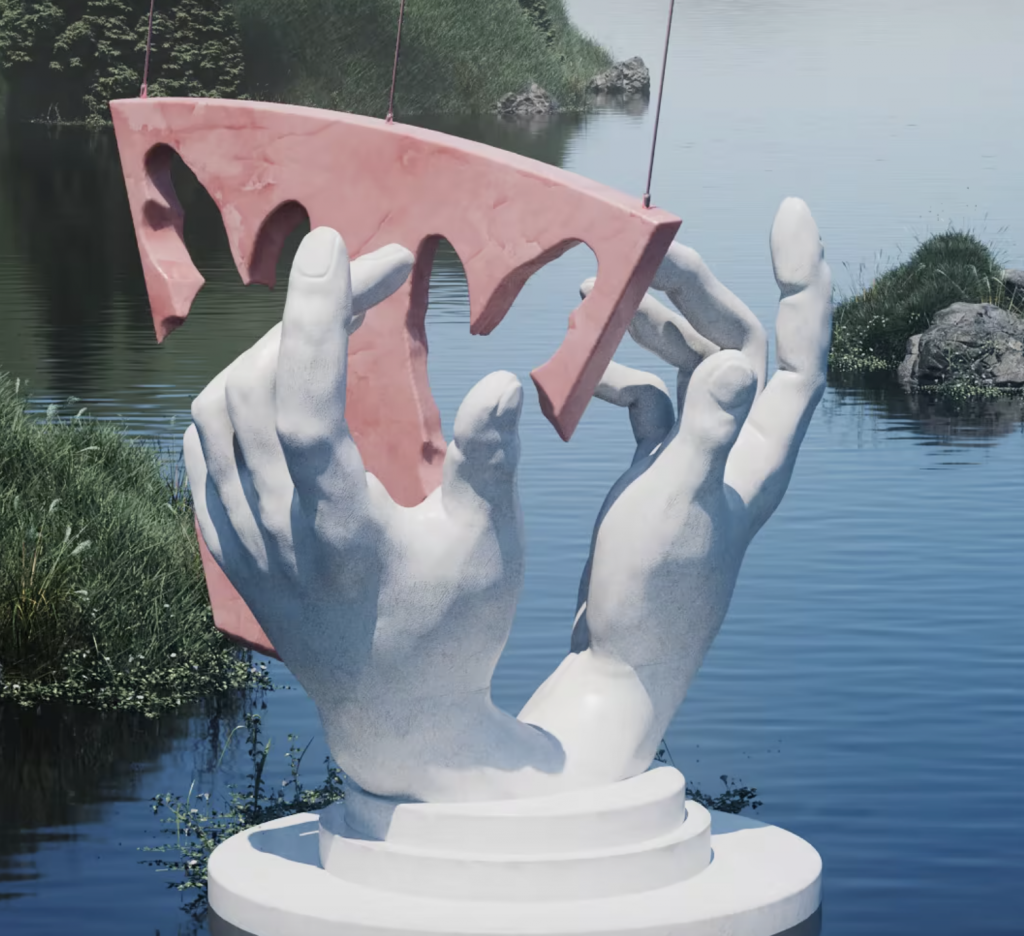
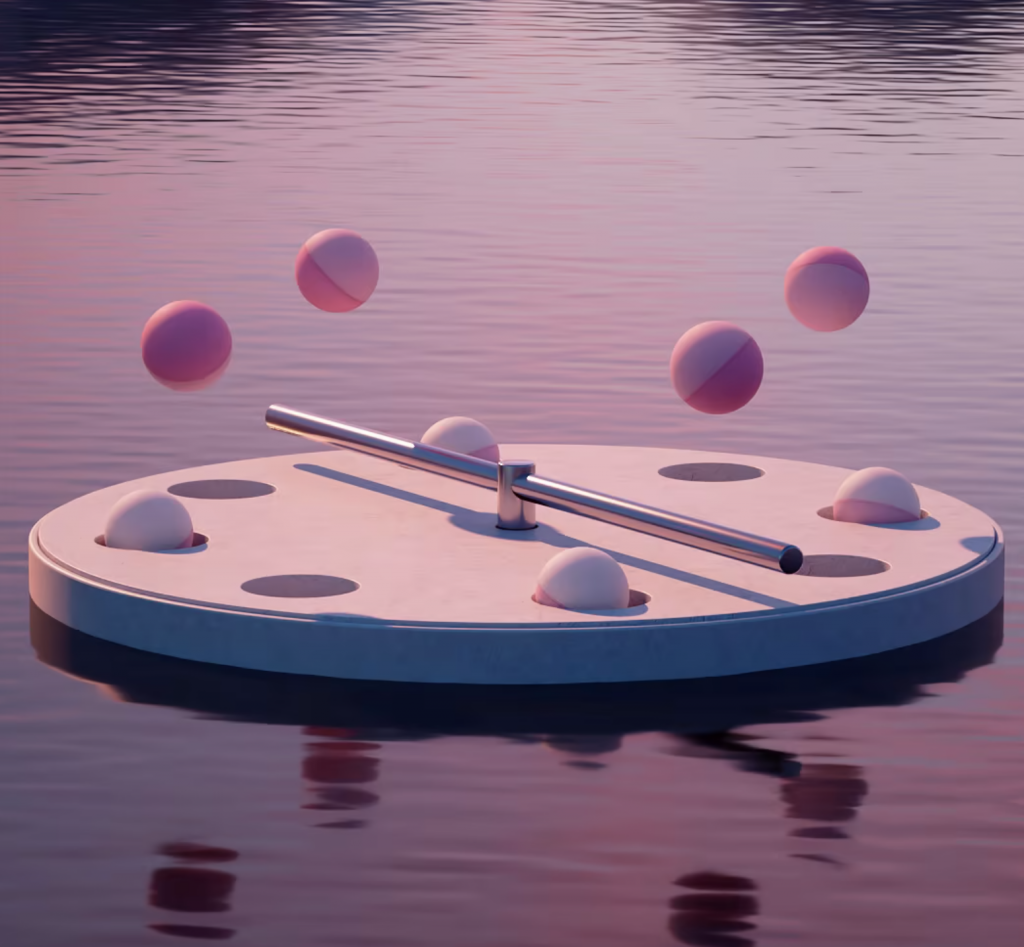
A piece of 3D computer art that I find inspiring is Synchronism by artist Andreas Wannerstedt. This piece is a set of three looping videos that show the synchronization between moving elements. I am familiar with Wannerstedts work, and what I love about all of his videos is that they create a very short yet satisfying loop that is visually beautiful. Each element is perfectly timed, and the pieces are so dynamic that you have to watch the loop a few times to really understand all of the parts. A lot of his graphics are also extremely photo representational and seem like they could really be sculptures or installations. From the look of the video, it seems like a 3d computer software was used to create these pieces. In his process, you can also see that he sticks to a certain graphic style that mixes bright colors with textures from nature or more industrial materials.
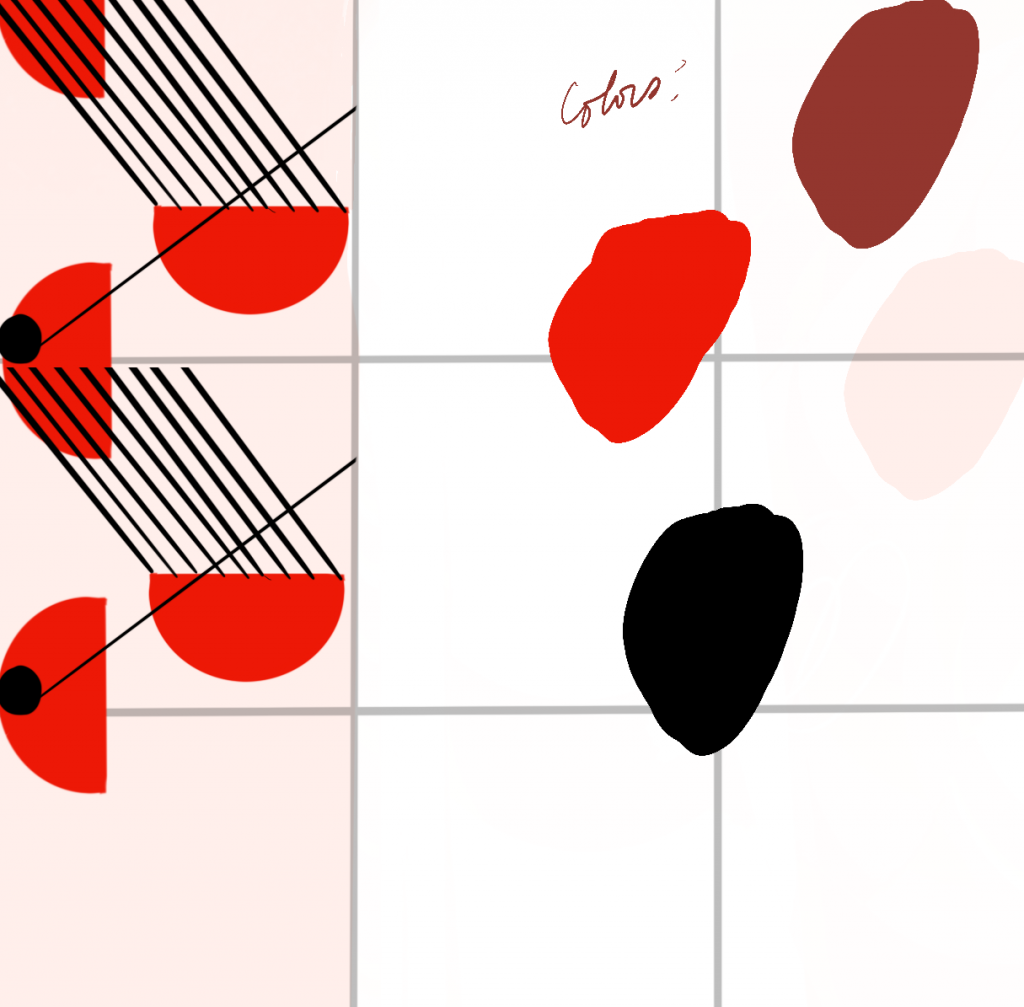
I thought this project was pretty fun! I approached it almost like making a singular tile and then repeating that to create the pattern.
//Jacky Lococo
//jlococo
//section C
functionsetup(){createCanvas(500,500);background(220);rectMode(CENTER)}functiondraw(){for(var y =125/4; y <= height-25; y +=62.5){ //columns made from tile function
for(var x =125/4; x <= width-25; x +=62.5){ //rows for tile fuction
tile (x, y)}}}function tile (x,y){push();translate(x,y) //main square for the tile -- contains quarter arcs that will make a semi cirlce when repeated
strokeWeight(0)fill(255,247,243)rect(x, y,125,125) //black circle within the horizontal cirlce
strokeWeight(0)fill(0)ellipse(x+25, y+10,23,23) //horizontal arc
strokeWeight(0);fill(242,0,0)arc(x+25, y+10,75,75,0, PI+ TWO_PI, CHORD) //3 lines coming from the horizontal arc
strokeWeight(1)line(x +25, y+10, x-25, y-62.5)line(x -12.5, y+10, x-61, y-62.5)line(x +5, y+10, x -43, y-62.5) //bottom left quarter arc to make verticle arc
strokeWeight(0);fill(242,0,0)arc(x-24, y+62.5,75,75, PI, PI*3/2, PIE) //top left quarter arc to make verticle arc
strokeWeight(0);fill(242,0,0)arc(x-24, y-62.5,75,75, PI/2, PI, PIE) //single left to right line
strokeWeight(1)line(x-24, y+50, x+62.5, y-62.5) //small black arc in the middle of the verticle arc -- only shown half of ellipse
strokeWeight(0)fill(0)ellipse(x-24, y+62.5,25,25) //tan colored arc at the top right of the tile
strokeWeight(0);fill(255,247,243)arc(x-24, y-62.5,25,25, PI/2, PI, PIE) //two small dots on top of each other -- sitting below horizontal arc
strokeWeight(0);fill(0)ellipse(x+25, y+55,5,5)strokeWeight(0);fill(0)ellipse(x+25, y-55,5,5)pop()}
The project Forms-string quartet is created by Playmodes. It is a live performance by a string quartet that uses randomly generated graphics as a score. The algorithm uses chance and probability to generate specific graphics that are then played by the string quartet. It is an immersive experience with both electronic music and panoramic visuals. I think that the algorithm uses a set of possible points or graphics and then picks them in random orders for each instrument. The website then says that a synthesis algorithm is used to interpret the vertical fragments of the image and transform them into different aspects of the music. I admire this project mainly because the graphics are very beautiful and to see them and hear the noise interpreted from it is very satisfying. It makes music visually digestible and understandable for the audience which I really enjoy!
![[OLD SEMESTER] 15-104 • Introduction to Computing for Creative Practice](../../wp-content/uploads/2023/09/stop-banner.png)