Rnayyar curve composition

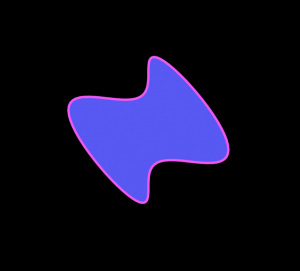
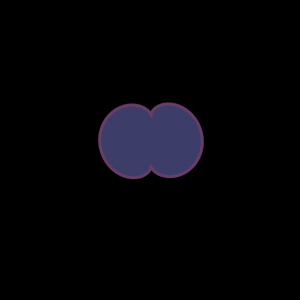
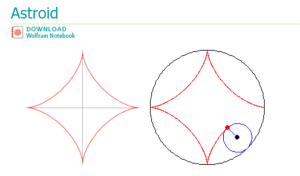
Uhh, so I tried to pore over all the curves available on mathworlds and kept on getting frustrated over my lack of understanding (math is, unsurprisingly, my weakest subject… especially when there are letters involved). I ended up modifying the example Epitrochoid code displayed in the deliverables section for week 7 to turn it into something completely unusual and unique compared to its original form. I named the function ‘Spanish Dancer’ because it reminds me of the wiggling, gyrating movements of fabric that are signature aspects of the revered Spanish Dance technique. My final product looks vaguely like the result of the sun reflecting light in a swimming pool, I suppose. I think that the final product was enhanced greatly by the inclusion of the ghosting effect, varying levels of opacity, and the rotation of one of the curves.


sketch

/* Rhea Nayyar
rnayyar@andrew.cmu.edu
Section C
Project 07-3; Curve Composition
*/

function setup() {
    createCanvas(600, 600);
}


function draw() {
    background(20,20,20, 30); //background with the ghosting command
    
    push();
    translate(width/2 - 30, height/2 - 30); //first curve shifted
    fill(70, 10, 200, 30); //Fluorescent Indigo-ish 
    spanishDancer(); // my curve function name
    pop();

    push();
    translate(width/2, height/2); //Second Curve Shifted
    rotate(20); //Tilt!
    fill(50, 160, 220, 20); //Somewhat greenish. Like a transluscent teal.
    spanishDancer(); //Second curve function called
    pop();
 

    push();
    translate(width/2 + 30, height/2 + 30); //Third curve shifted
    fill(100, 100, 220, 60); //It's kind of like a more intense version of periwinkle? 
    spanishDancer(); //third curve function called
    pop();
    
}

function spanishDancer(a, x, y) { //my curve
    var x;
    var y;
    
    var a = 80.0; //starts off with the same parameters as that example epitrochoid function on the deliverables page
    var b = a / 2.0;
    var h = constrain(mouseY / 15.0, 0, b);
    var ph = mouseX / 20.0;
    
    
    noStroke();
    beginShape(); //but then it gets wacked out by me playing with the parameters
    for (var i = 0; i < 100; i++) {
        var t = map(i, 0, 100, 0, TWO_PI);
        
        x = (a + b) * cos(t/2) - h * cos(ph + t*2 * (a + b) / b);
        y = (a + b) * sin(t*2) - h * sin(ph + t/2 * (a + b) / b);
        vertex(x,y);

        //lots of guessing and checking led to this happy, aesthetic accident. :)
    }
    endShape(CLOSE);


}

Jinhee Lee; Project 07

jinheel1_project-07

//Jinhee Lee
//Section C
//jinheel1@andrew.cmu.edu
//Project-07

var nPoints = 100;
var angle = 0; //start angle for rotating (out of canvas)

function setup() {
    createCanvas(500, 500);
}

function draw() {
	background(250);

    translate(width / 2, height / 2);
    if (mouseX > width) { //this one's for you, Anirudh
    	rotate(angle); //shape rotates in place
    }

    drawDeltoidCurve(); //calling helper function

    angle += 0.05; //increment for rotation
}

function drawDeltoidCurve() {
	// Deltoid
	// http://mathworld.wolfram.com/Deltoid.html

	var x; //curve in parametric form
	var y;

	var minSize = 80; //min size of shape
	var maxSize = 160; //max size of shape
	var mapA = map(mouseY, 0, width, minSize, maxSize); //maps size between minSize and maxSize
	var a = constrain(mapA, minSize, maxSize); //so that shape doesn't grow when mouseX beyond canvas
	var b = a / 3; //variable for curve equations
	var rot = constrain(mouseX / 30, 0, width / 30); //rotate according to mouseX

	fill("red"); //larger red circle
	ellipse(0, 0, 2 * a, 2 * a);

	fill(0);
	beginShape();
	for (var i = 0; i < nPoints; i++) {
		var theta = map(i, 0, nPoints, 0, TWO_PI);

		x = 2 * b * cos(theta) + b * cos(2 * theta - rot); //parametric equations of curve
		y = 2 * b * sin(theta) - b * sin(2 * theta - rot);
		vertex(x, y);
	}
	endShape(CLOSE);

	fill("red"); //smaller red circle
	ellipse(0, 0, b, b);
}

Having to implement parametric equations felt daunting at first, but in a broader look, it was mostly plugging in the deltoid curve’s equation with the templates given in the prompt. The two red circles I made separately fairly easily, but I made them share variables with the deltoid curve that governed its size, so they would all grow proportionally.

P.S.,

Fun fact, if you spin the deltoid to the right past the canvas, then you get-
YOU ARE NOW UNDER MY GENJUTSU

mreyes-lookingOutwards-Syncro Mail – Unconscious Collective

screen-shot-2016-10-14-at-11-07-30-pm

Syncro Mail – Unconscious CollectiveLisa Javbratt, 2003

Lisa Javbratt’s Syncro Mail Unconscious Collective, is a website witch allows the user to send an email with a randomly generated image and word from the internet. The website also plots the data of how many emails were sent, when they were sent, who sent them, who receive them, and even the words and even pictures themselves.

screen-shot-2016-10-14-at-11-07-06-pm

Instructions on how to read data from website. 

What initially made me curious of this site was the fact that although it was made in 2003 there was a very “shitpost”-esque sense of humor to it. While this may seem like a shallow read I admire art that is fun to interact with and uses humor to allow the to potentially audience to access more complex ideas. Additionally the website is simple and easy to use. While the artist’s intent is not explicitly clear, what I find most interesting about the piece is the data collection of interaction between people(or themselves) over the web. Additionally the thought of letting the internet communicate for people but still fining the interaction relatable with one another is also interesting.

I assume the algorithm for generating the word and image searches through either all online pages or just google and randomly picks on. The data (belive) assigns a random color for each addressed entered and then places a square or that color accordingly on the chart witch there is an a function to calculate the x and y coordinates depending on the week it was sent.

project 7

curve

var x = [];
var y = [];
var con = 0;
var mult = 1;
var col = [];
var rectX = 0;
var rectY = 25;
var rpY;

function setup() {
    createCanvas(400, 425);
    rpY = height - rectY;
}

function draw() {
	background("lightPink");
  strokeWeight(.5);
  for (var i = 0; i < width; i ++) {
  var term = 12 * con * cos(i) * sin(i);
  x[i] = term * cos(i);
  y[i] = term * sin(i);
  line(x[i] + width/2,y[i] + height/2,x[i+1] + width/2,y[i+1] + height/2);
  }
  con = mult * con + 1;
  if (con > 500) {
  con = mult * con + 2;
  }
  if(con > 1000) {
  con = mult * con + 3;
  }
  if (con > 6000) {
  con = mult * con + 50;
  }
  if (con > 10000) {
  con = 0;
  }
  println(con);
  fill("black")

  rect(rectX,rpY,10,25);
}

function mouseDragged() {
  rectX = mouseX;
  if (rectX > width - 10) {
  rectX = width - 10;
  }
  if (rectX < 0) {
  rectX = 0;
  }
  mult = rectX/50;

}

structured around an astroid radial curve

move slider to adjust speed (epilepsy warning for higher settings, imo)

ShanWang-Project-07-Curves

sketch

//Shan Wang
//Section A
//shanw1@andrew.cmu.edu
//Project-07

var nPoints = 300;
var a;
var x;
var y;
var posX;
var posY;
var color = 0;
var numLayer = 3;
var numCurve = 6;

function setup() {
    createCanvas(600,700);
}

function draw(){
    background(0);
    //constrain the x, y position of mouse;
    posX = constrain(mouseX, 0, width);
    posY = constrain(mouseY, 0, height);

    //control the amount that shift in x and in y direction with the position of mouse;
    var shiftY = map(posY, 0, height,1,5);
    var shiftX = map(posX, 0, width,1,5);

    //define unit of offsets;
    var intervX = width/10;
    var intervY = height/10;

    //generate three layer of multiple curves;
    for (var j = 0; j<numLayer; j++){
        for (var i = 0; i<numCurve; i++) {
            //cotrol the degree of curvatures with the change in mouse X;
            a = map(mouseX, 0, width, -width/3, width/2);
            //control the factor of scaling with the change of shift;
            var scaleX = shiftX/(3-j)*(i+1);
            var scaleY = shiftY/(3-j)*(i+1);
            //control the gradient;
            color = (i+1)*10*(j+3);
            drawConchoid(shiftX+i*intervX, shiftY+i*intervY,a,scaleX,scaleY,color);
        }
    }
}

// draw Conchoid of De Sluze Curve
function drawConchoid(sX, sY, a, scaleX, scaleY,color){
    push();
    stroke(color);
    //move the curvatures with the mouse;
    translate(posX,posY);
    beginShape(POINTS);
    for (var i = 0; i < nPoints; i++){
        var t =  map(i, 0, nPoints, 0, TWO_PI);
        x = (1/cos(t)+ a* cos(t))* cos(t);
        y = (1/cos(t)+ a* cos(t))* sin(t);
        x *= scaleX;
        y *= scaleY;
        vertex(x+sX,y+sY);
    }
    endShape();
    pop();
}

In this project I experimented with a lot of functions that create different curvatures, and I was mainly exploring the dynamic movement of the curves associating with the mouse.

I also tried to create black background in contrast with points of different gradient for a sense of space and depth.

Hannah K-Project-07

sketch-90.js

var c1nPoints = 10; // Number of points for curve 1
var c2nPoints = 7; // Number of points for curve 2

function setup() {
    createCanvas(500, 500);
    frameRate(15);
}

function draw() {    
    // Draw the frame
    fill(255, mouseX, mouseY);
    rect(0, 0, width-1, height-1); 
    
    // Draw the curve
    push();
    translate(width / 2, height / 2);
        drawCurve1();
        drawCurve2();
    pop();
}

// Relying on class notes for drawCranioidCurve() for Week 7 Deliverables
// Drawing this curve:
// http://mathworld.wolfsram.com/Scarabaeus.html - Sextic curve

function drawCurve1() {
    strokeWeight(1.2);
    fill(mouseX, mouseY, 255);
    var x;
    var y;
    var r;
  
    var a = constrain((mouseX / width), 0.0, 1.0);
    var b = constrain((mouseY / height), 0.0, 1.0);
    // Color depends on x and y movements of mouse
    fill(mouseY, mouseX, 255);
    beginShape();
    for (var i = 0; i < c1nPoints; i++) {
        var t = map(i, 0, c1nPoints, 0, TWO_PI);

        // Curve 1 - Used equation from mathworld.com
        r = (b + mouseY) * cos(2*t) -
        (a + mouseX) * cos(t);

        // Using code from class notes under "Deliverables Week 7"
        x = r * cos(t);
        y = r * sin(t);
        vertex(x, y);
    }
    endShape(CLOSE);
}

function drawCurve2() {
    strokeWeight(0.5); 
    var x;
    var y;
    var r;
    

    var a = constrain((mouseX / width), 0.0, 1.0);
    var b = constrain((mouseY / height), 0.0, 1.0);
    // Color depends on x and y movements of mouse
    fill(mouseX, mouseY, 255);
    beginShape();
    for (var i = 0; i < c2nPoints; i++) {
        var t = map(i, 0, c2nPoints, 0, TWO_PI);

        // Curve 2 - Used equation from mathworld.com
        r = (b + mouseX) * cos(2*t) -
        (a + mouseY) * cos(t);

        // Using code from class notes under "Deliverables Week 7"
        x = r * cos(t); 
        y = r * sin(t);
        vertex(x, y); 
    }
    endShape(CLOSE);
}

The process for creating the project this week was different from what I usually do.
Because it was difficult to visualize how changing certain elements of my code would change what I saw, I could not really draw a sketch to plan what I wanted to created.

I went on the website provided to us and just picked a curve and to be honest, I relied pretty heavily on the template code that was provided to us. The end result of this project far exceeded my expectations, and I am super happy with the final result!

I especially really like that at one point when you are moving your mouse (move your mouse to the far left near the middle of the canvas!), the curves create a star.

looking outwards 7

Nand.io is a design studio that specializes in information visualization and new media art. They are interested in displaying data on a large scale, as well as interactions between analog and digital media.

This collection was created for the 14th Poetry on the Road Festival, in Bremen Germany, and is a visualization of the origins of participating poets and the links in their creative processes.

This is a visualization of some of the work necessary to create this map projection (I don’t really understand it). I believe that there are probably two primary algorithms at play in these pieces, one to map the location of the poets, and one to create the map projection.

I like these designs because I really like maps, and the projection they used reminds me of the Waterman Butterfly projection. Nand.io’s interest in large scale visualization clearly comes across in this display of the world poetry scene.

A link to the project can be found here.

Liu Xiangqi-Looking Outwards-07

The project “Flight Patterns” was created by Aaron Koblin, Scott Hessels and Gabriel Dunne. It visualized the paths of air traffic over North America in different colors. It created some interesting celestial patterns through intersections of different paths. And those intersections are where the big cities lie. It never occurred to me that aggregation of these paths can be a reflection of positions of celestial bodies. It seems that our planet is wrapped by layers of these nets consisting of paths. A billions of light year away, or right above our head in the stratosphere. The man-made sky map is just amazing.

Flight Pattern, Aaron Koblin

Hannah K-Looking Outwards-07

This week for my Looking Outwards, I found a visualization of information of relations in the Middle East created by David McCandless, developed in collaboration with Univers Labs. David McCandless is the creator of informationisbeautiful.net.

Below is a screenshot of what this infographic looks like (You can click directly on the image or use the “Middle East” hyperlink above to use the infographic—it was not directly embeddable).

This graphic shows the key players in Middle East relations and the notable relationships that exist between countries.

I really liked this graphic because it displays a variety of complex information and relationships, and being an international relations primary major, this information especially interest me personally. Not only is the graphic beautiful to look at, but it also has a very functional purpose too.

There was no information available on how this was made, other than the fact that this infographic is powered by VizSweet. I suppose that there would have been algorithms used to repeat the same behavior of expanding one dot into a “web,” but I do not think any algorithms would have been used to come up with the data that this infographic displays.

Project 7 Lydia Jin

sketch

//Lydia Jin
//Section B
// jialuj@andrew.cmu.edu
// Project 7
var nPoints = 100;
function setup() {
    createCanvas(600, 600);
}

function draw() {
	background('black');

	//print title
	fill('white');
	text("Astroid", 20, 20);

	//color changes over mouse interactions
	var r = map(mouseX, 0, 600, 0, 255);
	var rr = map(mouseY, 0, 600, 0, 255);

	push();
	stroke(r, rr, r);
	strokeWeight(4);
	translate(width/2, height/2);
	var x;
	var y;
	//get b from mouse X coodinate
	var b = map(mouseX, 0, width, 5, 35);
	var ph = mouseY/45;
	fill(rr, rr, r);
	beginShape();

	//draw the Astroid
	for (var i =0; i < nPoints; i++){
		var t = map(i, 0, nPoints, 0, TWO_PI);
		x = 3 * b * cos(t) + b * cos(3 * t);
		y = 3 * b * sin(t) - b * sin(ph + 3 * t);
		vertex(x, y);
	}
	endShape(CLOSE);

	pop();
}

capture1

capture2

capture3

astroid

I came up with this idea by looking at the list of curves on the math website. I really like the looks of the astroid as it looks like a star. Then I did some changes to it so sometimes it looks round and other times pointy. I also wanted the colors to change and now the design sort of looks like changing microorganisms. The shapes are also enclosed by different colored strokes to make the images appear more visually appealing.The user can move the mouse to see the changing shapes.