Alison Hoffman – Looking Outwards 7

screen-shot-2016-10-14-at-10-15-54-pm

(still of interactive piece Project Ukko)

This is interactive data visualization, entitled Project Ukko, was created by Moritz Stefaner as a representation of the wind patterns across the world. What I find rather amazing about this piece is predictive power. In addition to being a easy to follow visualization of the wind patterns it can also predict future wind patterns based on the data set. I also appreciate how intuitive and simple the design is. The thickness of the lines represents strength while color and tilt represent increase/decrease in speed.  It is very user friendly, which when looking at other visualizations wasn’t always the case. This visualization has practical applications for energy farmers and others in the energy sector, and I think when it comes to these types of data visualizations, practicality translates well into ease of use. For less practical data sets I think artists can make the visualizations a little more abstract.

mreyes-project 07

sketch

//Mercedes Reys

//Section C 

//mreyes@andrew.cmu.edu

//project-06-a

var nPoints = 3000; // points in outer cricel drawing curve 

function setup() {
    frameRate(.0001)
    createCanvas(600, 600);
    frameRate(10);// slow down fram rate 
}


function draw() {
    background(255,200,200);

    drawEpitrochoid();//top curve
    push();
    translate(width / 2, height / 2);
    drawEpitrochoid();//middle curve 
    translate(width / 2, height / 2);// bottom cuve 
    drawEpitrochoid();
    pop();
}


function drawEpitrochoid() {
    noStroke()

    //variables 
    var x;
    var y;

    //noise
    var randomness = (mouseX/40)+1; // level of noise is depenant on mouseX
    var randomShift = random(0, randomness); 
     
    var a = 200.0; // diamater of original cirlce
    var b = a /3.0 + randomness/nPoints;// diamater of circles added to original circle
    var h = constrain(randomShift/ .3, 0, b);// grow when mouse is moved to the right
    var ph = randomShift/30.0; // devide by random to reduce jerky-ness of movement

    fill(200, 255, 200,150);
    beginShape();
    for (var i = 0; i < nPoints; i++) {
        var t = map(i, 0, nPoints*random(-randomness, randomness), 0, TWO_PI);// map out nPoints to cirlce and a
        
        //calculate vertex 
        x = (a + b) * cos(t) - h * cos(ph + t * (a + b) / b);
        y = (a + b) * sin(t) - h * sin(ph + t * (a + b) / b);
        vertex(x, y);
    }
    endShape(CLOSE);

    push();
    
}

The epitrochoid curve was the only curve I could manage to understand how to make, so I started off by recreating the curve made in the example. I then wanted to make the curve grow in an more organic way. So I created a noise variable and applied that to the constraint. It wasn’t vary dynamic at that point so I experimented with adding the noise to diffrent variables and this was the result.


Liu Xiangqi-Project-07

The project I tried to create is made up of eight curves and parabola. The parameter a (the scale of the eight curves) and b (the scale of the parabolas) is controlled by the x coordinates of the mouse. The number and the rotation degree is controlled by the y coordinates of the mouse. When a user moves the mouse, he/she can expect a procedure of flower blossom or a comet with its long tail. I was intended to create a kaleidoscope through the intertwine and changes of different curves.
sketch


function  setup() {
  createCanvas(600, 600);
}
 
function draw(){
  background(200, 200, 255);
  //keep the size of the eight curve in a reasonable size
  var x = min(mouseX, width);
  //like the parameter to mouseX
  var a = map(x, 0, width, 0, 200);
  var b = map(mouseX, 0, width, 0, 400);
  //link the rotation to mouseY
  var deg = map(mouseY, 0, height, 0, 360);
  noFill();
  stroke(255);
  push();
  translate(width/2, height/2);
  for (var j = 0; j < deg; j += 3600/deg){
    rotate(720/deg);
    beginShape();
    curveVertex(0, 0);
    //draw the complete eight curve
    for (var i = -10; i < 10; i += 0.1){
         var x = a*sin(i);
         var y = a*sin(i)*cos(i);
         curveVertex(x, y);
    }
    curveVertex(0, 0);
    endShape();
    
    beginShape();
    curveVertex(0, 0);
    //draw the complate parabola curve
    for (var i = -10; i < 10; i += 0.1){
         var x = b*sq(i);
         var y = 2*b*i;
         curveVertex(x, y);
    }
    curveVertex(0, 0);
    endShape();
  }
  pop();
  

}

Sofia Syjuco – Project-07

sketch

// Sofia Syjuco
// Section A
// smsyjuco@andrew.cmu.edu
// assignment-07-c

var nPoints = 100; // number of vertices

function setup(){
  createCanvas(400,400); // create a canvas of 400 x 400
  
}

function draw(){
  background(230); // fill background with off-white
  noStroke(); // don't draw the stroke lines

  push();// keep translate info within here
  translate(width/2, height/2); // move to the middle of the screen
  drawCardioid(); // draw the shape
  pop(); // end of translate information section
}

function drawCardioid(){
  //http://mathworld.wolfram.com/Cardioid.html

  var x; // create a variable for x coord
  var y; // create a varaiable for y coord

  // fill with colors dependant on mouse position
  fill(abs(mouseX) % 256, abs(mouseY) % 256, abs(mouseX + mouseY) % 256, 100);

  var a = 80; // size of the shape 

  var mX = constrain(mouseX, 0, width) / 100.0; // variable for using mouseX position
  var mY = constrain(mouseY, 0, height) / 100.0; // variable for using mouseY position

  beginShape(); // begin drawing the shape
  for (var i = 0; i < nPoints; i++){ // draw as many vertices as nPoints states
    var t = map(i, 0, nPoints, 0, TWO_PI); // parameter for function that varies with i

    x = a * (cos(t + mX) * (1-(cos(t + mX)))); // finding the x for the vertex
    y = a * (sin(t + mY) * (1-(cos(t + mY)))); // finding the y for the vertex

    vertex(x,y);// draw a vertex at these points
  }
  endShape(CLOSE); // close the shape
}

To create this shape, I looked through the curve website for an interesting curve, and used it in my code. I played around with seeing what I could effect with mouseX and mouseY, placing them in different areas to experiment and seeing exactly how the shape would change each time. I found this project a really interesting challenge, as we haven’t worked with equations like this before. It was difficult to try and understand just how to implement this in our code, and I found the examples particularly helpful to establish the base of the code- before playing around with different values to make it unique.

Shannon Case Project 07 – Curves

sketch

//Shannon Case
//Section D
//scase@andrew.cmu.edu
//assignment 07-A

var nPoints = 100;
//var valE = 2.718; // This is the value of # 'e'

function setup() {
    createCanvas(400, 400);
    frameRate(10);
}


function draw() {
   
    
    // draw the frame
    fill((mouseY/height)*100,(mouseY/height)*200,(mouseY/height)*255);
    rect(0, 0, width-1, height-1); 
    
    // draw the curve
    push();
    translate(width / 2, height / 2);
        drawEllipseEvoluteCurve();

    pop();

}

function drawEllipseEvoluteCurve() {
    // Ellipse Evolute
    // http://mathworld.wolfram.com/EllipseEvolute.html
    
    var x;
    var y;

    var a = constrain((mouseX / width), 0.1, 0.5);
    var b = constrain((mouseY / height), 0.1, 0.5);
    
    fill((mouseX/width)*255,(mouseX/width)*100,(mouseX/width)*255);
    strokeWeight(5);
    stroke((mouseX/width)*200,(mouseX/width)*55,(mouseX/width)*255);
    beginShape();
    for(var i = 0; i < nPoints; i++) {
        var t = map(i, 0, nPoints, 0, TWO_PI);

        x = ((Math.pow(a+(mouseX/45), 2) - Math.pow(b, 2)) / a * (Math.pow(cos(t), 3)));
        y = ((Math.pow(b+(mouseY/48), 2) - Math.pow(a, 2)) / b * (Math.pow(sin(t), 3)));
        vertex(x, y);

    }
            endShape(CLOSE);

}


For this project I really struggled with choosing a curve that worked. I chose a bunch that weren’t really able to move well with both the x and y values, but eventually decided on the Ellipse Evolute because it was more easily able to stretch and shrink with my mouseX and mouseY. I chose to have the background color evolve with the mouseY values and the color of the shape change with the mouseX values.

Looking Outwards 7 Lydia Jin

selfiexploratory

Selfiecity analyzing selfies using different categories

Selfiecity is created by a group of 8 members starting in 2014 and this visualization technique investigates selfies using a mix of theoretic, artistic and quantitative methods. Rich media visualizations or image plots put together thousands of photos to reveal selfies’ patterns in 5 different demographic groups based on cities. The team then reports the patterns found in this experiment by writing essays relating to the history of selfies and how it is influencing social media. I find this idea particularly interesting because it uses creative methods to analyze a common phenomenon (taking selfies) and shows patterns of these phenomenon. The program uses an algorithm that identifies age, gender, position of face, position of eye, mood, and glasses. This project shows that the team are very innovative and are willing to investigate in depth of an activity that is commonly practiced in the modern world. Please click here for more information Selfiecity.


Looking Outwards 7

Santiago Oritz’s Ross Spiral curriculum visualizes the “history of humankind and all its interconnections.” The screen is split into three distinct sections: the leftmost third being the visual spiral itself, the thin middle third is reveal timeline, panel, and units, the rightmost third is the description. The information is broken down and categorized into: subject, grade, course, unit, learning experience. Each piece of information is displayed differently on the spiral; location, ellipse, color, and size all represent different categories. I really like the artistic implications that the spiral’s radius grows as the grade grows suggesting that the implications and breadth of knowledge expands as age and maturity increases. To me, the program looks incredibly complicated: mapping the ellipse and the timeline to moving the image and mapping the zoom to the mouse scrolling.

Link to Work

More of Santiago’s Work

Alison Hoffman – Project 7

Project 7-ach

//Alison Hoffman
//Section D
//achoffma@andrew.cmu.edu
//Project 7 - Curves 

var points = 1000; // number of points 
function setup() {
    createCanvas(420,420);
}

function draw() {
    background(7,26,85);
    push();   // medium curve
    translate(75,75);
    rotate(radians(230));
    drawCurve(85,4,200);
    pop();
    push();
    translate(width/6*5,height/3*2); // lightest
    rotate(radians(90));
    drawCurve(100,2,100);
    pop();
    push();
    translate(width/2,height/2-15); //thicker curve
    rotate(radians(65));
    drawCurve(30,8,60);
    drawCurve(45,8,60);
    pop();
}


function drawCurve(h,w,c) { //takes parameters, h (height variant), w(stroke Weight), and c (value of Green)
    var a = constrain(mouseY/5,0,height); // constrains a to mouseY
    var b = constrain(mouseX/15,0,width); // constrains mouseX to b
    var h = h; // variant degree of curve
    var x;
    var y;
    stroke(mouseX,c,mouseY); // color of stroke depends on input and mouse postions
    strokeWeight(w);
    //
    beginShape();
    noFill();
    for(var i = 0; i < points; i++){
        var t = map(i,0,points,0,TWO_PI); // maps theta to the size of the circle
        x = ((a+b)*cos(t))-(h*cos(((a+b)/b)*t)); // I reversed the signs of the orginal formula in order to invert the curve
        y = ((a+b)*sin(t))-(h*sin(((a+b)/b)*t)); // reversed signs to invert the curve
        curveVertex(-x,-y);
    }
    endShape();
}

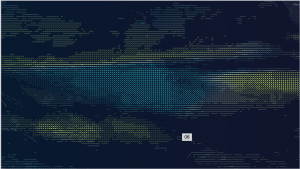
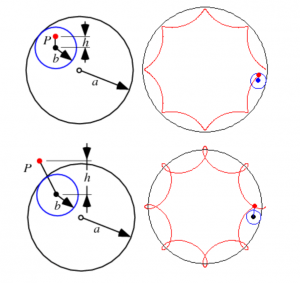
This project was really intimidating at first, but once I found a curve that I thought I could replicate it became easier to understand the math behind it. I chose to create a Epicycloid (pictured below). However, I didn’t really like how it created a flower like curve, so I inverted the signs of the formula (- to + and + to -) in order to have the ‘petals’ point inward. I also made the color of the curve depend on the position of the mouse and an input parameter. I chose to do multiple curves to show how the shape changed with varying stroke weight. Overall, once I got started and playing around, I actually ended up really enjoying this project.

screen-shot-2016-10-14-at-9-01-50-pm

Sofia Syjuco – Looking Outwards 7

Ebb and Flow at the Box Office
Amanda Cox
February 24, 2008

A visual representation for domestic box office receipts in 2007
http://www.nytimes.com/imagepages/2008/02/24/business/24METRIC_GRAPHIC.html

Ebb and Flow at the Box Office by Amanda Cox is a project that I find very interesting. She has graphically represented the domestic box office receipts for films that opened in 2007, but in such a way as to be an art piece within itself. The work itself looks like the shifting silt in a river, that different qualities of soil have different colors or appearances, but all are slowly moving with the water, creating a beautiful pattern. I admire the aesthetic and artistic sensibilities of the work, and how despite its beauty, the graphical representation remains simple enough that it can easily be read and understood. The creator’s artistic sensibilities are manifest in the final form in that, while the representation retains some nod towards aesthetic considerations, the colors are muted and the communication of data remains the most important consideration.

sihand – Project Week 07 – Crystallize

Crystallize

I really enjoyed playing around with the equations and variables. During the course of my experimentation, I discovered a few cool effects combining different curves, but they all looked too chaotic. In the end, I chose this one, which is more simple and resembles an interesting crystallizing effect. It consists of an array of spiky shapes, which are modifications of a deltoid equation, that accumulate as the mouse moves across the canvas.

Sihan – crystallize

//Sihan Dong
//sihand@andrew.cmu.edu
//Section B
//Project Week 07: curves

var nPoints = 30;

function setup() {
    createCanvas(600, 400);
}

function draw() {
	background(255, map(mouseX, 0, width, 0, 200), map(mouseY, 0, height, 0, 200));
	stroke(255);
    noFill();
    drawDA();
}

function drawDA() {
	translate(width/2, height/2);
	var x = [];//array of spiky curves
	var y = [];
	var xa;//variables of circular curve
	var ya;
	
//only draw curves when mouse is within canvas
	if (mouseX < width & mouseY < height) {

    beginShape();
    for (var i = 0; i < nPoints; i++) {
        var t = map(i, 0, nPoints, 0, TWO_PI);
        for(var j = 0; j < min(mouseX/50, width); j++) {
        	var a = map(mouseX, 0, width, 0, 150);
			var d = map(mouseY, 0, width, 5, 8*j);
		//spiky curve
        	x[j] = j*d*cos(t) + j*cos(j*t);
        	y[j] = j*d*sin(t) - j*sin(j*t);
    	//circular curve    
        	xa = a*cos(t);
        	ya = a*sin(t);

        	vertex(xa, ya);
        	vertex(x[j], y[j]);
    	}
    }
    endShape();
    print(d);
    print(mouseY);
	}
}