Sarita Chen – Project 7 – Curves

sketch

var nPoints = 100; //Points in the ellipses

function setup() {
    createCanvas(500, 500);
    frameRate(10);
    
}

function draw() {

	background(0);
	push();
	translate(width/2,height/2);
	rotate(radians(mouseX));
	myCircle();
	pop();
}	

function myCircle() {

	var a = 300; // radius
	var b = a/2; // half of radius 1
	var c = 125; // radius 2
	var d = c/2; // half of radius 2
	var h = constrain(mouseX /10,0,a); // distance
	var w = constrain(mouseY/10,0,b);
	var x; //Hypotrochoid
	var y; //Hypotrochoid
	var u; // Hypotrochoid 2
	var v; //Hypotrochoid 2
	

	beginShape();
	

	for (var i = 0; i < nPoints; i++) {  
		var theta = map(i,0,nPoints,0, TWO_PI); // Makes the outline of the shape small circles
		ellipse(x, y, 1,1);
		x = (a - b ) * cos(theta) + h * cos( (a - b)/ b * theta); // Formula for hypotrochoid
		y = (a - b) * sin(theta) - h * sin( (a - b)/ b * theta); // Formula for hypotrochoid

		fill(255);
		noStroke();
		ellipse(u, v, 2,2);
		u = (c - d ) * cos(theta) + w * cos( (c - d)/ d * theta); // Formula for hypotrochoid
		v = (c - d) * sin(theta) - w * sin( (c - d)/ d * theta); // Formula for hypotrochoid
		
		
	}
	endShape(CLOSE);	

}

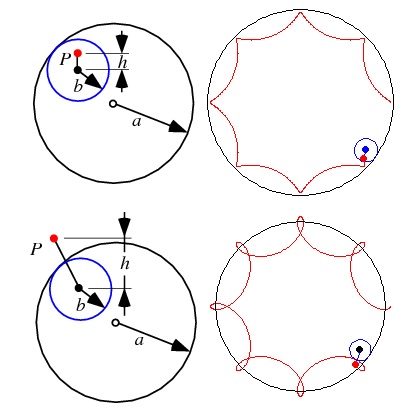
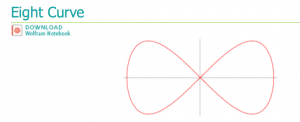
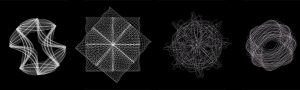
I had some trouble figuring out just exactly what I was supposed to do with the equations at first. I really hate math, so just looking at it in the beginning was throwing me off. It’s based very, very loosely off of this video (the white on black, not the actual mathematical stuff) and this image.

screen-shot-2016-10-14-at-7-02-25-pm   screen-shot-2016-10-14-at-7-02-41-pm

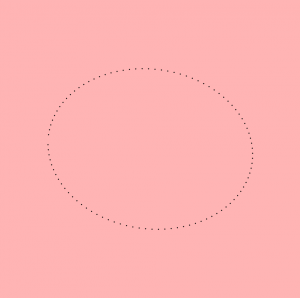
It started off pink and with only one ring, but I decided to change all those aspects.

Project 07 – JamesKatungyi

Project 07 – Composition with curves

jkatungy-project07-curves

//James Katungyi
//Section A 0900
//jkatungy@andrew.cmu.edu
//Assignment-Project-07


var n = 27;
var h = 24;
var a = 120;
var Rad = 500;
var t = 0;

//undulating ground
function Topo(){
    fill(200, 100, 0);
    beginShape();
    vertex(width, height - 60); //first vertex on right canvas edge
    for (var i = 0; i < 100; i++){
        t = map(i, 0, 100, 0, PI);
        var x = 300 + cos (t) * Rad;
        var y = sin (t) * Rad - 200;
        vertex(x,y); //vertices defined by curve
        //println(t);
        //println(i);
    }
    vertex(0, height - 60); //vertex on left canvas edge
    vertex(0, height); // lower left vertex
    vertex(width, height); // lower right vertex
    endShape(CLOSE)
    //println(t);
    //println(i);
}
function Hypocycloid(){
    var b = a / n;
    fill(250, 240, 240); //pink
    beginShape();
    for (var i = 0; i < 4000; i++){
        var t = map(i, 0, 4000, 0, TWO_PI*n);
        var x = (a - b) * cos (t) + h * cos ((a - b) * t / b);
        var y = (a - b) * sin (t) - h * sin ((a - b) * t / b);
        vertex(x, y);
    }
    endShape(CLOSE);
}

function setup(){
    createCanvas(600, 400);
}
function draw(){
    background(200, 225, 250);//blue background
    Topo();//undulating ground function
    //mouseX as for canvas translation position
    var locX = map(mouseX, 0, width, 120, 480);
    //relate y value to x along the circle
    var y = sqrt((Rad * Rad) - (locX - 300) * (locX - 300)) - 200;
    //Angle R for canvas rotation as function of mouseX
    var AngleR = map(mouseX, 0, width, 0, PI);
    push();
    //translate canvas to mouseX position and topo y position
    translate (locX, y - 140);
    //rotate canvas relative to mouseX position
    rotate(AngleR);
    //call wheel - hypocycloid
    Hypocycloid();
    pop();
}

Using a hypocycloid, I made a wheel that rolls across the screen following the mouse but along a path defined by an arc. Working out the control parameters to follow the curved path proved difficult but was eventually resolved using the formula for cartesian coordinates of the points of the circle.

Project-07-CompositionWithCurves

sketch-70

//Victor Tavarez
//Section D
//vtavarez@andrew.cmu.edu
//Project-07-CompositionWithCurves


function setup() {
    createCanvas(500,500);
}

function draw() {
    background(60);
    push();
    translate(width/2, height/2);
    plotMiceProblem();
    pop()

}

function plotMiceProblem(){
    var nPoints = map(mouseY, 0, height, 0 ,1000);
    var x;
    var y;
    var n = map(mouseX, 0, width,0,10); // will be used to draw more itterations

    beginShape();
    //nPoint influenced by y value to give "drawing" effect
    for (var i=0; i < nPoints; i++){ 
        var t = map(i,0,nPoints,0,TWO_PI*n);
        noFill();
        var clrR = map(mouseX, 0, width,100,255); 
        var clrG = map(mouseX, 0, width,200,230);
        var clrB = map(mouseX,0,width,230,255);
        strokeWeight(4);
        stroke(clrR,clrG,clrB); // 
        //equations as listed on mathworld.wolfram.com/ButterflyCurve.html
        x = Math.sin(t) * (Math.pow(Math.E,Math.cos(t))
                        - 2*Math.cos(4*t) 
                        + Math.pow(Math.sin(t/12),5));

        y = Math.cos(t) * (Math.pow(Math.E,Math.cos(t))
                        - 2*Math.cos(4*t) 
                        + Math.pow(Math.sin(t/12),5));

        vertex(x*70,y*50); //wider than tall
    }
    endShape(CLOSE);  
}

For this project, I decided to represent the drawing of a Butterfly curve. To do so, I decided to link the draw function to a the mouseX value to give it the appearance of it ‘drawing’. The most difficult part of this was writing down the x and y equations because it involved Math operators I was unfamiliar with. Once I got the curve to draw, I implemented the changes that the mousex and mouseY would do. MouseX draws and colors the curve. MouseY also draws but smoothens the curve.

Project 07 Curves

This project was a lot of fun to experiment with. I originally planned to make something different, but as I experimented I developed this idea. I used the Scarabaeus Curve and realized it resembled a club from a deck of cards, which differed from my original idea to make it a flower. I had trouble with modifying the curve at first, but it got easier as I worked on it.

sketch

//Rebecca Enright
//Section A
//renright@andrew.cmu.edu
//Curve Composition

function setup() {
    createCanvas(640, 480);   
}

function draw() {
    background(255, 0, 0);    
    //draw club
    push();
    translate(width/2, height/2);
    CreateClub();
    pop();
    
}

function CreateClub() {
    //create variables for a, b, and nPoints
    var a = 50;
    var b = 100;
    var nPoints = 100;
    var pw = constrain((mouseX/50), 0, 10);
    var ph = constrain((mouseY/50), 0, 10);
    //create Scarabaeus curve
    fill(0);
    beginShape();
    for (var i = 0; i < nPoints; i++) {
        var t = map(i, 0, nPoints, 0, TWO_PI);  
        //function for curve      
        var r = b * cos(2 * t) - a * cos(t); 
        
        //create x and y for vertex
        var x = r * cos(pw + t);
        var y = r * sin(ph + t);
        
        vertex(x,y);  
    }
    endShape(CLOSE);
} 


jihoonp_project_07

sketch

//Jihoon Park
//section A
//jihoonp@andrew.cmu.edu
//project-07

var nPoints = 100;
var divider;					//number of points in hypotrochoid

function setup() {
	createCanvas(600,600);
	frameRate(10);
}

function draw() {
	background(0);

	for(var i=0; i<10; i++) {		//loops the Hypotrochoid with 30 pixel space
		var col = map(i, 0, 10, 0, 255); //color map
		stroke(col);
		noFill();				//inner geometry fades
		Hypo(i*30, mouseX/50);		//changes the number of points according to mouse X
	}
}

function Hypo(a, divider) {
	var x;
	var y; 

	var a;									//radius of circumscribed circle
	var b=a/divider;						//radius of inscribed circle
	var h = constrain(mouseY/10, 0, a);		//length of rotating point generator
	var ph = mouseX/50;						//rotation of hypotrochoid
	push();									//moves the origin of hypotrochoid to center
	translate(width/2, height/2);
	beginShape();
	for(var i=0; i<nPoints; i++) {
		var t = map(i, 0, nPoints, 0, TWO_PI);
		x=(a-b)*cos(t) + h*cos(ph+t*(a-b)/b);
		y=(a-b)*sin(t) - h*sin(ph+t*(a-b)/b);
		vertex(x, y);	
	}
	endShape(CLOSE);
	pop();
}

In this project I made a function called Hypo, which is a short term I gave for hypotrochoid. This geometry has 3 variables which are the radius of circumscribed circle, inner orbiting circle and the length of the line which is rotated from the center of orbiting circle. I made all of the variables modifiable according to the x and y position of the mouse, then looped the geometry to form an overlap.
hypotrochoid

GarrettRauck-Project-07

sketch

//Garrett Rauck
//Section C
//grauck@andrew.cmu.edu
//Assignment-07-Project-Composition with Curves

/////////////////////////////////
// DECLARE VARIABLES
/////////////////////////////////
//canvas vars
var canvasWidth, canvasHeight, nRows, nCols, cellSizeX, cellSizeY;
//event vars
var mx, my; //constrained mouseX and mouseY
//curve vars
var nPts, scaleFactor, falloffFactor;
//color

/////////////////////////////////
// HELPER FNS
/////////////////////////////////
function drawConchoidOfDeSluzeCurve(cx, cy, a) {
	//Conchoid of de Sluze
	//http://mathworld.wolfram.com/ConchoidofdeSluze.html

	var x, y;

	var scaleFactor = map(my, 0, canvasHeight, 1, 10);

	noFill();
	stroke(255);
	beginShape();
	for (var i = 0; i < nPts; i++) {
		var t = map(i, 0, nPts, 0, TWO_PI);
		// compute raw curve vals
		x = (1/cos(t) + a*cos(t)) * cos(t); // x = (sec t + a cos t) cos t
		y = (1/cos(t) + a*cos(t)) * sin(t); // x = (sec t + a cos t) sin t
		// scale vals
		x *= scaleFactor;
		y *= scaleFactor;
		// position in canvas
		x += cx;
		y += cy;
		// create vertex
		vertex(x, y);
	}
	endShape();
}

/////////////////////////////////
// EVENTS
/////////////////////////////////

/////////////////////////////////
// RUN!
/////////////////////////////////
function setup() {
	// INIT VARS
	nPts = 75;
	falloffFactor = 0.6;
	//canvas
	canvasWidth = canvasHeight = 640;
	nRows = 4;
	nCols = 4;
	cellSizeX = canvasWidth/nCols;
	cellSizeY = canvasHeight/nRows;

	// CANVAS SETUP
    createCanvas(canvasWidth, canvasHeight);
}

function draw() {
	background(0); //update background

	//constrain mouse position to canvas
	mx = constrain(mouseX, 0, canvasWidth);
	my = constrain(mouseY, 0, canvasHeight);
	//get a value of outer-most curve
	var aMax = map(mx, 0, canvasWidth, -50, 50);

	//create grid
	for (row = 0; row < nRows; row++) {
		for (col = 0; col < nCols; col++) {
			var cx = col*cellSizeX + cellSizeX/2;
			var cy = row*cellSizeY + cellSizeY/2;
			//create nested Conchoid of de Sluze curves at grid pt
			for (a = aMax; abs(a) > 1; a *= falloffFactor) {
				//draw curve centered at pt
				drawConchoidOfDeSluzeCurve(cx, cy, a);
	        }
		}
	}
	
}

I chose one of the curves off of the Wolfram web site and used the mouse position to manipulate the scale of the curve and the order, or “a” variable, of the curve. For loops is are used to create the nested curves of different orders, as well as to create the overall array of curves for the composition.

Looking Outwards-07- Information Visualization-sehenry

The project that I chose was an interactive program that allows you to pick personal sources of information based on what you are interested in. So for me, I browsed through their choices and found a category called Life, The Universe, and Everything. Within the category, I chose weather and it relocated me to a weather map showing where wind, all over the country, is headed, in an interactive artistic weather map. Small white/grayish lines would follow a path deduced by the internet in multiple places, all over the U.S. The real art comes from the template where you are allowed to choose which subject to learn about. As your mouse travels around the screen different portions of the screen grow, shrink, and shift. The site kind of looks like a bookshelf full of album covers that you can flip through.That is why I like it. It looks very similar to something we know but is too abstract to label it as such.
Moebio Labs is a team of data scientists, developers, and designers and they work on projects that tie together large amounts of usable information.
Category Selection
moebio

Wind Map
moebio-2

Creator: Moebio
Website: Moebio.com

Christine Kim – Project-07

sketch

//Christine Kim
//Section A (9:00)
//haewannk@andrew.cmu.edu
//Project-07

var angle;
var X;
var a =300;
var nPoints = 10000;
var g;
var s;

function setup() {
    createCanvas(800,800);
    frameRate(10);
    
}

function draw() {
	background(91,g,221); //background color mapped to give gradient effect as mouse is moved in X directoin
	X=constrain(mouseX,0,width);
	Y=constrain(mouseY,0,height);
	angle = map(X,0,width,0,2*TWO_PI); //remapping the angle to make it move as mouse moves in X direction
	g = map(X,0,width,84,238); //color g mapped for gradient color
	s = map(Y,0,height,1,2); //scale variable mapped to change scale of the curves as mouse is moved in Y direction


	//first Eight Curve
	stroke(255); //color white
	strokeWeight(2);
	push();
	translate(width/2, height/2);
	rotate(angle); //rotating by the mapped angle
	beginShape(LINES); //creating the Eight Curve
	for (var i=0;i<=nPoints; i++) {
		var t= map(i,0,nPoints,0,TWO_PI);
		//Eight Curve formula
		var x2= a*sin(t);
		var y2= a*sin(t)*cos(t);
			vertex(x2,y2);
		}
		endShape(CLOSE);
	pop();

	//second Eight Curve 
	stroke("#ec96a4"); //color light pink
	strokeWeight(2);
	push();
	translate(width/2, height/2);
	scale(s); //scaling by the mapped scale
	rotate(angle+QUARTER_PI);
	beginShape(LINES);
	for (var i=0;i<=nPoints; i++) {
		var t= map(i,0,nPoints,0,TWO_PI);
		var x2= a*sin(t);
		var y2= a*sin(t)*cos(t);
			vertex(x2,y2);
		}
		endShape(CLOSE);
	pop();

	//third Eight Curve
	stroke("#e6df44"); //color mustatd
	push();
	translate(width/2, height/2);
	scale(s);
	rotate(-angle+HALF_PI);
	beginShape(LINES);
	for (var i=0;i<=nPoints; i++) {
		var t= map(i,0,nPoints,0,TWO_PI);
		var x2= a*sin(t);
		var y2= a*sin(t)*cos(t);
			vertex(x2,y2);
		}
		endShape(CLOSE);
	pop();

	//fourth Eight Curve
	stroke("#283655"); //color indigo 
	strokeWeight(2);
	push();
	translate(width/2, height/2);
	rotate(-angle*2);
	beginShape(LINES);
	for (var i=0;i<=nPoints; i++) {
		var t= map(i,0,nPoints,0,TWO_PI);
		var x2= a*sin(t);
		var y2= a*sin(t)*cos(t);
			vertex(x2,y2);
		}
		endShape(CLOSE);
	pop();

	
}

screen-shot-2016-10-14-at-5-22-10-pm

I based my whole project on the Eight Curve and played with color gradient and rotation of the curves.

Looking outwards – 07 – JamesKatungyi

Artist: Moebio Labs

Title: Ross Spiral Curriculum

Year: 2015

Santiago Ortiz’s Moebio Labs developed an interactive data visualization tool for the Ross Institute Curriculum. The tool is a spiral that connects nodes at each stage of the curriculum. Each node contains information about a particular unit in each grade. Further, the units are interconnected across the grades. When one node is selected, it shows the details while the user is flown up and down the spiral to all other related units in the entire curriculum. All 12 grades are creatively captured in one form. I thought the search function would be important to such a tool but could not identify it.

The algorithms are not given – understandably – since it is a commercial venture. The spiral and accompanying ‘spiralets’ are a function of curve equations. I could not figure out how the 3 dimensional interaction works. I imagine that the graphic forms contain links to both the text and the other graphic forms.

The Ross Spiral Curriculum showcases Santiago Ortiz’s work in representing information across time creatively and interactively. Other projects in the works include a presentation of major historical events recorded by Wikipedia.

Grace Cha – Project 07- Curves

myshapes

For this project I worked with the Astroid Radial Curve.  I was really surprised that this function created so many varied curves, and while playing around with it, I had a lot of fun adding values and switching up the boundaries for the equation.

note:  Hover & Click mouse over the Canvas to start *

sketch

//Grace Cha
//Section C
//heajinc
//Project 07: Composition with Curves


var nPoints = 500;// the amount of lines
var boxConstrain = 150; //constrains the small box within an area initially


function setup() {
  createCanvas(500, 500);
  frameRate(15); //make it slow enough to view changes 
  
}

function draw() {
  background(0);

  //call my shape twice
  myShape();

  push();//rotate myShape()
  translate(-30,-350);
  rotate(radians(40));
  myShape();
  pop();
}

function myShape() {
  translate(width/2, height/2);
  stroke(255);
  strokeWeight(.3);//make it thin to visualize the lines better
  noFill();
  //Manipulated to react to mouseX and mouseY location
  var h = constrain(mouseY/10, 0, boxConstrain); //constrain shape 
  var w = constrain(mouseX/10, 0, boxConstrain);//constrain shape 
  
  push();
  beginShape();
  for (var i = 0; i < nPoints; i++) {
    var t = map(i, 0, nPoints, 0,  TWO_PI); 
    
    //Astroid Radial Curve
    //http://mathworld.wolfram.com/AstroidRadialCurve.html
    var x = boxConstrain * pow(cos(t * w),3);
    var y = boxConstrain * pow(sin(t * h),3);
    //stroke(242,183,5)
    stroke("#EEE1EE");
    point(x, y, 10 *i , 10 *i); //adds point at each vertex 
    curveVertex(x , y); //to add curves rather than jagged edges
  }
  endShape();
}
function mousePressed(){
	nPoints = random(5, 360); //number of lines/points 
	boxConstrain = random( 100, 500); //constrains
}