Isabella Hong – Looking Outwards – 07

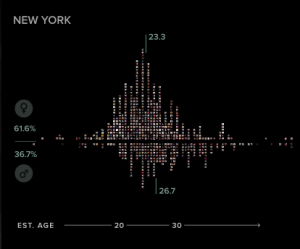
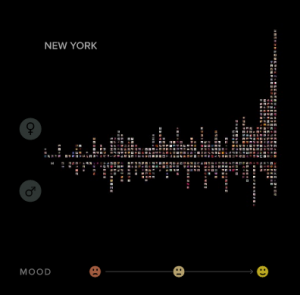
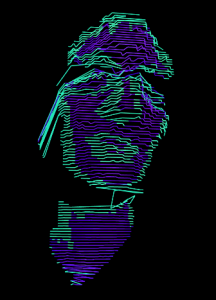
In April of 2016, Stamen, a design company based in San Francisco, collaborated with the Dalai Lama to create the “Atlas of Emotions“. The project visually represents the emotions enjoyment, disgust, anger, fear and sadness as continents and was created in an attempt to guide the emotionally distressed to a state of calm.

Preliminary sketches of emotional exploration.

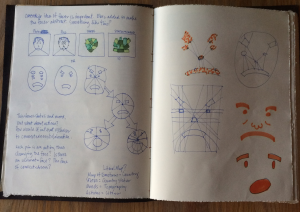
The five emotions were translated into visual continents via extensive sketching and brainstorming. The analogy of continents works such that each emotion also has a set of states which in turn can lead to triggers, actions and then moods. Here is an example of what everything looks like in combination.

"This is an example of a mood, a longer-lasting cousin of the emotion that causes the related emotion to be felt more frequently and intensely. It is not always apparent what triggers a mood."
“This is an example of a mood, a longer-lasting cousin of the emotion that causes the related emotion to be felt more frequently and intensely. It is not always apparent what triggers a mood.”

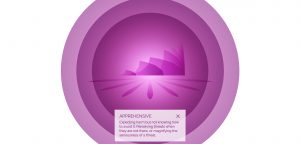
This project integrates the one common link of the human race – emotions. Emotions and their timing are what make us human. The “Atlas of Emotions” stresses the universality of feelings and represents them in an accessible manner. This task is extremely difficult and I admire the fact that Stamen was able to create a tangible representation of a vague concept.

Jess Medenbach – Looking Outwards 7

“Clouds” is an interactive documentary that was made by the interactive film company Scatter. In this documentary, the filmmakers used a depth kit using a kinect to take video footage of their interview subjects. They used a video editing program on top of OpenFrameworks where they had multiple coders take each interview segment and manipulate it in any way they chose.
Rachel Binx took this information and then messed with the data points of the subjects, messing with the mesh of the points as well tweaking the color.
What I think is interesting about this project is that they are attempting to take the form of documentary film and bringing it a step further into VR. They are also making more room for the coders using the footage to express the information in a more artistic way and play within the medium of media and interactive art. http://rachelbinx.com/CLOUDS-Interactive-Documentaryk

Jiyoung Ahn_Looking Outwards_07

windmap
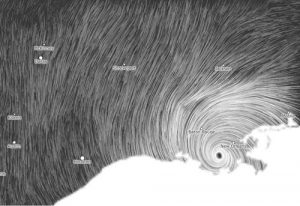
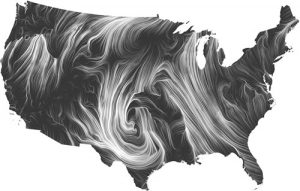
After searching for few websites, one of Martin Wattenberg’s  project ‘Wind map’ really seemed interesting. Wind map shows its current wind movement in United States. I really like the aspect of creating a whole new pattern every seconds by gathering data from the National Digital Forecast Database. These are near-term forecasts, revised once per hour.
wind_isaac_zoom

(Images from Hurricane Isaac (September 2012)

Although this wind map is createdas an art piece, Martin Wattenberg mentioned that it is interesting how this map is used for an actual map. Bird watchers have tracked migration patterns; bicyclists have planned their trips; and conspiracy theorists use it to track mysterious chemicals in the air.

By minimizing the color (white, dark grey), I think the random pattern was emphasized well, and it drives our attention to the movement and makes us to focus on it’s flexible movement.

Wind map is currently available through this link:

http://hint.fm/wind/

%e1%84%89%e1%85%b3%e1%84%8f%e1%85%b3%e1%84%85%e1%85%b5%e1%86%ab%e1%84%89%e1%85%a3%e1%86%ba-2016-10-14-1-47-34-pm

screen shot of the link

and you can see current wind moves and you can see the movement of wind. And also by telling the wind speed through the visual elements and its speed of movement.

Assignment-07-C Epicycloid Evolute-sehenry

Working on this was a bit tricky, but once I understood the concepts and structure behind making these shapes, it became easier. The hardest part for me was using the equations from the website and implementing it into my code. I had to browse through a few posts of other students to get a rough idea of what to do. From the start I wanted to do an epicycloid evolute because it looked really appealing and looked similar to a flower.

epicycloid-evolute-screenshot

sketch

//Seth Henry

//Tuesdays at 10:30

//sehenry@andrew.cmu.edu

//Assignment: Project 7 Composition with Curves (Epicycloid Evolute)


//Global Variables
var nPoints = 400;
var conX;
var scale;
var n=10


function setup() {
    createCanvas(400, 400);
    }


function draw() {
    background(100,50,mouseX); //changes background color based on the mouse position
    fill(mouseX,100,mouseY); //changes the epicycloid color based on the mouse position
    var a = 150.0 //radius a
    var b = 50.0 //radius b
    var angle = map(conX,0,width,0,6*TWO_PI); //rotate around the constraint (conX)
    conX = constrain(mouseX, 0, width); //constrain around mouseX and mouseY
    scaleA = map(conX,0,width,0,3);
    

    push();
    translate(width/2,height/2);
    rotate(angle); //rotate clockwise
    scale(scaleA,scaleA); //change the size of the epicycloid outer portion
    beginShape();

    //Epicycloid Outer
    for (var i=0; i<200; i++){ 
        var theta = map(i,0,nPoints,0, 4*TWO_PI);
        x=(a/(a+2*b))*(a+b)*cos(theta)+b*cos(((a+b)/b)*theta); //xpetal of epicycloid
        y=(a/(a+2*b))*(a+b)*sin(theta)+b*sin(((a+b)/b)*theta); //ypetal of epicycloid
        rect(x-5,y-5,30,30);
    }
    endShape();
    pop();


    push();
    translate(width/2,height/2);
    rotate(-angle); //rotate the opposite way of the outer epicycloid
    beginShape();
    //No Rotate
    //Epicycloid Inner
    for (var i=0; i<200; i++){
        var theta = map(i,0,nPoints,0, 4*TWO_PI); 
        x=(a/(a+2*b))*(a+b)*cos(theta)+b*cos(((a+b)/b)*theta); //xpetal of epicycloid
        y=(a/(a+2*b))*(a+b)*sin(theta)+b*sin(((a+b)/b)*theta); //ypetal of epicycloid
        rect(x-5,y-5,30,30);
    }
    endShape();
    pop();

    push();
    translate(width/2,height/2);
    rotate(angle); //rotate same direction of epicycloid
   
    beginShape(); //The evolute portion of the flower

        for (var i=0; i<200; i++){
        a=100;
        var theta = map(i,0,nPoints,0, 5*TWO_PI);
        var petalX = a * (((n-1)*cos(theta)+cos((n-1)*theta))/n) //Xpetal of evolute
        var petalY = a * (((n-1)*sin(theta)+sin((n-1)*theta))/n) //ypetal of evolute
       rect(petalX-5,petalY-5,30,30); //draws the inside petals  
}
    endShape();
    pop();


}


Jess Medenbach – Curves

playing with curves and minimalist shapes and colors

jmmedenb-07c

var points = 600;

function setup() {
  createCanvas(600, 400);
  frameRate(30);
  
}

function draw() {
    background(250);

    push();
    translate(width/2, 0);
    drawCurve();
    pop();
}

function drawCurve(){
  //http://mathworld.wolfram.com/Bicorn.html
    var g = map(mouseX, 0, width, 0, width/2);
    var y;
    var a = map(sq(mouseY), 0, height, 0, 1);

    beginShape();
    for (var i = 0; i < points; i++) {
        var t = map(i, 0, points, 0, radians(360))
        x = g * sin(t);
        y = (a * cos(t) * cos(t) * (5 + cos(t))) / (5 + sin(t) * sin(t));

        fill(255);
        ellipse(x,y,mouseY, mouseY);

        fill(255,0,0);
        triangle(x,y,x/300,mouseY,x/2,mouseY*2);

    }
    endShape(CLOSE);
}


Project 7: Curves

sketch

/*Emma Shi
Section B
eyshi@andrew.cmu.edu
Project 7
*/

var nPoints = 100;
var theta = 30.0;
var rcolor = "red";

function setup() {
    createCanvas(400, 400);
    frameRate(10);
}

function draw() {
  background (random(0, 255));
  frameRate(10);

  push();
  for (var i = 0; i < 40; i++) {
    translate (width/2,height/2);
    rotate(radians(theta*mouseX));//rotates "images"
    drawRorschachCurve(i);
  }
  pop();
}


function drawRorschachCurve () {
  var a = map(mouseX, 0, width, 0, 50);
  var b = map(mouseY, 0, height, 0, 50);

  fill(rcolor);
  noStroke();
  beginShape()
  for (var i = 0; i < nPoints; i++ ) {
    var t= map(i, 0, nPoints, 0, TWO_PI);
    x = a*sin(t)*sin(6*t)*sin(t);
    y = b*cos(t)-a*cos(7*t);

    vertex(-x,-y);
  }
  endShape(CLOSE);
  //draws "Rorscharch image"
}

function mousePressed() {
  if (rcolor == "red") {
    rcolor = "pink";
  } else {
    rcolor = "red";//changes color to pink with mouse clicks
    }
  }

I initially made a heart curve and create a simple, dynamic image that enlarges the heart (widen/lengthen) and rotates the heart in response to the mouse’s movement. However, after playing around with the image, it turned into something completely different. The “heart” now resembles an image from a Rorschach test.

You can also click the mouse to change the object colors from red to pink. The background color changes automatically on the grayscale with every refresh of the frame.

Janet Lee-Project 07-Curves

sketch

//Janet Lee
//Section C
//janetl2@andrew.cmu.edu
//Project 07


var points = 70;
function setup() {
    createCanvas(400, 400);
    strokeWeight(2);
    //stroke("#F1CDD4");//baby pink
    frameRate (30);


}

function draw() {
  background ("#CDE7EE");//baby blue

  push();
  translate (width/2,height/2);
  drawHeart();
  pop();


function drawHeart () {
  var a = map(mouseX,0,width,25,75);
  var b = map(mouseY,0,height,0,100);
//heart becomes bigger and wider

  beginShape()
  //base shape: heart
  for (var i = 0; i < points; i ++ ) {
    var t= map(i,0,points,0,70);//hearts made out of lines
    x = a* sin(t)*sin(t)*sin(t);
    y = b*cos(t)-a*cos(2*t)-2*cos(b*t)-cos(a*t);

    fill("#F1CDD4");//baby pink
    strokeWeight(2);
    vertex(-x,-y);//make the heart upright
  }
  endShape(CLOSE);
}
}

heartcurves_801

Denise Jiang- Project 07

sketch

var nPoints=300;

function setup() {
    createCanvas(500,500);
}

function draw() {
	background(157,129,137);
	drawLeaf();
	drawPeach();
	drawPedal();
}

function drawPeach(){
	var xa;
	var ya;
	var v;
	fill(255,202,212);
	noStroke();
	push();
	translate(width/2, height/2-40);
	beginShape();
	var a;
	var b=map(mouseY, 0,height, 250,255);
	for (var i=0; i<nPoints; i++){
		var t=map(i,0, nPoints, 0, TWO_PI);
		xa=a*((v-1)*cos(t)+cos((v-1)*t))/v;
		ya=a*((v-1)*sin(t)+sin((v-1)*t))/v;
		a=constrain(b,250,255);
		v=3;
		vertex(ya,xa);
	}
	endShape();
	pop();
}

function drawPedal(){
	var xp;
	var yp;
	noFill();
	stroke(255,229,217);
	strokeWeight(5);
	push();
	translate(width/2, height/2+30);
	var m=map(mouseX, 0, height, 0, 5);
	var n=constrain(m,0,5);
	beginShape();
	for (var i=0; i<nPoints; i++){
		var t=map(i,0, nPoints, 0, TWO_PI);
		xp=10*(n+2)*(cos(t)-cos((n+1)*t));
		yp=10*(n+2)*(sin(t)-sin((n+1)*t));
		vertex(xp,yp);
	}
	endShape();
	pop();
}

function drawLeaf(){
	var c=map(mouseY, 0, height, 0, 5);
	fill(215,226,220);
	noStroke();
	push();
	translate(width/2, height/2);
	rotate(radians(50));
	ellipse(-100,-140, 50+c, 145+c);
	pop();
}

I used two different pedal curves in this project. One of them I managed to use MouseX to control the n number of the pedals, while the other one I set the n number to 3 to create the two-pedal peach shape. Moving the mouse from left to right will increase the number of pedals from 0 to 5. MouseY controls the size of the peach.

Andrew Wang – Project 07

sketch

//Andrew Wang

function setup() {
    createCanvas(400, 400);
    fill(240,210,210);
}

function draw() {
    background(130);
    push();
    translate(width/2, height/2);
    //maps mouse between 0- 150 (0-75 for inner) and rotates grid by 30 degrees
    x = map(mouseX, 0, width, 0, 150);
    y = map(mouseY, 0, height, 0, 150);
    rotate(radians(30));
    cruciform(x,y);
    x = map(mouseX, 0, width,150,0);
    y = map(mouseY, 0, height, 150, 0);
    rotate(radians(30));
    cruciform(x,y)
    x = map(mouseX, 0, width, 75,0);
    y = map(mouseY, 0, height, 75,0);
    rotate(radians(30));
    cruciform(y,x);
    x = map(mouseX, 0, width, 0, 150);
    y = map(mouseY, 0, height, 0, 150);
    rotate(radians(30));
    cruciform(x,y);
    x = map(mouseX, 0, width,150,0);
    y = map(mouseY, 0, height, 150, 0);
    rotate(radians(30));
    cruciform(x,y)
    pop();
}

function cruciform(a,b){
    beginShape();
    noStroke();
    for (var n = 0; n < 100; n++) {
        //change to degrees
        var t = map(n, 0, 100, 0, 2*PI)
        //parametric equation of cruciform
        x = a*(1/cos(t));
        y = b*(1/sin(t));
        //draws circles of size 3-6
        ellipse(x, y, map(mouseY, 0, height, 3, 6), 
                      map(mouseY, 0, height, 3, 6));
    }
    endShape(CLOSE);
}

I used the cruciform curve from mathworld for my project. Initially having only put down one curve, it looked a bit lackluster so I created a smaller version to sit inside of the larger one. This was a little better, however, it still looked a little bit barren at certain mouse positions so I decided to try rotations.

v1

I realized that if I wanted to rotate, I would have to make four outer cruciform curves to fill each of the corners. I made the one in the middle upright and curved the others.

v2

for this curve, the two equations that I used were x = a*1/cos(t) and y= a*1/sin(t). I plotted points along the curve instead of drawing the lines since it looked a little bit strange with the lines as there were lots of intersections.

Sihand – LookingOutwards 07 – Selfiecity

Selfiecity by Manovich

The millennial generation (that’s me!) is notorious for our signature narcissism: selfie-taking. While most people couldn’t bear with them, software researcher Dr. Lev Manovich are particularly interested in the styles of selfies across cities around the world. Dr. Manovich utilized what he calls “imageplots”, which are rich media visualization, to present the patterns he found in selfie-taking. In each imageplot, a distribution pattern is shown on the habits of selfie-takers’ poses, expressions, and more.

To better demonstrate the imageplots Dr. Manovich used, here are two examples of selfie patterns in New York City.

Gender and age profile of selfie-takers in NYC
Smile distribution of selfies in NYC by gender

There isn’t much information on what algorithm is behind these imageplots. My best guess would be a recognition algorithm that gathers data on quantitative selfie-taking habits such as the head tilt angle and the distance from face.

Learn more about Selfiecity

Learn more about Manovich