Final Project Proposal

My initial idea for my final project stemmed from my interest to explore synesthesia between music and color. I have perfect pitch and although I’m not sure if my synesthesia stems from this, I have a specific color associated with every note. I don’t specifically “see colors” when I listen to music, but I think it would be really cool to visualize what this would like, since I think there are some patterns between combination of notes and color (i.e. in chords).

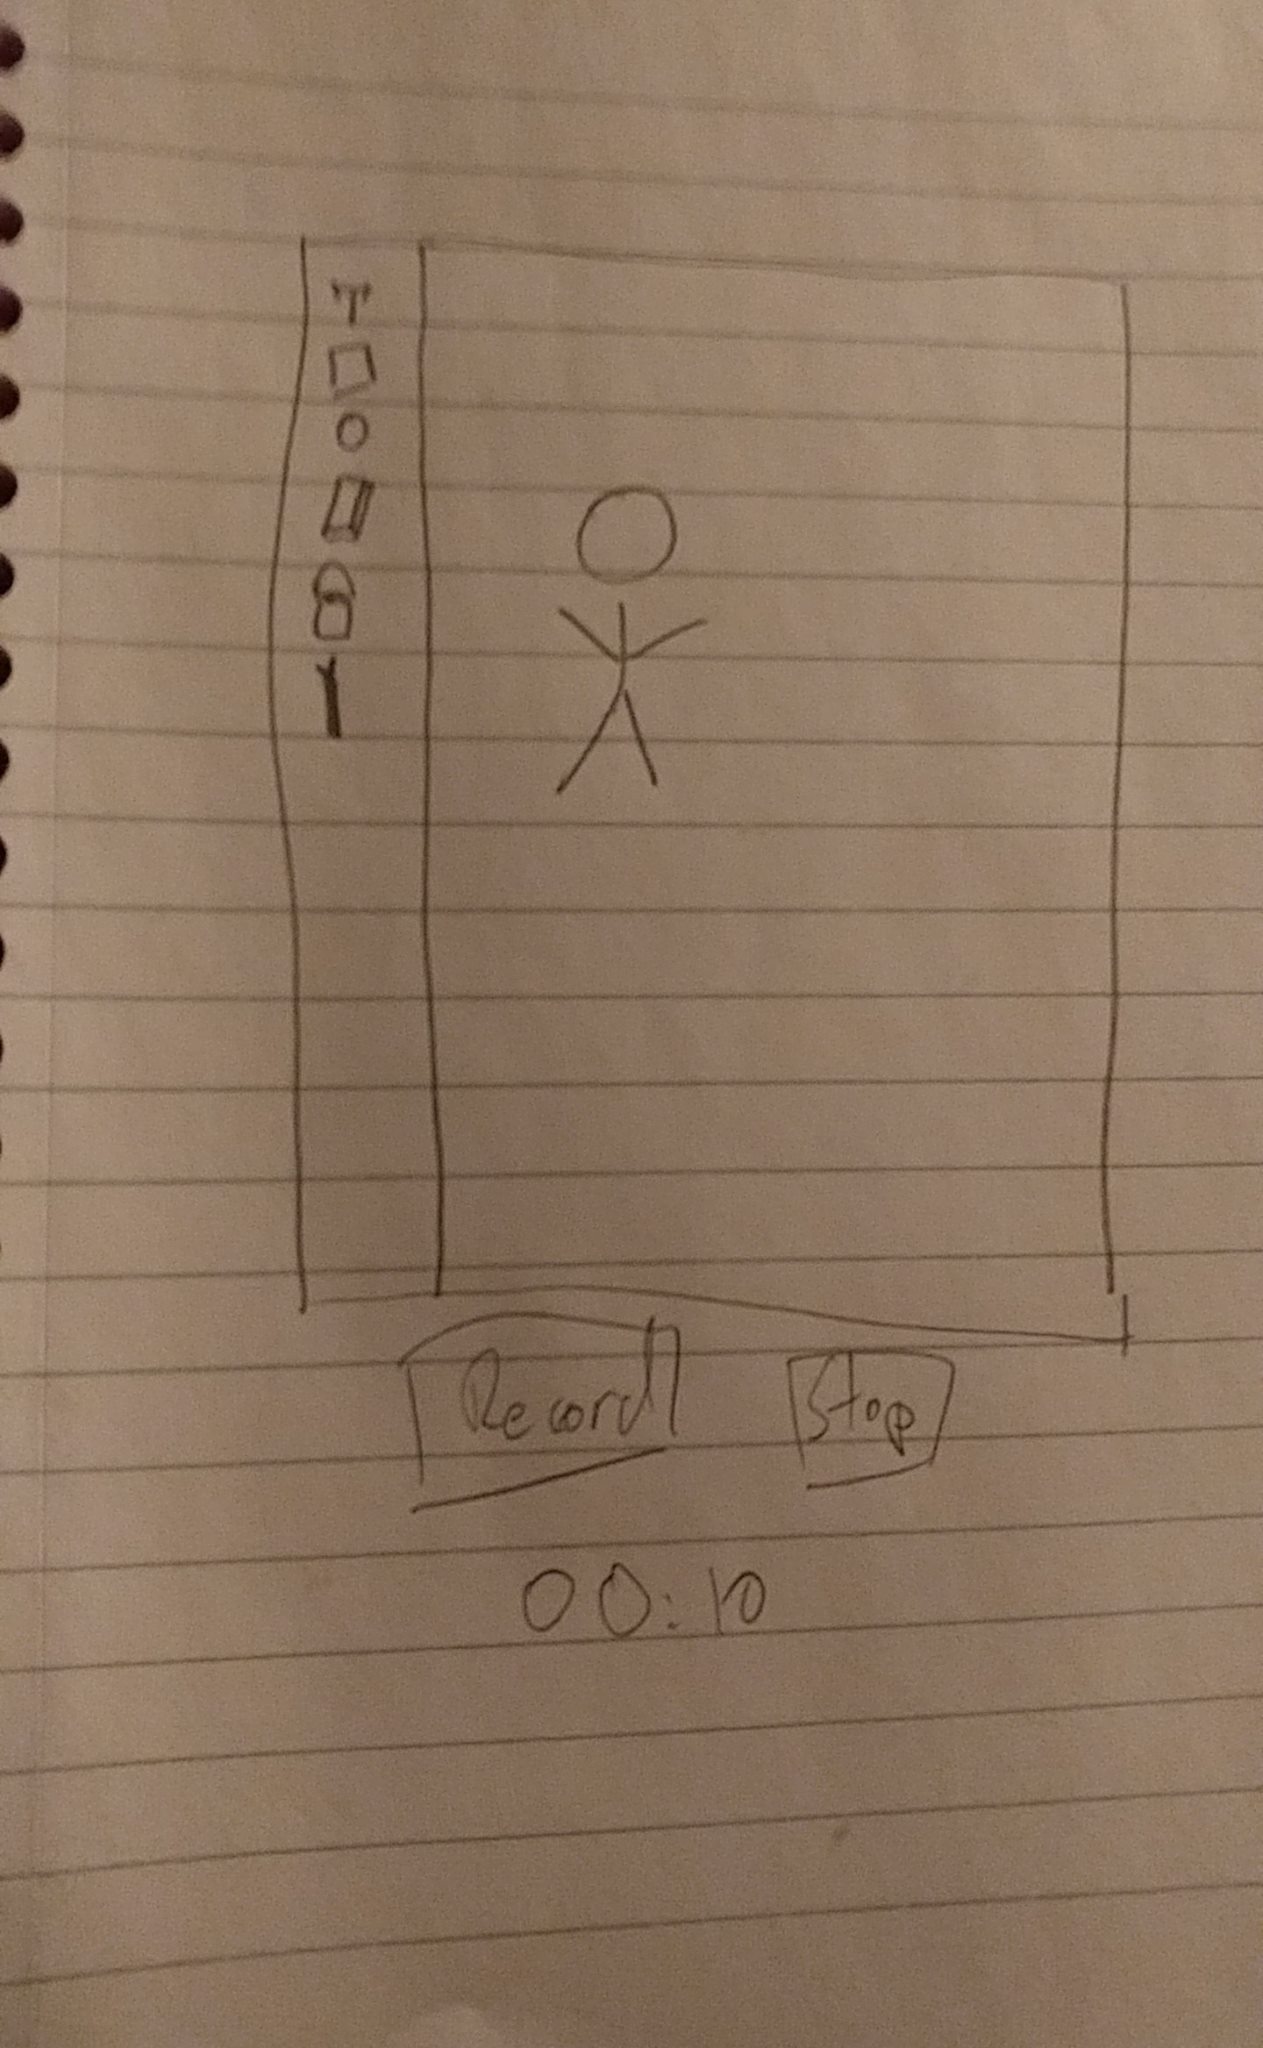
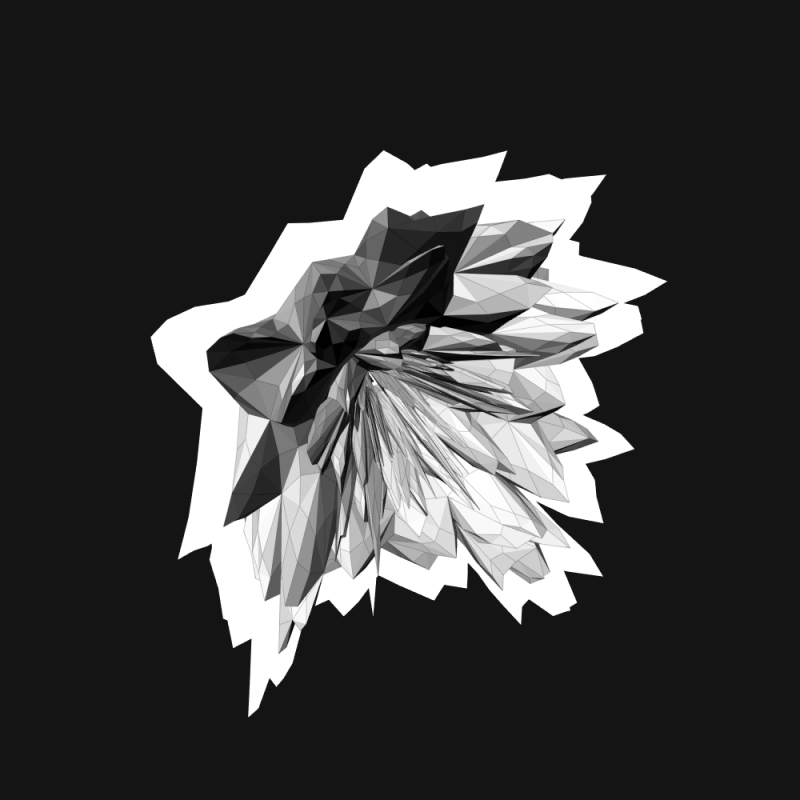
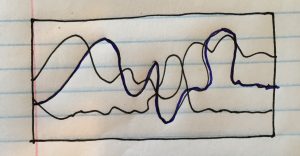
In order to explore this visualization, I want to create a “music video” (i.e. through some sort of generative landscape) that uses line forms to represent the different melodies in a song. I’m thinking about doing a video to Mirror Maru by Cashmere Cat or Kusanagi by Odesza and will probably use Audacity to shorten it since a four-minute song might be a lot of work. The lines will go higher in the canvas with a higher note, and lower in the canvas with a lower note. Each line will represent a different notes in real-time and will change color according to my own note color scheme.

finalprojectproposal12
A very basic example of what the line forms could look like. Unfortunately, I did not have other colors at the time…

I’m also thinking about incorporating shapes as well, but for now I will stick to line forms. I am also open to suggestions for improvement, so feel free to let me know if you have any!

Looking Outwards 12: Sound Calligraphy/Lyrical Wrap

For the final Looking Outwards post, I decided to compare the projects of artists Ulla Rauter‘s “Sound Calligraphy” and Ronald Pellegrino‘s “Lyrical Wrap.”

Ulla Rauter is a artist and musician whose works focus on the intersection of fine art and sound. Rauter’s “Sound Calligraphy” explores the relationship between script and sound. In a live performance, Rauter draws calligraphic forms, which is then translated into sound through a scanner that employs camera and computer technology; in other words, she is essentially exploring how to draw/write sound. It appears that she attempts to draw certain words (i.e. “somebody”) as shown by the words on the upper right-hand corner, but I am unsure how they correlate to the line marks she makes in her calligraphy. Before watching the performance video, I expected her to write words on the scanner and have them translate into sound.

Sound Calligraphy from Ulla Rauter on Vimeo.

Ronald Pellegrino is an artist that has been involved in intersecting sound and light through electronic art since its inception. His work “Lyrical Wrap” combines five decades of his work in electronic arts into a piece that pairs sound with abstract grids, lines, and various shapes that constantly change. I kind of like how the piece gives off a mysterious air, mostly due to the eerie sounds and accompanying holographic visuals. It makes the viewer feel like they are in some kind of weird dream. Pellegrino has a variety of similar videos, which can all be accessed through his Vimeo channel.

Lyrical Wrap from Ronald Pellegrino on Vimeo.

Andrew Wang – Final Proposal

I will be trying to implement a drawing application that simulates Microsoft Paint. There will be functionalities to allow for erasing, box draw, circle/sphere draw, text input, and changing specific font, color, and weight settings. I will also be implementing the ability to capture and save the image that is drawn. If time allows, I was also thinking about adding the ability to hit start, stop, and record a video of the drawing sequence.

To create this I’m planning on drawing white over the canvas for erase, box, circle/sphere, and text input can be handled using the p5.js framework along with screen-capture. I was thinking about having the video function be created by taking constant screen-captures and and at the end calling some library to help create a gif out of the pictures. I’m not sure if p5.js handles this capability, but I’m sure a lot of libraries exist out there to help with this type of issue.

Example wireframe:

15126229_1230378076985392_1080101886_o

Final Project Proposal

For my final project I would like to make an animation of a robot planting a plant, and then sitting and watching it grow through all kinds of weather. Below I have included some sketches of what I hope to create.

img_6310

img_6311

img_6313

The robot would also change depending on the weather, for instance if it rained it would have an umbrella, or if it snowed it would have a scarf. The weather would cycle through several times while the tree continued to grow, and the robot would just sit there and watch it. It’s eyes would also progressively follow the tree’s height.

Looking Outwards-12

This week I looked at Glenn Marshall’s work called Statue, which displays a dramatic look at the Statue of Liberty being crucified. I also looked at the Hyphae Zoetrope on Nervous System, which is an animation of a plant-like figure growing.

I find these both interesting because they each have a component of the animation that I aim to make. I admire the growing branch-like look to the hyphae zoetrope, and I admire the design and camera work of the Statue project. They are different in their content, but share the 3D aspect to their projects.The meaning behind the works also appear to differ as Statue appeared largely political, while the Hyphae Zoetrope was more intricate and appeared to be designed for aesthetic purposes.

Statue was created on November 9, 2016, while the Hyphae Zoetrope was created in 2014.

A link can be found here for the statue project, while a link can be found here for the Hyphae Zoetrope. The video of the Statue project can also be found below.


Looking Outwards 12 – Simin Li

I chose two projects as reference for my final project.

Extinct by Joe Cutting

Extinct is an educational game that allows players to plant either a wild plant or a farm crop by Joe Cutting. The goal of the game is to grow as many seeds as possible through deciding how much water, minerals and sunlight to distribute to growing different parts of the plant. The more seeds you get, the higher your survival rate. The game is interesting in that you have control over your plant and it makes use of scientific knowledge that gives the player something more to take away from the game. Something I wish Cutting did better is that the window is too small for the plant. When the plant gets really tall it goes out of view. The slider bars are also a bit too long.

fake flower by W:Mute
121 Fake Flowers by W:Mute

121 Fake Flowers by W:Mute is a series of 121 computer generated flowers. The artist uses processing to make the flowers and they are all in black and white. What is interesting about the project is that all the flowers have a crystal like structure. Unlike the first project, this is only a simulator of flowers. I thought this project was worth investigating because it could help me generate the leaves and fruit in my game. Is seems that this project has differentiated the petals and the pistils. When I generate my plant I should generate stems and leaves individually. If this project could include more variability, it would be even more interesting.

Links:

About

Joe Cutting

Play Extinct

James Katungyi – Project 12 Proposal

GRAPHICAL REPRESENTATION OF COMFORT AGAINST TEMPERATURE VARIATION ACROSS THE YEAR

How can climate data be packaged to make a visual impact, for example, in determining when to use air conditioning in a building? In this project, I propose to represent temperature variations by the hour for each month of the year for a location. At a glance, a comparison of average temperatures at a given hour of each month will be comparable. This will be an example of climate data representation limited to temperature variations and comfort. Other templates could be made for relative humidity and comfort and so on.

The temperature variations will be set against a background that is calibrated from extreme hot (red) to extreme cold (blue). A horizontal band in the middle of the platform will mark the range of temperatures where comfort is possible.

The coloured image below shows an attempt to project this information by excel in my earlier research work. It is a static image that requires elaborate explanation. I intend for the project to improve of the presentation technique.

I propose to use 12 bar objects with a functions that relate their height to a temperature. I hope to be able to link the temperature data into the file without time consuming retyping – this is one area that I am not yet sure about.

projectsketch


James Katungyi – Looking outwards 12

I chose two projects that make data accessible to the non-technical minded. One, the most interesting, is Nathan Yau’s ‘A day in the life of Americans‘. In it, he uses dots to simulate how each of 1000 Americans occupy themselves within a 24 hour period. The source data is based on 2014 American Time Use Survey, made accessible by ATUS Extract Builder. The project represents each person as a dot whose color is determined by the activity of the moment. Dots of the same color congregate to the same spot on a circular clock-like canvas with activities located around it. Each activity records the percentage of dots at the location. The dots are in constant motion; they become frantic in rush hour then settle into work or sleep depending on the time of day.

nathanyausketch

nathanyaufinal

The second one is Ekene Ijeoma’s ‘The Refuge Project‘. It is an animated world map that shows the country of origin of refuges for each year from 1975 – 2015.  At the earliest, the project was done in 2015. The circular illustrations are scaled to represent the number of refugees. At a glance, one is able to tell where the largest number of refugees came from for a given year. When the mouse is positioned at the circle of origin, the destinations of the refugees are shown by arrows and numbers. A side screen narrates key events contributing to the largest refugee numbers for each year.

ijeomamapinteractivity

ijeoma2015

I admire the two projects because they turn numbers into intriguing representations that are easily apprehended. One of the challenges of our times is how to make meaningful use of the enormous quantities of data that is available. Making the data easily apprehended is an important step in analyzing and using the data.

As to the algorithms, Nathan’s work suggests that each circle is an object that stores properties and functions which change its color and drive its movement across the screen. Even though Ekene’s work is static for each year, it also probably relies on an array of objects with properties and functions. The map at the back is also interactive because it is linked to the circles.

For my project, I wish to make a platform that graphically presents a location’s climate data – one unlike the common weather apps. The two projects inspired this idea which I also hope to use in later work.

Michal Luria – Looking Outwards – 12

This week I will present two different projects that present famous media (movies and books) in an unexpected way that reveals new and fascinating aspects of the well know work.

TextArc / Bradford Paley

The project of TextArc takes famous books and analyzes their text and content, presenting them a new and interactive way:

TextArc, presenting a whole book in a visual, interactive way. Source.

All the sentences in the book are presented clockwise, and in the middle the words most frequently used are presented. Furthermore, each word is located in the area it is mentioned the most, for example “Queen is near the end of the book”. When the user hovers a specific word, they can see in what parts of the book this word is used:

TextArc: view in what parts of the book a word is used. In this example – “Alice”. Source.

Photographs of Films / Jason Shulman

In this project, the artist condensed whole well known classic films into a single frame. Shulman used an algorithm to create the mood and style of the film in a single frame:

fantasia
Fantasia in “Photographs of Films”, presenting the whole movie in a single frame. Source
the-wizard-of-oz
The Wizard of Oz in “Photographs of Films”, presenting the whole movie in a single frame. Source

In both projects, famous media are taken and presented in a new way that shows aspects that were hidden before, allowing others to look at a piece from a different point of view.

The projects differ in the medium they use – TextArc uses text, as opposed to visual compositions in the films project. Furthermore, TextArc is an interactive program that encourages the user to look into the text, explore, look what words are used and where, etc. The second project, although not interactive, has an advantage of creating a mood that represents a full length movie just by looking at a still image. This resembles more of a work of art, rather than interactive text presentation.

As my final project suggestion is looking at plays from different eras in a new way by visualizing structure aspects, I think both of these projects can inspire my work. I can look at what aspects of the work are presented and what are some ways in which they can be computed and visualized.

mreyes-Project Proposal – chat bot

In another class I am making a suriel virtual pet type game using the p5.play library. What I am currently working on is for the “pet” to have needs witch you have to cater to and the pet responds depending on how you interact with it (such as getting board, and a button to click that allows you to play with it). I would like to expand on this current project by allowing the player to talk to the pet and based on the sound levels in the player’s voice the pet will respond in a diffrent way. Additionally I would like to have a sound/ vocab bank of things the pet can say witch progressively gets more sophisticated the more you talk to it (similar to a furby).

I have only ever tested the mic function using the P5 text editor. It might not be able to work using sublime or index even when the terminal is edited. This means it would require the person grading it to download the P5 text editor and play with it that way.

Here is what the program currently looks like. I will try to post the code itself once it is more refined.

screen-shot-2016-11-17-at-4-04-09-pm