hyt-Project-07: Infinity Curve Composition

hyt-07-project

// helen tsui
// 15-104 section d
// hyt@andrew.cmu.edu
// project-07-composition-waves


function setup() {
    createCanvas(480, 480);
    background(44, 66, 81, 100);
}


function draw() {
    drawcochleoid();

}

function drawcochleoid() {
    // Eight Curve
    map(mouseX, 0, width, 0, 200);
    beginShape();
    //stroke(209, 104, 104); //red
    stroke(100 + mouseX / 2.5);
    strokeWeight(0.5);
    //fill(204 - i * 2, 46, 32);
    fill(0);
    //infinity
    translate(width / 2, height / 2);
    for(var i = 0; i < mouseX / 2; i += 0.5) {
        var a = 1.9 * i; 
        var t = 6 * i;
        var x1 = a * sin(t);
        var y1 = a * sin(t) * cos(t);
        var y2 = a * sin(t);
        var x2 = a * sin(t) * cos(t);
        vertex(x1, y1);
    }
    endShape();

    // vertical shape
    beginShape();
    for(var i = 0; i < mouseX / 2; i += 0.5) {
    var a = 0.9 * i; 
    var t = 12 * i;
    var y2 = a * sin(t);
    var x2 = a * sin(t) * cos(t);
    vertex(x2, y2);
    }
    endShape();
}


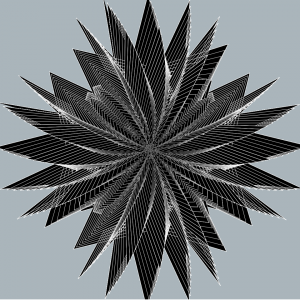
For this project, I browsed on the internet in search for parametric equations that could be embedded within the code, and after some search found the “infinite loop” sign that I was able to use. To create some dimensionality, I altered the color values in order to change the greyscale. Also, for the background part I happened to change values and created a similar “noise effect” as the background.

I also experimented with different proportions that led to different results, such as this one. If I had more time I wish to play with the details more to achieve a better landscape-like picture.
hyt-Looking-Outward-07: Data Visualization

When I was searching for the project, I was intrigued by Project Ukko, a seasonal wind and weather visualizing web application developed by Truth and Beauty Operations. It is a elegant-looking interfaces that utilizes dashed lines and colors to reflect a thematic map with wind prediction  data around the world. Particularly, the categories of quantitative data are visualized through attributes such as opacity, line’s thickness, angle, and color hues. And on the side panels, you would also have access to the more detailed analytic data for further reference. The final results were produced through d3.js, coffeescript, pixi.js. I think this link is also helpful in terms of understanding the designer’s process of having the creative solution: http://truth-and-beauty.net/projects/ukko.

hyt-Project-06: Clock Works

hyt-06-project

// helen tsui
// 15-104 section d
// hyt@andrew.cmu.edu
// project-06-clock


function setup() {
    createCanvas(480, 300);
    angleMode(DEGREES);
}


function draw() {

    // current time
    var H = hour();
    var M = minute();
    var S = second();
    
    // color palette
    var transparency = 170; // alpha value
    var red = color(255, 0, 0, 170);
    var orange = color(255, 100, 0, 170);
    var green = color(7, 150, 70, 170);
    var yellow = color(255, 250, 55, transparency);
    var blue = color(0, 155, 250, 170);
    var purple = color(142, 78, 201, 170);

    // draw rainbows
    var hDiff = 30;// height difference each time
    var initialHL = 190; // initial height on the left
    var initialHR = 20; // initial height on the right

    background(200 - H, 255 - M * 0.5, 210 - S * 0.7); // bg color randomizes as time goes by

    
    //red
    strokeWeight(25); // line thickness
    stroke(red);
    line(0, initialHL, width, initialHR);
    //orange
    stroke(orange);
    line(0, initialHL + hDiff, width, initialHR + hDiff);
    //green
    stroke(green);
    line(0, initialHL + hDiff * 2, width, initialHR + hDiff * 2);
    //blue
    stroke(blue);
    line(0, initialHL + hDiff * 3, width, initialHR + hDiff * 3);
    //purple
    stroke(purple);
    line(0, initialHL + hDiff * 4, width, initialHR + hDiff * 4);

//----------------------------


    // HOURS dots
    for (var dotH = 1; dotH <= 24; dotH++) {
        noStroke();
        fill(yellow); 
        rect(20 * H, initialHL + 30 - 7.1 * H, 3, 3); 
        // pacman shape
        noStroke();
        fill(yellow);
        var angle1 = 20; 
        var angle2 = 310;
        arc(20 * H - 20, initialHL + 40 - 7.1 * H, 20, 20, angle1, angle2);
    }


    // MINUTES dots
    for (var dotM = 1; dotM <= 60; dotM++) {
        noStroke();
        fill(yellow);
        rect(7.9 * M, initialHL + 60 - 2.8 * M, 3, 3); 
        // pacman shape
        noStroke();
        fill(yellow);
        var angle1 = 20; 
        var angle2 = 310;
        arc(7.9 * M - 20, initialHL + 70 - 2.8 * M, 20, 20, angle1, angle2);
    }


    // SECONDS dots
    for (var dotS = 1; dotS <= 60; dotS++) {
        noStroke();
        fill(yellow);
        rect(7.9 * S, initialHL + 90 - 2.8 * S, 3, 3); 
        // pacman shape
        var angle1 = 20; 
        var angle2 = 310;
        arc(7.9 * S - 20, initialHL + 100 - 2.8 * S, 20, 20, angle1, angle2);
    }


    // clock time shown on the left top side
    fill(0, 100);
    rotate(-20);
    textFont("Courier New", [60]);
    time = H + ":" + M + ":" + S; 
    text(time, -10, 163); 

}


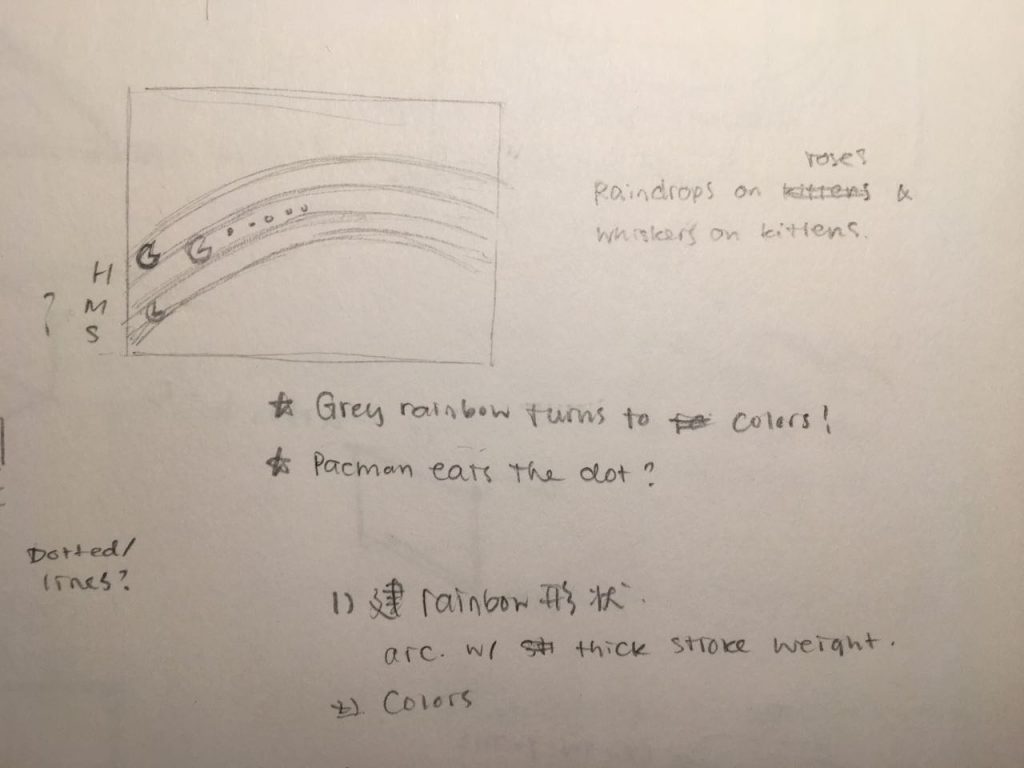
For this project, I had several ideas in mind, and somehow thought of the viral Nyan cats looped video on Youtube. Inspired by that, I decided to make a rainbow background with each Pacman moving as a way of representing the clock’s hour, minute, and seconds.

(A really rough sketch for ideation phase)

However, later I realized the extreme difficulty of drawing an arc movement for the Pacman, and resorted to a simpler version of straight lines of rainbow. Some of the variations within the projects are play with colors, transparency, movements and the background color gradient throughout time. I like how the final results turned out, and also enjoyed the process of making.

hyt-Looking-Outwards-06: Randomness


For this week’s topic, I came across a multidisciplinary performance piece by Claire Bardainne and Adrien Mondot, “The Movement of air”. The piece was mesmerizing to watch as elements of acrobatic dancing movements, algorithmic stage design, and live music performance come together with the perfect rhythm and movement, eventually capturing the invisible movement of air using the tangible visuals and sounds.

It is interesting to learn about the duo artists’ work of progress and mechanism behind the final result. Particularly, the stage visuals are in fact projected and controlled by both human interventions and reactive data censors reinterpreting the three dancers’ location. Therefore, the factor of “randomness” is in some way controlled and “biased”, yet still spontaneous. That being said, each performance is real-time and never repetitive; while having an agenda, it concurrently allows the dancers to move freely in alignment with the digital projections, deconstructing the three-walled cube space.

However, it was disappointing that the artists disclose more information on how the set of algorithms is constructed, other than the fact that it was created with the software Millumin 2 (after ten years of using their custom made software eMotion). It seems that the speed and direction of the dancers are all detected by the sensor, then translated into those geometric patterns such as circling lines and pieces.

hyt-Project-05: Wallpaper Drawing

hyt-05-project

// helen tsui
// 15-104 section d
// hyt@andrew.cmu.edu
// project-03-dynamic-drawing


//var x1; // wave left coordinate;
//var x2 = 30; // wave right coordinate

var angleL = -160;
var angleR = -20;
var span = 40;
var wx; // waveX;
var wy; // waveY;
var r = 245; 
var g = 245;
var b = 230;


function setup() {
  createCanvas(400, 400);
  angleMode(DEGREES);
  background(24, 42, 81);
}

// a wallpaper of small fishes swimming down the ocean
function draw() {

    for(var wy = 0; wy < 30; wy ++) { // wave y coordinate increment
            
            for (var wx = 0; wx <= 10; wx++) { // wave x coordinate increment
            
            if (wy % 2 == 0) {
                noFill();
                strokeWeight(1.8);
                stroke(r, g, b);
                arc(15 + wx * span, 25 + wy * 30, 40, 40, angleL, angleR); // first wave
                strokeWeight(1.5);
                stroke(r, g, b - 30);
                arc(18 + wx * span, 30 + wy * 30, 40, 30, angleL + 15, angleR - 10); 
                strokeWeight(1);
                stroke(r, g, b - 60);
                arc(4 + wx * span, 35 + wy * 30, 40, 30, angleL + 5, angleR - 20); 
                strokeWeight(0.8);
                stroke(r, g, b - 90);
                arc(20 + wx * span, 42 + wy * 30, 40, 30, angleL - 5, angleR - 0); 
            }

            if (wy % 2 == 1) {
                noFill();
                strokeWeight(1.8);
                arc(30 + wx * span, 25 + wy * 30, 40, 40, angleL, angleR); // first wave
                strokeWeight(1.5);
                arc(33 + wx * span, 30 + wy * 30, 40, 30, angleL + 15, angleR - 10); 
                strokeWeight(1);
                arc(19 + wx * span, 35 + wy * 30, 40, 30, angleL + 5, angleR - 20); 
                strokeWeight(0.8);
                arc(35 + wx * span, 40 + wy * 30, 40, 30, angleL - 5, angleR); 
            }
        }
        }
    noLoop();
    }


For this project, I started out searching through the wallpaper links provided by the instructions, and i became intrigued by one of the Japanese wave-like prints (which is often used for clothing and paper prints). Inspired by that, I sketched some images down, hoping to create a similar pattern with a bit more dimensionality. For the end result, the most challenging parts were the wave movements created by crossing arc functions, as well as the gradient color choices which took me a while to figure out.

hyt-Looking-Outward-05: Nature and Algorithm

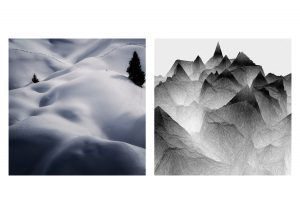
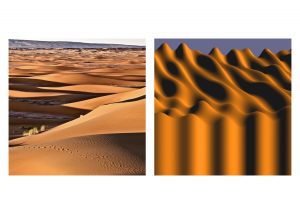
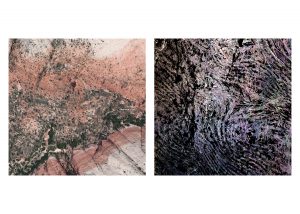
“Nature and Algorithm” is a 100-day consecutive project created by a multidisciplinary artist and programmer Liu Chang. Throughout the 100 days, she collected textural landscape photos and transformed them into dimensional, abstract productions through an algorithm she developed independently.

Day 035
Day 048
Day 012

What was drawn to me the most was her consistency with her choice of medium, as well as her juxtaposition between the original landscape images and computer-generated “landscapes” — the latter one especially intriguing, since the transformation was applied with similar color tone, shadows, and even pattern, but the image is no longer the same, and only functions as a representation of the image. I was also curious about why the artist describes the project as “a question to the relationship between nature and AI.” Unfortunately, she did not mention the softwares and algorithms used for this project, but relating to this comment, I think she is inquiring for a line between authenticity and artificiality, and how how we can incorporate learned AI into reality but still different from reality.

You could view more of her 100-day work here: http://www.liuchang.work/#/natureandalgorithm/

hyt-Project-04: Dynamic Drawing

hyt-04-project

// helen tsui
// 15-104 section d
// hyt@andrew.cmu.edu
// project-03-dynamic-drawing


var angle = 0; // line rotating angle

function setup() {
  createCanvas(400, 300);
  background(0, 0, 0);
//  angleMode(DEGREES);

}


function draw() {

// left side gradient lines
    var x1 = 0; 
    var y1 = 0; 

    push();
    for (var i = 0; i < 200; i++) {
        translate(mouseX, 0);
        map(mouseX, 0, width, 100, 250);
        stroke(150, 201 - i * 2, 202);
        strokeWeight(1);
        x1 += 5;
        y1 += 5;
        line(x1, y1, x1 + i * 7, y1);
    }
    pop();

// left bottom "shadow" on the highlight
    var x2 = 0; 
    var y2 = 0;
    push();
    for (var i = 0; i < 200; i++) {
        //rotate(radians(x2 *3));
        stroke(150 + i * 2, 189, 226);
        x2 -= 5; 
        y2 += 5; 
        line(x1, y1, 0, y2);
    }
    pop();

// left top corner
    var x3 = 20; 
    var y3 = height / 2; 
    for (var i = 0; i < 50; i++) {
        stroke(125, 206, 160 +i * 10);
        line(x3, 0, 0, y3);
        x3 += 10;
        y3 -= 10;
    }

// right top corner
    var x4 = width / 2; 
    var y4 = height / 2; 
    for (var i = 0; i < 50; i++) {
        stroke(246, 221, 204 + i *4);
        line(x4, 0, width, y4);
        x4 -= 10; 
        y4 -= 10;
    }

// spotlight

ellipse(350, 250, 40, 40);

}

For this project i wanted to create something that resembles a stage lighting design, hence the creation of this neon color drawing. I thought the corner drawings were actually not as hard as aligning perfectly the middle section (the two horizontal lined triangles).

hyt-Looking-Outwards: “I am Sitting in a Machine” by Martin Backes

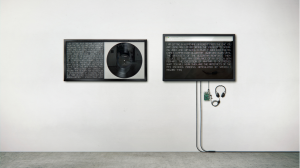
The inspiring sound installation art, I am Sitting in a Machine, is created by multi-disciplinary artist and composer Martin Backes. The piece pays tribute to the Alvin Lucier’s 1969 experimental piece I Am Sitting in a Room — a piece where the composer narrates a paragraph of text, then play the recording to an empty room, and re-recorded and re-played until the piece ends with hollow, resonated sounds. Similar process was used by Martin Backes, except that the narration is conducted by an artificial human voice, and then run through a MP3 encoder repeatedly through algorithms.

Exhibition view of “I am Sitting in the Machine”

For the physical work itself, the left portion is a 30-unit dubplate vinyl disk, and the right portion an online web page that conducts the same audio. The production presents the process of encoding until it fades into distortions and simple data formats.

I was mostly drawn to the artworks because of the reiterated interpretation of the experimental process, revealing the transformation from supposedly natural sounds to another that is so artificial and cold, and slowly goes into decay as the process repeats infinitely; at the mean time, its recursive algorithm also accentuates its properties as both a physical and digital production. According to the artist, he made 3000 iterations of the piece and eventually chose 32 tracks eventually, illustrating the variety and differences for each trial.


Web edition: http://iamsittinginamachine.net/info.html

hyt-03-Looking Outwards: Generative Cloud


Caption: Cumulus In Progression – by SOFTLab.

When I was browsing on the websites given by the professor, I came across project Cumulus on Behance created by SOFTLab. This is an interactive installation that enables the light, as well as geometric shapes to change in response to the sounds in its environment. However, the changes are not constant, but rather irregular based on a series of algorithms coded through Processing, which sets up “tubes” of lightning connecting from one end to another, hence creating a mysterious cloud-shaped sculpture. The “tube” materials consist of acrylic along with 3D printed joints, as well as over 70 meters of LED lights installed within the structure.

This project intrigued me as I enjoyed its interactivity engaging with the audience. Its futuristic shape in combination with a very nature-centered concept with lightning, cloud, and sounds can be confusing but eyeopening at the same time. On the other hand, its analytic aspect of breaking down the system of sounds also adds a technological meaning to the piece. I am curious to learn about how Processing helped to generate an art piece like this, and I am excited to try out the process as well! 


hyt-Project-03: Dynamic Drawing

Dynamic Drawing

// helen tsui
// 15-104 section d
// hyt@andrew.cmu.edu
// project-03-dynamic-drawing

var x1 = 100; // top left coordinate of the quad
var x2 = 150; 
var x3 = 200;
var x4 = 250;
var y = 230; // top left coordinate of the quad
var v = 150; // random variable, refer to attached pic in post 
var TH = 120; // triangle height, refer to attached pic in post
var TW = 170;
var radius = 20; // radius
var lightOn = false;
var curveOn = false; 
var arrived1 = false;
var arrived2 = false;
var arrived3 = false;
var arrived4 = false;


function setup() {
  createCanvas(640, 480);
  angleMode(DEGREES); 
}


function draw() {
    background(0); // black

// lights turn on the screen
    fill(255, 255, mouseX / 3); // yellow
    text("~press me~", 80, 100);
    noStroke();
    ellipse(200, 200, radius, radius); // light source

// mouse approach the light source and light fills the screen
    var distance = dist(mouseX, mouseY, 200, 200);
    if (distance < 10) {
        lightOn = true;
    }
    if (lightOn == true){
        radius += 5;
    }

// a sequential order from quad1+3 to quad2+4
    if (radius > 500) {
        if (x1 < 150) {
            x1 += 1
        } else {
            arrived1 = true; 
        }
        if (x2 < 200 & arrived1 == true) {
            x2 += 1;
        } else {
            arrived2 = true;
        }
        if (x3 < 250 & arrived2 == true) {
            x3 += 1;
        } else {
            arrived3 = true;
        }
        if (x4 < 300 & arrived3 == true) {
            x4 += 1;
        } else {
            arrived4 == true;
        }
    }

// original quad lines
    b = mouseX; // color gradient for background
    stroke(0);
    strokeWeight(3);
    v = random(120, 125);
    // quad 1
        line(x1, y, x1 + TW, y - TH); 
        line(x1 + TW, y - TH, x1 + TW, y - TH + v); 
        line(x1 + TW, y - TH + v, x1, y + v);
        line(x1, y + v, x1, y);
    // quad 2
    if (arrived1 == true) {
        line(x2, y, x2 + TW, y - TH); 
        line(x2 + TW, y - TH, x2 + TW, y - TH + v); 
        line(x2 + TW, y - TH + v, x2, y + v);
        line(x2, y + v, x2, y);
    }
    // quad 3
    if (arrived2 == true) {
        line(x3, y, x3 + TW, y - TH); 
        line(x3 + TW, y - TH, x3 + TW, y - TH + v); 
        line(x3 + TW, y - TH + v, x3, y + v);
        line(x3, y + v, x3, y);
    }    
    // quad 4
    if (arrived3 == true) {
        line(x4, y, x4 + TW, y - TH); 
        line(x4 + TW, y - TH, x4 + TW, y - TH + v); 
        line(x4 + TW, y - TH + v, x4, y + v);
        line(x4, y + v, x4, y);
    }

}


This project has been extremely challenging to me. I was struggling a lot with which idea to focus on, and eventually chose an abstract geometric, animation-like shape. I wanted to create a scenery of light litting up the screen in darkness, and surprisingly you would find moving, animated geometry sequence. The end product was not really what I expected, but in general I was glad that I learned ways to use better logic with if statements.