jiaxinw-Project-07-Curves

sketch

var mouse_x;

function setup() {
    createCanvas(480, 480);
}

function draw() {
    background(50);
    var x;
    var y;

    // limit the mouseX only works in canvas
    if(mouseX<width & mouseX >0){
        mouse_x = mouseX;
    } else if (mouseX<=0){
        mouse_x = 0;
    } else{
        mouse_x = width;
    }

    // http://mathworld.wolfram.com/Deltoid.html 
    // mapping the b from 0 to 480 into from 0 to 30,
    // and since b is the radius of the small circle, make it relate to
    //mouse X can change the scale of the curves. 
    var b = map(mouse_x, 0, width, 0, 30);

    for (var i = 1; i <= 20; i++) {
        push();
        //put the whole thing in the center of the canvas and make it shake
        translate(width/2+random(-5,5), height/2+random(-5,5));
        //change mouseX also affect the rotation of the shapes 
        var rotateAng = map(mouse_x, 0, width, 0, TWO_PI)
        //make the rotation more obvious
        rotate(rotateAng + i*3);
        //make the stroke weight become less according to the number of shape
        strokeWeight(8/i);
        noFill();
        //make the stroke color of circles randomlmy change
        stroke(random(20,100),random(10,130),random(50,100)
            ,400/i);
        ellipse(0,0,6*i*b,6*i*b);
        //call the function to draw curves
        DrawCurves(i * b);
        pop();
    }
}

function DrawCurves(R) {
    //map the color change into a range as the mouseX is changing
    var red = map(mouse_x, 0, width, 10, 20);
    var green = map(mouse_x, 0, width, 10, 15);
    var blue = map(mouse_x, 0, width, 10, 20);

    fill(red*random(4, 7), green*random(11,12),blue*random(6,15));
    //draw curves according to the parametric equations
    for (var i = 0; i < 360; i++) {
        var t = radians(i);
        x = 2 * R * cos(t) + R * cos(2 * t);
        y = 2 * R * sin(t) - R * sin(2 * t);
        beginShape(POINTS);
        vertex(x, y);
        endShape();
    }
}

First, I went through the curves and picked out Deltoid (http://mathworld.wolfram.com/Deltoid.html) one to play around.

After I successfully drew our the curve in a static way, I thought about how to make it look more interesting. I tried to draw multiple curves in different scales but found that if they are in the same direction, it looked boring. So I tried to make them rotate and point to different directions. Next step, I used mouseX to control the rotation. And I thought if the scale of the curves can also be changed, it would be interesting! After this was done, I figured out I could also play around with the stroke weight to make curves look different and also colours!

I am glad that I finally got an interesting interactive result 🙂


jiaxinw-LookingOutwards 07

Shipmap.org
by Kiln

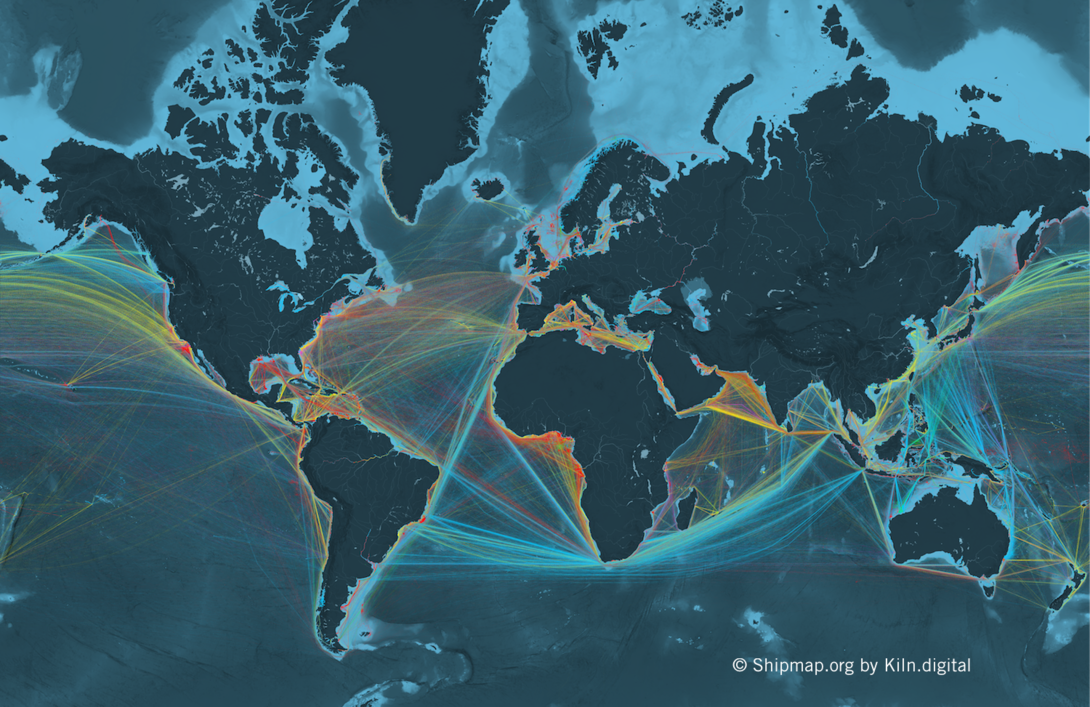
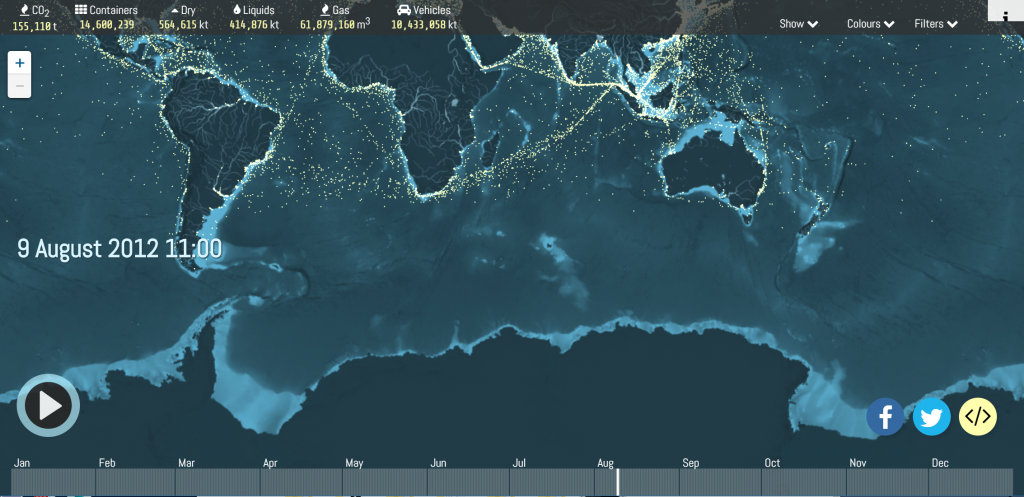
Shipmap.org shows commercial shipping movements based on hundreds of millions of data points from throughout 2012. It was created by created by Kiln based on data from the UCL Energy Institute (UCL EI). UCL EI took data showing location and speed of ships and cross-checked it with another database to get the vessel characteristics. With this information, they were able to compute the CO2 emissions for each observed hour, following the approach laid out in the Third IMO Greenhouse Gas Study 2014. The designer took the resulting dataset and visualized it with WebGL on top of a specially created base map. The most impressive thing about this website is that it shows a high level of interaction with datas — such as you can select different time, ship categories and zoom in or out — and at the same time the map maintains the elegant visual appearance by using simple colors and movements.

For more information, please go to https://www.shipmap.org/

jiaxinw-Project 06-Abstract Clock

sketch

//original x,y position for second leaves
var sy = -180;
var sx = 0;
//original x,y position for minute leaves
var my = -150;
var mx = 0
//original x,y position for hour petals
var hy = -70;
var hx = 0

//mark the initial frame as 0
var frameInSec = 0;
var frameInMin = 0;
var frameInHr = 0;

function setup() {
    createCanvas(480, 480);   
}

function draw() { 
    angleMode(DEGREES);
    background("lightblue");
    noStroke();

    //translate the center to the center of the canvas
    translate(width/2, height/2);

    //base leaves-seconds
    push();
    var numS = 60-second();//the number of second leaves on the canvas

    if (frameInSec != second()) {
        frameInSec = second(); // to see if the frame enter a new second
        sy = -180;//if it is a new second then reset the last leaf x,y to original position
        sx = 0;
    }

    
    //draw a leave rotate every 6 degrees 
    for (var i = 0; i <= numS; i++) {
        fill(100, 176, 96);
        rotate(-6);
        //if i smaller than the number then draw static leaves
        if(i < numS){
            ellipse(0,-180,20,40);
        } else {
        //if i is the number then the leave flies away
            ellipse(sx,sy,20,40);
            sy -= 3;  
            sx -= random(-10,3)
        }
    };
    pop();

    //middle layer leaves-minutes
    push();
    var numM = 60-minute();//the number of minute leaves on the canvas

    if (frameInMin != minute()) {
        frameInMin = minute(); // to see if the frame enter a new minute
        my = -150;//if it is a new minute then reset the last leaf x,y to original position
        mx = 0;
    }

    //draw a leave rotate every 6 degrees 
    for (var j = 0; j <= numM; j++) {
        fill(76, 132, 73);
        stroke(89,154,85)
        rotate(-6);
        //if i smaller than the number then draw static leaves
        if(j < numM){
            ellipse(0,-150,25,60);
        } else {
        //if i is the number then the leave flies away
            ellipse(mx,my,25,60);
            my -= 3;  
            mx -= random(-10,3)
        }
    };
    pop();

    //flower-hour
    push();
    var numH = 24-hour();//the number of hour petals on the canvas

    if (frameInHr != hour()) {
        frameInHr = hour(); // to see if the frame enter a new hour
        hy = -70;//if it is a new hour then reset the petal x,y to original position
        hx = 0;
    }

    //draw a leave rotate every 6 degrees 
    for (var g = 0; g <= numH; g++) {
        fill(219, 181, 122);
        stroke(215,167,92)
        strokeWeight(3);
        rotate(-15);
        //if i smaller than the number then draw static leaves
        if(g < numH){
            ellipse(0,-70,45,150);
        } else {
        //if i is the number then the petal flies away
            ellipse(hx,hy,45,150);
            hy -= 5;  
            hx -= random(-5,15)
        }
    };
    pop();

    //the heart of flower
    fill(113,83,37);
    ellipse(0,0,50,50)

}

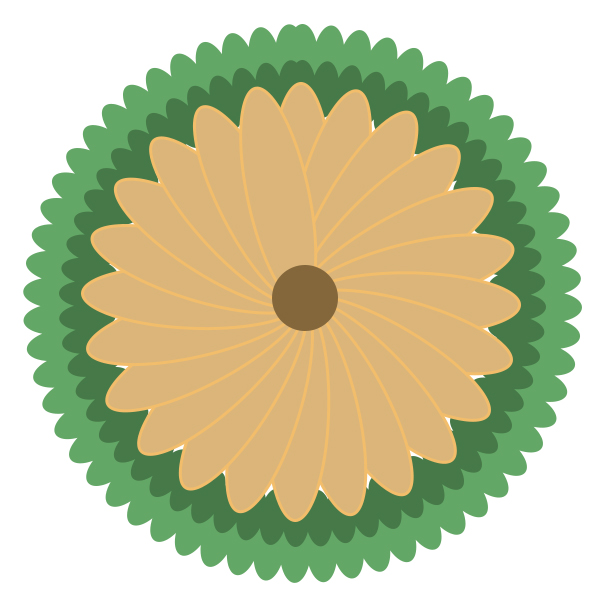
I had a thought about creating a flower and letting people watch it disappearing to learn how time passes away. Therefore, I started a sketch like below:

The outer ring leaves represent seconds, and as one second is gone, the leave is also gone. The same as the middle ring of “minute” leaves and the flower which represents the hour. After I successfully made the leaves and petals disappear according to the time, I started to think, maybe adding the animation of how the leaves and petals “fly” away can be interesting. To achieve this, I came up with an idea of drawing a new leaf or petal at the last position and adding a random number to its changing position.

I am very happy that I finally made my flower clock come true!

jiaxinw-LookingOutwards-06- Randomness

Irrational Geometrics, 2005-2015,by PASCAL DOMBIS

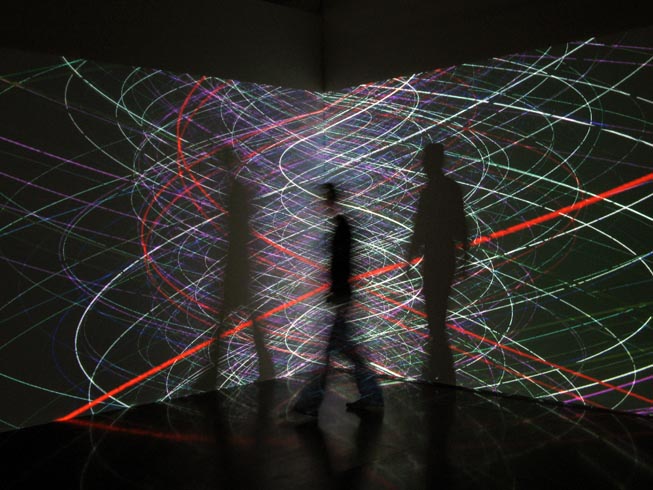
Pascal Dombis is a French visual artist. He has an art style of whose unpredictable and dynamic visual forms, and he uses the technology a lot, like programs to generate repetitive shapes, lines, patterns and so on for his works. Irrational Geometrics is one of the works with the classic unpredictable generated art style. This piece of arts explored the relationship and development of straight lines and curves, as it was described “When you take a line fragment and give it a stretch, as you do with the string of a bow, the first result is a curve, then a circle and in case you go for it, endlessly, the ultimate artefact is a line again.” The best part of this art installation was the interaction between the audience and the projection. Once the rope was pulled, the whole wall started to change. Thousands of millions of carves were moving, rotating and changing on the wall as you controlled.  Pascal Dombis used the algorithm to generate all the lines and curves as well as their movements.

For more information, please go to: http://dombis.com/works/irrational-geo/


jiaxinw-LookingOutwards-05

6088AD

by Cornelius Dämmrich

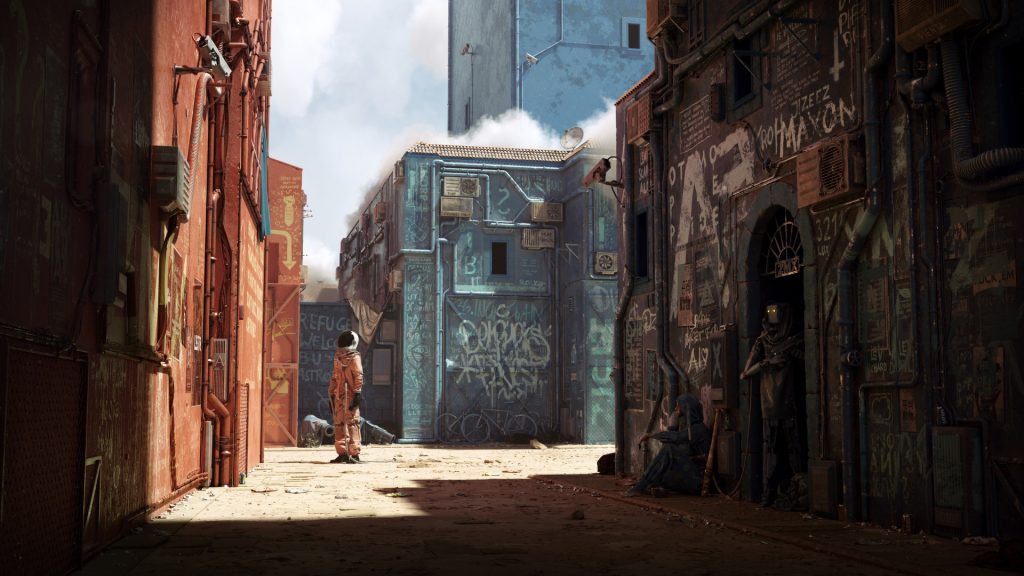
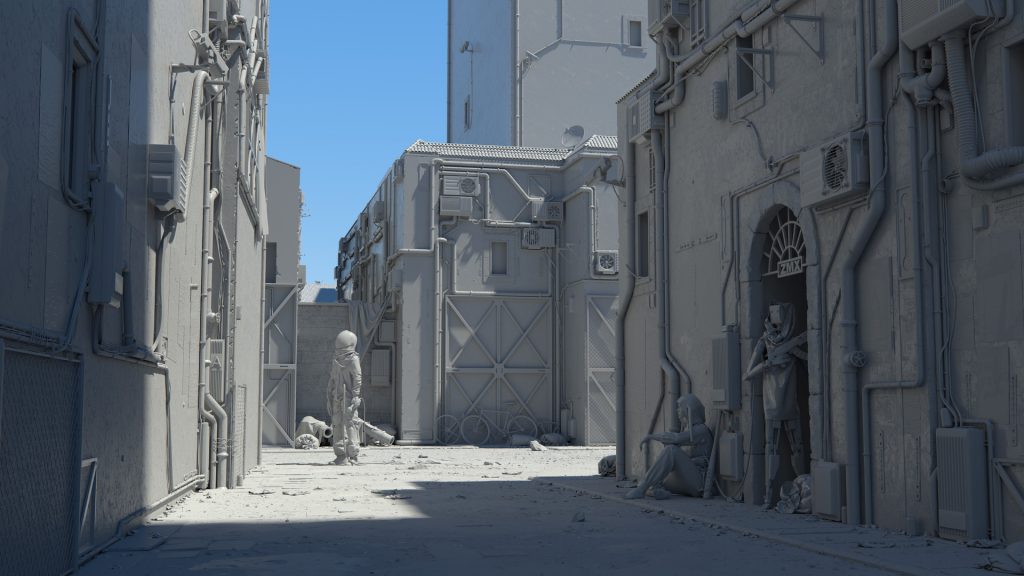
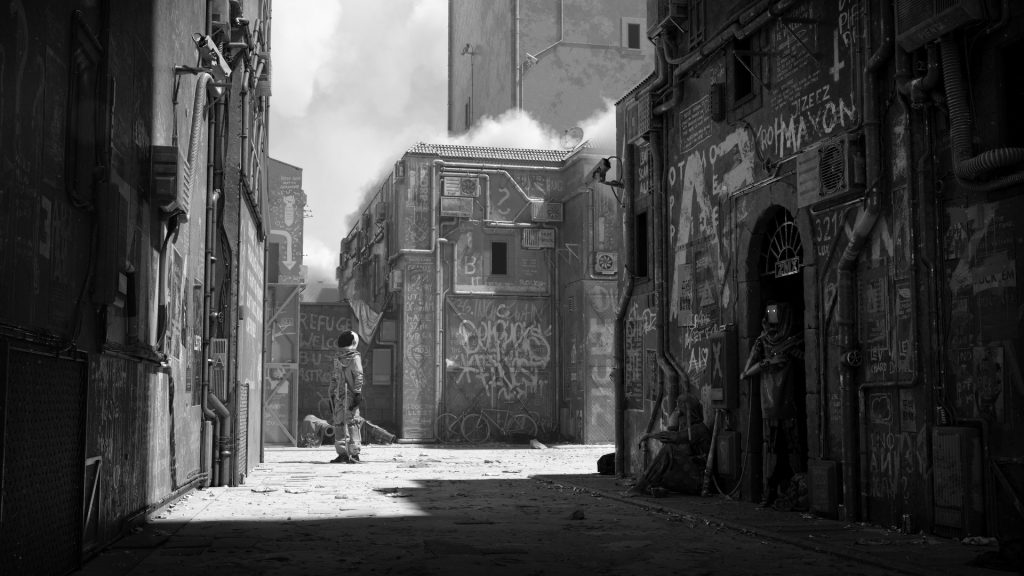
Cornelius Dämmrich is a German freelance CG artist, 6088AD was a painting that he created this year using multiple graphics software. For this painting, he focused a lot on the shading, texture, and lighting for 3D computer graphics. Although the painting doesn’t have a specific story behind, it created an atmosphere combining future and modern humans culture together. The imagination and appearance were very strong and attractive.  Cornelius posted a very detailed breakdown tutorial to explain how he created 6088AD.

From the video, we can see that he first built up the scene using simple shapes to mark the portions of subjects inside. Also, he used the light inside to make shadows in the scene. Later, he kept carving the models and textures to make it more realistic. The choice of color works really well, the orange on the left side and the greyish colors on the right side helps to create the interesting contrast in the painting. It also strengthens the vivid feeling.

For more details, please go here: https://zomax.net/gallery/6088ad/

jiaxinw-Project 05- Wallpaper

sketch

function setup() {
    noLoop();
    createCanvas(480, 600);
    background(255);
    //fill the canvas with a gradient color
    bgColor();

    //riandrop length
    var dLen = 10;

    noStroke();
    //fill the canvas with raindrop, set raindrop x and y equal 10
    for(var dy = 10; dy < height-dLen; dy += 40 ){
        for(var dx = 10; dx < width - dLen; dx += 40){
            stroke(144, 197, 242);
            strokeWeight(3);
            line(dx, dy, dx+dLen, dy+dLen);
        };
    };
    
    //umbrella size 
    var size = 80;

    //fill the canvas with umbrellas, set umbrella x and y equal 60
    for ( var y = 60; y < height-size/2; y += 95){
        for (var x = 60; x < width-size/2; x += 90){

            //blue umbrellas
            if((x+y)%7==0){
                    
                push();
                translate(x,y);
                rotate(radians(-45))
                //umbrella handle 
                noStroke();
                fill(57,130,158);
                rectMode(CENTER);
                rect(0, 0, 4, 80)

                noFill();
                stroke(71,165,200)
                strokeWeight(4);
                arc(0-size/12, 0+40, size/6, size/6, 0, PI)

                //umbrella top                   
                noStroke();
                blueUmbre(0,0);
                //small triangles of umbrella
                var tx=0;
                for(i = 0; i < 6; i++){
                    triangle(tx-size/2, 0, tx-size/2+(size/6), 0, tx-size/2+size/12, 0+size/12);
                    tx += size/6;
                };
                pop();
            } else {//red umbrellas
                //umbrella handle 
                noStroke();
                fill(234, 145, 145);
                rectMode(CENTER);
                rect(x, y, 4, 80)

                noFill();
                stroke(230,80,80)
                strokeWeight(4);
                arc(x-size/12, y+40, size/6, size/6, 0, PI)

                noStroke();
                //umbrella top
                redUmbre(x,y);
                //arc(x, y, size, size, PI, 2*PI)
                //small triangles of umbrella
                var tx=x;
                for(i = 0; i < 6; i++){
                    triangle(tx-size/2, y, tx-size/2+(size/6), y, tx-size/2+size/12, y+size/12);
                    tx += size/6;
                };
            };
        };
    };
    
}

function draw() {
}

function bgColor(){
    //create a gradient color from green to blue
    colorMode(RGB);
    noStroke();
    from = color (179, 222, 213);
    to = color (179, 209, 222);
    interA = lerpColor(from, to, .20)
    interB = lerpColor(from, to, .40)
    interC = lerpColor(from, to, .60)
    interD = lerpColor(from, to, .80)
    fill(from);
    rect(0,0,width,height/6);
    fill(interA);
    rect(0,height/6,width,2*height/6);
    fill(interB);
    rect(0,2*height/6,width,3*height/6);
    fill(interC);
    rect(0,3*height/6,width,4*height/6);
    fill(interD)
    rect(0,4*height/6,width,5*height/6);
    fill(to);
    rect(0,5*height/6,width,height);
}

//create gradient red color for red umbrellas
function redUmbre(x,y){
    var r = 230;
    for (var size=80; size > 0; size -= 2){
        fill(r,80,80)
        arc(x, y, size, size, PI, 2*PI)
        r -=1; 
    };
}

//create gradient blue color for blue umbrellas
function blueUmbre(x,y){
    var g = 165;
    for (var size=80; size > 0; size -= 2){
        fill(71,g,200)
        arc(x, y, size, size, PI, 2*PI)
        g -=1; 
    };
}

To start with the project, I drew out the sketch to have a sense of how the layout should look like.

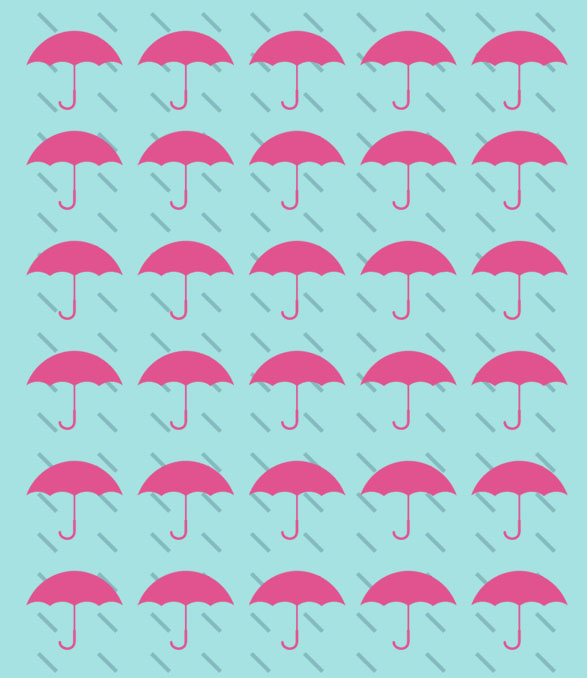
At first, I only wanted the umbrella all looked like the same. When I created the all-umbrella wallpaper, I found if some of the umbrellas can be changed would be interesting. Therefore, I thought about how to make only some of the umbrellas change but not in a “boring” pattern. Later I found out if I ply around with the variables for the umbrella’s x and y, this design maybe can work! I tried to use modulo related to x and y, and it worked. What’s more, because the color looked “flat”, I thought maybe making the color become gradient can be more attractive, so I add gradient colors to umbrellas and the background.

jiaxinw-SectionB-LookingOutwards 04

Cloud Piano

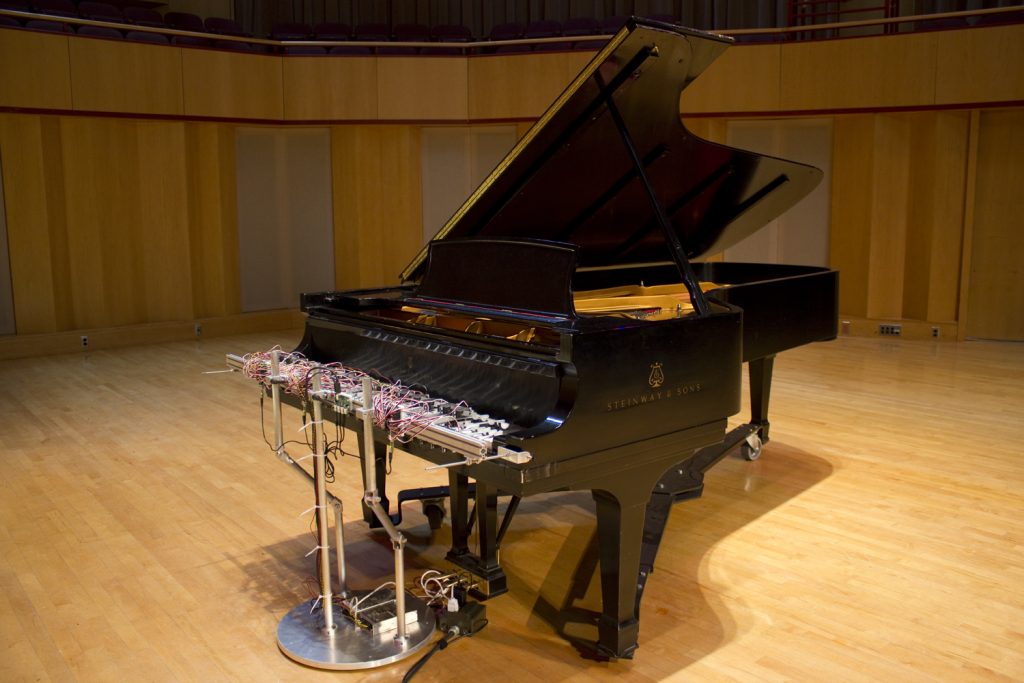
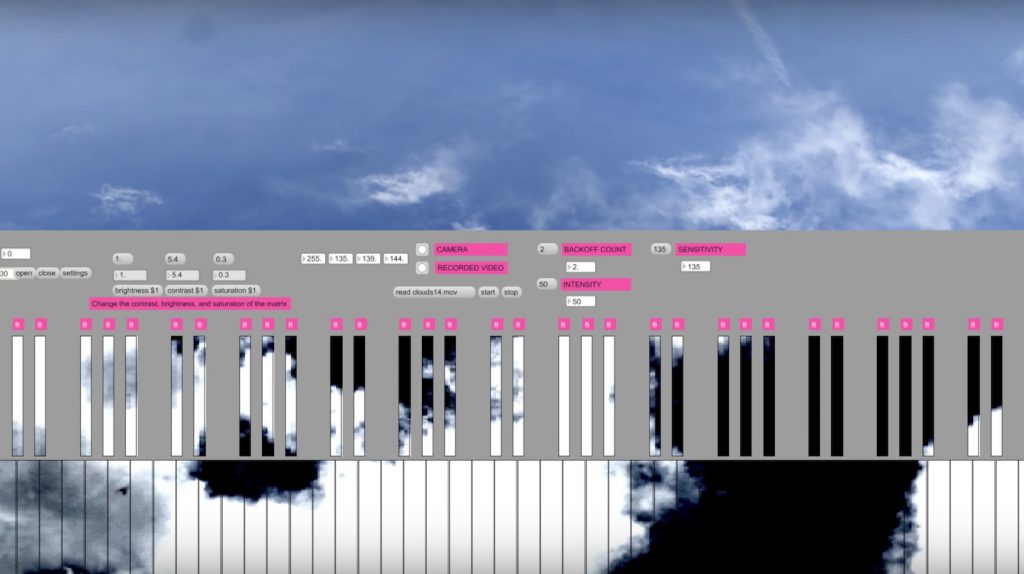
Cloud Piano was an installation created by David Brown in 2014. In this installation, a piano would be played based on the shapes and movements of the clouds. A camera was used to record the real-time cloud and a software articulated a device to press the keys on the piano according to the moving images from the video. I think the customized software analyzed the real-time images and transferred them into black and white pictures. According to the portion of black and white, the strength and position to press the piano keys were decided.

I like how the artist combined the unpredictable movements of nature and the artificial instrument together. It created an unusual yet romantic feeling for the music. This was a new way of turning nature into artistic sounds. Using the computing skills to analyze the real-time data, the artist turned his feeling of nature into an interesting art installation.

For more information: http://www.dwbowen.com/cloud-piano/


jiaxinw-sectionB-Project 4-String Art

sketch

function setup() {
    createCanvas(300, 400);
    background(20);

    //left white crossed lines
    stroke(255);
    var yl = height/4*3;
    var ym1 = height/8*5;

    for(var i=0; i < 15; i++){
        line(0, yl, width/2, ym1);
        yl *=0.97;
        ym1 *= 1.02+mouseX;
    };

    //right white crossed lines
    var yr = height/4*3;
    var ym2 = height/8*5;

    for(var i=0; i < 15; i++){
        line(width, yr, width/2, ym2);
        yr *=0.97;
        ym2 *= 1.02;
    };


    //left top lines 
    var x1 = 0;
    var y1 = height/2;

    for (var i=0; i < 15; i++){
        stroke(251,63,65);
        line(x1, 0, 0, y1);
        x1 += 15;
        y1 -= 10;
    };

    // right top lines 
    var x2 = width;
    var y2 = height/2

    for (var i=0; i < 15; i++){
        stroke(18,187,255);
        line(x2, 0, width, y2)
        x2 -= 15;
        y2 -= 10;
    };

    // right bottom lines
    var x3 = width;
    var y3 = height/2;

    for(var i=0; i < 15; i++){
        stroke(255, 242, 0);
        line(x3, height, width, y3)
        x3 -= 15;
        y3 += 10;
    };

    // left bottom lines
    var x4 = 0;
    var y4 = height/2;

    for(var i=0; i < 15; i++){
        stroke(0,255,217);
        line(x4, height, 0, y4);
        x4 += 15;
        y4 += 10;
    }

    //upper left grey crossed triangle
    var x5 = width/4;
    var y5 = height/2;

    stroke(100);
    line(x5, y5, width/2, y5)
    line(x5, y5, x5+(width/2-x5)/2, y5- sqrt(3)/2*(width/2-x5));
    
    for(var i=0; i < 8; i++){
        line(x5+5, y5, width/4+(width/2-x5)/2, y5- sqrt(3)/2*(width/2-x5));
        x5 += 10;
    }

    //upper purple triangle
    var x6 = width/4*3;
    var y6 = height/2;

    line(width/2, y6, x6, y6)
    line(x6, y6, width/4+(width/4)/2, y5- sqrt(3)/2*width/4);

    for(var i=0; i < 8; i++){
        line(x6-5, y6, width/4+(width/4)/2, y5- sqrt(3)/2*width/4);
        x6 -= 10;
    }

    //lower purple triangle
    var x7 = width/4;
    var y7 = height/2;

    stroke(156,0,255);

    for(var i=0; i < 31; i++){
        line (x7, y7, width/2, height/4*3);
        x7 += 5;
    }

    var x8 = width/4;
    var y8 = height/2;

    for(var i=0; i < 31; i++){
        line (x8, y8, width/2, height/4);
        x8 += 5;
    };

    
}

function draw() {
    
}


I tried to create a common usual string art pattern like this at first :

Later, I started to try to create a concrete shape in the middle of my canvas. During this project, I just had fun with combining different sequences of lines.

jiaxinw-section B-LookingOutwards-03

Generative 3D Printed Masks

In 2013, DO THE MUTATION, an Italian two-person generative design lab developed the COLLAGENE mask editor to form customized masks for three different people. The three masks are produced by CRP GROUP with their WINDFORM materials. I like the personality of this generative 3D printing art a lot. Artists can create personal masks that fit people’s faces perfectly with the calculation of programming, as we can see from the picture, the mask fits personal face so well that it looks like sticking to the face.  This project shows the possibility of combining detailed sensor and customized arts. DO THE MUTATION created a software application COLLAGENE which was written in processing and used the Toxiclibs libraries to generate the isosurface. The artists controlled the appearance of the mask by drawing shapes and lines on the software, and the software helped to fix the position of the shapes and lines to match the specific face. After that, the 3D printer can print out the masks. Therefore, COLLAGENE combined the creation of arts and the precise data together.

For more information, please click here https://dothemutation.wordpress.com/2013/01/29/venezia-02-13-la-mutazione/ 


jiaxinw-section B-Project 03-Dynamic Drawing

sketch

var rectSize = 20;
var dir = -1;

//the distance between corner circles and the center
var distCorner;
//the distance between up, bottom, left and right circle and the center
var dist1;
//color

//thin rectangle Y position 
var rectY = 5;

//thin rectangle height
var rectH = 5

function setup() {


    createCanvas(480, 640);
    distCorner = sqrt(11250);
    dist1 = 150;  

}

function draw() {			

	//if mouse is outside the canvas, then the movements stop
	if(mouseX > 480){
		mouseX = 480;
	}

	if(mouseX < 0){
		mouseX = 480;
	}

	background(40);
	noStroke();
	rectMode(CENTER);
	fill(255, 70);	
	
	//the center rectangles 
	push();
	fill(255, 90);
	//change color when mouse is hovering on the rect
	if( dist(mouseX, mouseY, width/2, height/2) < Math.abs(rectSize/2)) {
		fill(230,97,71);
	};
	//when mouse move, the rectangles rotate
	rectMode(CENTER);
	translate(width/2, height/2);
	rotate(mouseX*0.01)	
	//central big rect
	rect(0, 0, rectSize, rectSize);
	//four small rectangles on the center
	fill(255,40);
	rect(-10, 10, rectSize/2, rectSize/2);
	rect(10,-10, rectSize/2, rectSize/2);
	rect(10, 10, rectSize/2, rectSize/2);
	rect(-10,-10, rectSize/2, rectSize/2);
	pop();

	//the left rect
	push();
	//change color when mouse is hovering on the rect
	if( dist(mouseX, mouseY, width/2-100, height/2) < Math.abs(rectSize/2) ){
		fill(125,201,198,90);
	};
	rectMode(CENTER);
	translate(width/2-100, height/2);
	rotate(mouseX*0.01)	
	rect(0, 0, rectSize, rectSize);
	pop();

	//the up rect 
	push();
	if( dist(mouseX, mouseY, width/2, height/2-100) < Math.abs(rectSize/2)) {
		fill(125,201,198,90);
	};
	rectMode(CENTER);
	translate(width/2, height/2-100);
	rotate(mouseX*0.01)	
	rect(0, 0, rectSize, rectSize);
	pop();

	//the right rect
	push();
	if( dist(mouseX, mouseY, width/2+100, height/2) < Math.abs(rectSize/2)) {
		fill(125,201,198,90);
	};
	rectMode(CENTER);
	translate(width/2+100, height/2);
	rotate(mouseX*0.01)	
	rect(0, 0, rectSize, rectSize);
	pop();

	//the bottom rect
	push();
	if( dist(mouseX, mouseY, width/2, height/2+100) < Math.abs(rectSize/2)) {
		fill(125,201,198,90);
	};
	rectMode(CENTER);
	translate(width/2, height/2+100);
	rotate(mouseX*0.01)	
	rect(0, 0, rectSize, rectSize);
	pop();

	//left top rect
	push();
	if( dist(mouseX, mouseY, width/2-sqrt(5000), height/2-sqrt(5000)) < Math.abs(rectSize/2)) {
		fill(125,201,198,90);
	};
	rectMode(CENTER);
	translate(width/2-sqrt(5000), height/2-sqrt(5000));
	rotate(mouseX*0.01)	
	rect(0, 0, rectSize, rectSize);
	pop();

	//right top rect
	push();
	if( dist(mouseX, mouseY, width/2+sqrt(5000), height/2-sqrt(5000)) < Math.abs(rectSize/2)) {
		fill(125,201,198,90);
	};
	rectMode(CENTER);
	translate(width/2+sqrt(5000), height/2-sqrt(5000));
	rotate(mouseX*0.01)	
	rect(0, 0, rectSize, rectSize);
	pop();

	//right bottom rect
	push();
	if( dist(mouseX, mouseY, width/2+sqrt(5000), height/2+sqrt(5000)) < Math.abs(rectSize/2)) {
		fill(125,201,198,90);
	};
	rectMode(CENTER);
	translate(width/2+sqrt(5000), height/2+sqrt(5000));
	rotate(mouseX*0.01)	
	rect(0, 0, rectSize, rectSize);
	pop();

	//left bottom rect
	push();
	if( dist(mouseX, mouseY, width/2-sqrt(5000), height/2+sqrt(5000)) < Math.abs(rectSize/2)) {
		fill(125,201,198,90);
	};
	rectMode(CENTER);
	translate(width/2-sqrt(5000), height/2+sqrt(5000));
	rotate(mouseX*0.01)	
	rect(0, 0, rectSize, rectSize);
	pop();

	//outside circles
	push();
	//rotate as a big circle when the mouse moves 
	translate(width/2, height/2);	
	rotate(mouseX*0.01)
	ellipse(-dist1, 0, 15, 15);
	ellipse(dist1, 0, 15, 15);
	ellipse(0, -dist1, 15, 15);
	ellipse(0, dist1, 15, 15);
	ellipse(distCorner, -distCorner, 15, 15);
	ellipse(-distCorner, -distCorner, 15, 15);
	ellipse(distCorner, distCorner, 15, 15);
	ellipse(-distCorner, distCorner, 15, 15);
	pop();

	//instruction
	fill(255, 70);
	textSize(15);
	text("move your mouse to the squares or drag your mouse", 60, height-20); 

}

function mouseDragged(){	
	//when the mouse is dragged, the size of rects become bigger
	rectSize += 2;
	dist1 +=1.5;
	distCorner +=1.5;
	//if the size is bigger than 120, the rects become smaller
	if (rectSize > 120){
		rectSize *= dir;
		distCorner *=dir;	
		dist1 *=dir;	
	}

	//if the size is 0,the circles go back to original places
	if (rectSize == 0 ){
		distCorner = sqrt(11250);
		dist1 = 150;
		
	};

	//if the mouse if off the canvas, the graphic stop moving
	if(mouseX > 480 || mouseY > 680){
		rectSize = 100;
		distCorner = 1.5*sqrt(11250);
    	dist1 = 1.5*150;
	}
}


I planned to make a rotating dynamic drawing at first, so I started to build a circle of squares and when the mouse wheel was moved, the size of squares would be changed. However, I realized moving the wheel can also scroll down the page which would be very inconvenient. Therefore, I decided to change moving the wheel by dragging the mouse. Also, I realized it would be fun to change the color of squares, so I have made the color can be changed whenever the mouse is hovering on the squares.