//Jihee Kim
//15-104 MWF 9:30
//jiheek1@andrew.cmu.edu
//Project 7 Curves
//section D
var backgroundRed;// Red value of background
var backgroundGreen =245; // Green value of background
var backgroundBlue =252;// Blue value of backgound
functionsetup(){createCanvas(480,480);}functiondraw(){background(backgroundRed, backgroundGreen, backgroundBlue); //The background color changes from light blue to light pink
//when mouseY moves from top to bottom of canvas
backgroundRed =map(mouseY,0, height,219,255); //R value changes
push();translate(width/4, height/3); //push over the generating point of curves
for(var i =1; i <16; i++){ //loop from first to sixteenth value
//show depth through color and lineweight
stroke(map(i,1,5,30,120)); //the stroke turns from grey to lighter
//grey as the curve moves away from
//the focal point of curves
strokeWeight(map(i,1,5,0.3,2)); //strokeWeight increases as curves
//get further away from focal point
//call the drawCurve function to draw curves
drawCurve(i*2); //use 'i' as scale factor for spacing between curves
rotate(PI/3); //rotate each time a curve is drawn
}pop();}functiondrawCurve(scaleF){ //using 'i' as the scale factor (scaleF)
var a =15;var b =(map(mouseX,0, width,-1,1)); //the curves form a hypocycloid
//when b(radius of rolling circle)
//is negative, and a epicycloid
//when the value is positive
noFill(); //start shape
beginShape();for(var i =0; i <200; i++){ //a bigger max gives you a smoother curve
var t =map(i,0,200,0,2*PI); //map 't' so that it only rotates
//full circle once (2PI)
var x =(a + b)*cos(t)- b *cos((a/b +1)* t);var y =(a + b)*sin(t)- b *sin((a/b +1)* t);vertex(scaleF*x, scaleF*y);} //end shape
endShape(CLOSE); //this caps the beginning and the end
}
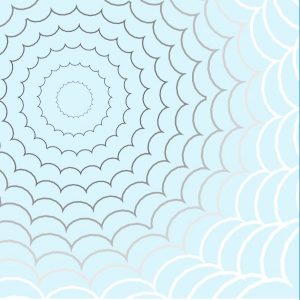
For this project, I created an interactive set of curves that were generated though a mathematical equation. I made it so that the shape that the curves form morphs from a hypocycloid to an epicycloid (left to right) depending on the position of the mouse.
Some other aspects that I manipulated so that the main theme, which is depth, is clear are lineweights, color, and spacing. Using for loops and mapping, I made it so that the stroke turns from grey to a lighter color on the greyscale as the curves move away from the focal point of curves. Moreover, the lineweight of these curves also increases as the curves get further away from the focal point.
The curves are supposed to look like a sky full of clouds when they are forming a hypocycloid, and a flower when they are forming a epicycloid. The background color varies with the y position of the mouse, adding to the intention behind incorporating both cyclodal curves, as well.
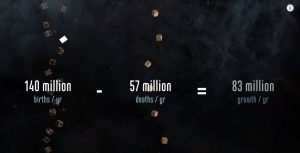
The Shadow Peace is a short film that presents the effects of nuclear war. Neil Halloran, one of the most brilliant data visualizers in the world created this video using custom software to quantify the consequences of nuclear war, as the possibility of it happening has been constantly increasing especially with tension building up between the US and North Korea. He compares trends like casualties in wars and bombing in the past with his software and depict them through visual elements.
scene from the short film that demonstrates data and its visualization
It is fascinating how Halloran communicates data through his short films so effectively. A lot of it has to do with the visually enticing elements of the video that are made possible by simple geometries that represent data, comparison (in this case Hiroshima bomb attack, etc.) and narration. More specifically, elements such as bar charts are thoughtfully used and placed (on timelines, globes, etc.) so that the viewers could put information and data into context. His approaches to data visualization show his focus on bestowing relevance to data sets that could have no meaning to some people.
Halloran certainly touches people’s senses through his data visualization so that global matters/issues like war do not feel so distant and irrelevant to people. He allows us to hear and see data -data that connects the people to the world through visualization.
//Jihee Kim
//15-104 MWF 9:30
//jiheek1@andrew.cmu.edu
//project6 Abstract Clock
//section D
functionsetup(){createCanvas(480,480);noStroke();}functiondraw(){background(127,87,75);drawGrid(); // draw a picnic table pattern in the background with grid
var H =hour()%12; //the hour restarts on a 12-hour basis
var M =minute();var S =second(); //SECONDS
//for every second, a salt particle comes out of the shaker
//draw the salt shaker
stroke(180);strokeWeight(2);fill(220);ellipse(77.5,120,55,55); // head of the shaker
fill(255);stroke(180);quad(35,20,50,120,105,120,120,20); // the body of salt shaker
line(55,20,70,120); // left profile line of shaker
line(100,20,85,120); // right profile line of shaker
noStroke();fill(180);ellipse(73,138,5,5); // hole left
ellipse(82,138,5,5); // hole right
ellipse(77.5,144,5,5); // hole middle
//have the salt particles come out every second
for(var i =0; i < S; i ++){fill(255);rect(76,152+ i*5,2.5,2.5);} // MINUTES
// a ring forms on the plate of eggs every minute
//draw the plate of eggs
fill(230);noStroke();ellipse(width*3/4-1, height/4+3,403,403); // plate shadow for volume
fill(255);ellipse(width*3/4, height/4,400,400); // plate
//draw navy blue patterns on the plate
noFill();stroke(155,187,234);strokeWeight(1); //have ring draw every minute
for(var i =0; i < M; i++){ellipse(width*3/4, height/4,390-i*6.5,390-i*6.5);} //draw the eggs
noStroke(); //Egg1
fill(239,228,202); //428
ellipse(270, height/2-96,153,133); //egg white shadow for volume
fill(249,245,232);ellipse(270, height/2-100,150,130); //egg white
fill(237,130,37);ellipse(width-230, height/2-85,53,53); //egg yolk shadow for volume
fill(242,139,40);ellipse(width-232, height/2-86,50,50); //egg yolk
//Egg2
fill(239,228,202); //362
ellipse(width*3/4+2, height/2-5,153,133); //egg white shadow for volume
fill(249,245,232);ellipse(width*3/4, height/2-9,150,130); //egg white
fill(237,143,50);ellipse(width-133, height/2-13,53,53); //egg yolk shadow for volume
fill(242,152,54);ellipse(width-135, height/2-14,50,50); //egg yolk
//HOURS
//a sausage will appear every hour
//the tray of sausages will clear every 12 hours
//draw a tray for sausage
fill(255);rect(width/3-45, height-100, width*2/3+45,100);rect(width/3-30, height-115, width*2/3+30,15);ellipse(width/3-30, height-100,30,30); //round the corner of the tray
//draw patterns on the tray
noFill();stroke(160,157,78);strokeWeight(1);line(width/3-42, height-100, width/3-42, height);line(width/3-27, height-112, width, height-112);arc(width/3-27, height-97,30,30, PI,3*PI/2); //draw sausage (a sausage appears every hour)
var X =[130,160,190,220,250,280,310,340,370,400,430,460];var Y =410;for(var i =0; i < H; i++){stroke(147,49,28);strokeWeight(15); //thickness of the sausage
line(X[i], Y, X[i]+15, Y +40);}}functiondrawGrid(){ // cover canvas with vertical lines to depict a wood table
for(var y =0; y < height; y ++){for(var x =50; x < width; x +=50){stroke(102,69,56);strokeWeight(3);line(x, y, x, height);}}}
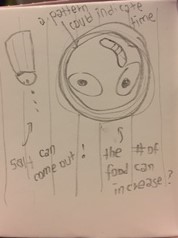
For this project, I created an abstract clock in a picnic setting. I used a hierarchy in size to depict the seconds, minutes and hours. The smallest element, which is the salt particles, represent the seconds. The second in size, which is the blue rings/pattern that form on the plate, depict the minutes. Lastly, the biggest element, the sausages represent the hours. The tray of sausages clears every 12 hours, making this clock based on a 12hr system.
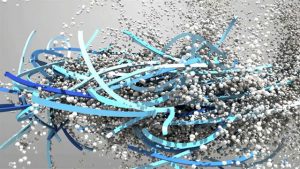
Forms is a computational project that is a collaboration between Memo Akten and Quayola, both who are visual/media artists. From March to September of 2012, Forms was a part of the In the Blink of an Eye: Media and Movement exhibition at the National Media Museum in Bradford, England. The project reflects restricted randomness that leads to a dynamic, organic animation of movements.
a moment in the project
The project explores interaction between the human body and forces in movements, concentrating on athletes who exert significant forces. It is interesting how through abstract visual elements, the authors portray relationships between the human and its environment, such as balance, force, and beauty. The video below compares the software-generated art and the subject(athletes) that was studied.
In the initial stages of the project, the artists created a setting that responds to the dynamic movements of the human body, acquired data on the athletes and ran physics-based simulations. This beginning stage is when they came across random yet predicted animations using 3D Studio Max and custom-made software. Although the animation may seem to be following the athlete’s motions strictly and simply depicting his/her movements, a sense of randomness exists in that the artists of the project focused more on what they see. If the hands of the person is being the attractor point, the authors augmented that part of the body more than other ones and created a flowing, enticing, random project. The end product is a combination of multiple layers that each focuses on different powers and actions of various parts of the athlete’s body.
It is intriguing how Memo Akten and Quayola were able to depict natural activities through random, anthropogenic elements and engage the audience through different senses. Their concentration on collisions between nature and “data dramatizations” as artists successfully manifest itself in the project.
More information can be found on the artists’ websites:
//Jihee Kim
//15-104 MWF 9:30
//jiheek1@andrew.cmu.edu
//project5 WallPaper
//section D
functionsetup(){createCanvas(480,480);noStroke();}functiondraw(){background(0); // make a grid of colorful ellipses
//draw small ellipses on top of grid to make crescent shapes
//the position of smaller ellipses changes the orientation of the crescent
//form a heart shape with the crescents in the middle of canvas
//other black voids should look like fish
drawGrid(); // form crescents on left half of canvas
// draw smaller circles that cover up bottom right of the bigger circles
for(var y =25; y < height+40; y +=40){ // offset center by 5
for(var x =25; x < width/2; x +=40){
fill (0);ellipse(x, y,30,30); // draw smaller circles
}} // draw rectangles that look like eyes for the fish on left
for(var y =20; y < height+40; y +=40){ // offset center by 5
for(var x =20; x < width/2-40; x +=40){
fill (255);rect(x, y,3,3); // draw rectangles
}} // form crescents on right half of canvas
// draw smaller circles that cover up bottom left of the bigger circles
for(var y =25; y < height+40; y +=40){ //offset center by -5
for(var x = width/2+15; x < width+40; x +=40){
fill (0);ellipse(x, y,30,30); // draw smaller circles
}} // draw rectangles that look like eyes for the fish on right
for(var y =20; y < height+40; y +=40){ // offset center by 5
for(var x = width/2+60; x < width; x +=40){
fill (255);rect(x, y,3,3); // draw rectangles
}} // each heart is where fish lay eggs. draw arrays of dots
// if needed divide up the line and treat the heart as item with two sides
// arrays converge in the middle
for(var y =13; y < height +30; y +=40){ // line 1 (left)
for(var x = width/2-19; x < width/2-10; x +=6){fill(255); //white dots
ellipse(x, y,1,1);}}for(var y =13; y < height +30; y +=40){ // line 1 (right)
for(var x = width/2+12; x < width/2+19; x +=6){fill(255);ellipse(x, y,1,1);}}for(var y =16; y < height +30; y +=40){ // line 2 (left)
for(var x = width/2-25; x < width/2-3; x +=6){fill(255);ellipse(x, y,1,1);}}for(var y =16; y < height +30; y +=40){ // line 2 (right)
for(var x = width/2+6; x < width/2+27; x +=6){fill(255);ellipse(x, y,1,1);}}for(var y =19; y < height +30; y +=40){ // line 3 (left)
for(var x = width/2-25; x < width/2-1; x +=6){fill(255); //white dots
ellipse(x, y,1,1);}}for(var y =19; y < height +30; y +=40){ // line 3 (right)
for(var x = width/2+6; x < width/2+26; x +=6){fill(255);ellipse(x, y,1,1);}}for(var y =22; y < height +30; y +=40){ // line 4 (left)
for(var x = width/2-24; x < width/2; x +=6){fill(255);ellipse(x, y,1,1);}}for(var y =22; y < height +30; y +=40){ // line 4 (right)
for(var x = width/2+5.5; x < width/2+26; x +=6){fill(255);ellipse(x, y,1,1);}}for(var y =25; y < height +30; y +=40){ // line 5 (left)
for(var x = width/2-29; x < width/2; x +=6){fill(255);ellipse(x, y,1,1);}}for(var y =25; y < height +30; y +=40){ // line 5 (right)
for(var x = width/2+4.5; x < width/2+31; x +=6){fill(255);ellipse(x, y,1,1);}}for(var y =28; y < height +30; y +=40){ // line 6 (left)
for(var x = width/2-28; x < width/2; x +=6){fill(255);ellipse(x, y,1,1);}}for(var y =28; y < height +30; y +=40){ // line 6 (right)
for(var x = width/2+3.5; x < width/2+32; x +=6){fill(255);ellipse(x, y,1,1);}}for(var y =31; y < height +30; y +=40){ // line 7 (left)
for(var x = width/2-26; x < width/2; x +=6){fill(255);ellipse(x, y,1,1);}}for(var y =31; y < height +30; y +=40){ // line 7 (right)
for(var x = width/2+2; x < width/2+29; x +=6){fill(255);ellipse(x, y,1,1);}}for(var y =34; y < height +30; y +=40){ // line 8
for(var x = width/2-24; x < width/2+26; x +=6){fill(255);ellipse(x, y,1,1);}}for(var y =37; y < height +30; y +=40){ // line 9
for(var x = width/2-21; x < width/2+24; x +=6){fill(255);ellipse(x, y,1,1);}}for(var y =40; y < height +30; y +=40){ // line 10
for(var x = width/2-12; x < width/2+17; x +=6){fill(255);ellipse(x, y,1,1);}}for(var y =43; y < height +30; y +=40){ // line 11
for(var x = width/2-8; x < width/2+10; x +=5){fill(255);ellipse(x, y,1,1);}}for(var y =46; y < height +30; y +=40){ // line 12
for(var x = width/2-4; x < width/2+7; x +=4){fill(255);ellipse(x, y,1,1);}}for(var y =49; y < height +30; y +=40){ // line 13
for(var x = width/2-2; x < width/2+4; x +=4){fill(255);ellipse(x, y,1,1);}}for(var y =52; y < height +30; y +=40){ // line 14
for(var x = width/2; x < width/2+2; x +=2){fill(255);ellipse(x, y,1,1);}}for(var y =55; y < height +30; y +=40){ // line 15
for(var x = width/2; x < width/2+2; x +=2){fill(255);ellipse(x, y,1,1);}}noLoop();}functiondrawGrid(){ //cover canvas with grid of ellipses
for(var y =20; y < height+40; y +=40){for(var x =20; x < width +40; x +=40){fill(249- x/2,145,145); // apply a color gradient to the circles
ellipse(x, y,40,40);}}}
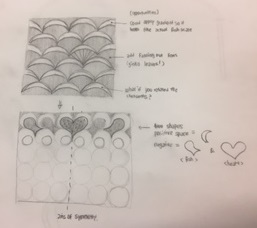
For this project, I wanted to apply learned concepts and use grids and loops. Using the same shape(ellipses) at different scales and varying the position of them, I created a flowing pattern that takes advantage of both positive and negative spaces. I basically created crescents by using two different ellipses and by putting them in a grid, I made it so that the negative space( in black) would read as fish shapes and hearts. The heart-shaped spaces in the middle are filled with fish eggs!
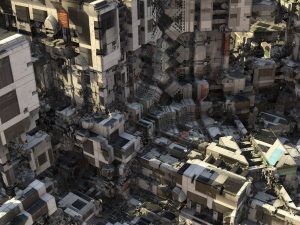
Danilton: The Brutal Deluxe is a computational art project that was created by visual artist, Daniel Brown. The project is basically a rendered image that was first based on some photographs that were manipulated with an algorithmic program that the author created himself. There is not much information on the specifics of this program that he made, but considering the known fact that he did not 3D model each building components, one can assume that he could have used a plug-in similar to Grasshopper.
end product
To generate the parasitic, massive buildings, Brown first plugged in random numbers to the program that produces the masses through fractal mathematics. He then searches for a particular area or geometries that he finds interesting within the randomly generated field, or 3D graph and adds to that particular shape. He basically gets the general from through algorithms and make the shapes even more complex and interesting by applying images of apartments from the 1970s and having the computer to generate infinite patterns, thereby creating a giant, maze-like cityscape that looks both retro and futuristic to a certain extent.
Brown has always been exploring with mathematical space before and after Danilton (2016), trying to create unlimited, boundless environments without constraints of physical building and modeling each component. The particular project and his other works clearly reflect his desire to use computational design as a means to discover and explore areas that were perhaps intangible. It is interesting how computer programs made something like creating a hyper-realistic image with tremendous amount of detail more plausible for artists.
More information on the project and other computational art by Daniel Brown can be found on his website: Daniel Brown
More images are available here: Daniel Brown Flickr
Superposition is a computational sound project that was directed by Japanese artist Ryoji Ikeda. Since its creation in 2012, Ikeda has premiered this project through four different mediums: installations, performance, concert, and dvd. Superposition was premiered at the MET in New York in 2012 and attracted a lot of attention from people for its unique concept.
The project is based on sine waves and impulses and is inspired by quantum mechanics. Although the superposition theorem in quantum physics is quite difficult to fathom completely, it could be said that it is about randomness. Components of Superposition are diverse and placed precisely, but Ikeda incorporates a bit of randomness through impulses.
elements of the performance
Superposition resembles nature in that sense. Performers, video clips, images, real time contents and more visual and sound elements are constantly in effect and then muted throughout the piece. Just like in the scientific world where particles in a superposition state can never be identified in one location, these sound waves are floating in multiple locations in different states. It is also parallel to how nature is everywhere. Even people are small parts of such a vast nature and they coexist at the same time, but are scattered all around the world.
Ikeda, as a visual and sound artist successfully abstracts the superposition theorem in a visually enticing way, using bursts of sounds and images. It is interesting how the artist attempted to describe a natural phenomenon through precise calculations and execute that in sounds. The concept of tracking back and substantiating nature through pure sine waves and impulses created by shortening sine waves is interesting.
More information can be found on the project’s webpage and the interview with Ryoji Ikeda.
//Jihee Kim
//15-104 MWF 9:30
//jiheek1@andrew.cmu.edu
//project4 string art
//section D
var backgroundRed; // Red value of background
var backgroundGreen =4; // Green value of background
var backgroundBlue =51; // Blue value of backgound
var lineR =187; // Red value of lines
var lineG; // Green value of lines
var lineB =239; // Blue value of lines
functionsetup(){createCanvas(400,300);}functiondraw(){ // background changes from navy blue to dark purple as mouse moves in x direction
background(backgroundRed, backgroundGreen, backgroundBlue);
backgroundRed =map(mouseY,0, height,5,37); // only R value changes
//color of lines change as mouse moves in X direction
lineG =map(mouseX,0, width,208,187); // only G value changes
// draw layers of folds that reveal a diamond at the end
// basic logic: thickest strokeweight = closest to front
// basic logic: i is greatest in the very back to draw less attention
var x =0; // position of x coordinate
var y =0; // position of y coordinate
// form curves that are closest and create the almond shape
for(var i =0; i <=400; i +=18){ //set the start, limit, spacing
stroke(lineR, lineG, lineB);strokeWeight(1.6); // thickest lineweight for the element in very front
line(x + i, height, width, height - i); // bottom right corner
strokeWeight(1.2); // second thickest lineweight
line(x + i, y, x, height - i); // top left corner
strokeWeight(0.8); // third thickest lineweight = 3rd closest to front
line(width/2+ i,0, width, i); // top right quadrant
line(width/2- i, height, x, height - i); // bottom left quadrant
strokeWeight(0.4); // fourth thickness = exists in the back
line(x + i, y, width, i); // top right corner
line(width - i, height, x, height - i); // bottom left corner
} // draw the diamond
for(var i =0; i <=400; i +=25){strokeWeight(0.25); // second to furthest element
// top left quadrant
line(width/2- i, height/2, width/2, i); // bottom left quadrant
line(width/2- i, height/2, width/2, height - i); // top right quadrant
line(width/2+ i, height/2, width/2, i); // bottom right quadrant
line(width/2+ i, height/2, width/2, height - i);} // overlay another diamond that moves
//spacing between loops varies with mouseY
spacing =map(mouseY,0, height,0,2);for(var i =0; i <=400; i +=25){strokeWeight(0.15); // furthest element
// top left quadrant
line(width/2- i, height/2* spacing, width/2, i * spacing); // bottom left quadrant
line(width/2- i, height/2* spacing, width/2, height - i * spacing); // top right quadrant
line(width/2+ i, height/2* spacing, width/2, i * spacing); // bottom right quadrant
line(width/2+ i, height/2* spacing, width/2, height - i * spacing);}}
For this project, I have created a drawing with multiple layers of folds and a diamond-like element by forming curves with lines.
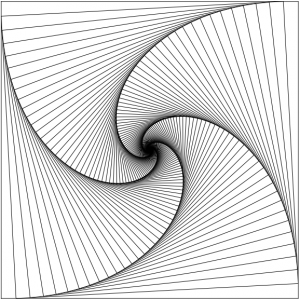
My inspiration for the project came from the pattern below.
inspiration
As the pattern above does, I wanted my project to show depth and I achieved that goal through varying the distance between loops and the stroke weight, creating a hierarchy that conveys a sense of depth. I wanted the viewer to clearly sense what is in front and what is in the back.
I also made the drawing more dynamic by controlling some motion of elements and color with the position of the mouse.
//Jihee Kim
//15-104 MWF 9:30
//jiheek1@andrew.cmu.edu
//project3 dynamic drawing
//section D
var backgroundRed =124;var backgroundGreen =124;var backgroundBlue =124;var angle =0;var move =0;var wbSize =100;functionsetup(){createCanvas(640,480);}functiondraw(){ //the background gets lighter in grayscale from left to right
background(backgroundRed, backgroundGreen, backgroundBlue);
backgroundRed =map(mouseX,0, width,0,124);
backgroundGreen =map(mouseX,0, width,0,124);
backgroundBlue =map(mouseX,0, width,0,124);if(mouseX > width){
backgroundRed =0;
backgroundGreen =0;
backgroundBlue =0;}if(mouseX <0){
backgroundRed =124;
backgroundGreen =124;
backgroundBlue =124;} //draw debris from destyoed buildlings floating, rotating in the air
fill(255);noStroke();push();translate(100,100);rotate(radians(angle));translate(move,0);ellipse(0,0,2,2); //particle rotates
pop();
angle = angle +2;
move = move +0.04;push();translate(280,190);rotate(radians(angle));translate(move,0);ellipse(0,0,3,3);pop();push();translate(25,60);rotate(radians(angle));translate(move,0);ellipse(0,0,2,2);pop();push();translate(500,20);rotate(radians(angle));translate(move,0);ellipse(0,0,2,2);pop();push();translate(320,20);rotate(radians(angle));translate(move,0);ellipse(0,0,2,2);pop();push();translate(50,20);rotate(radians(angle));translate(move,0);ellipse(0,0,2,2);pop();push();translate(555,175);rotate(radians(angle));translate(move,0);ellipse(0,0,3,3);pop();push();translate(545,172);rotate(radians(angle));translate(move,0);ellipse(0,0,1,1);pop();push();translate(530,172);rotate(radians(angle));translate(move,0);ellipse(0,0,1,1);pop();push();translate(190,140);rotate(radians(angle));translate(move,0);ellipse(0,0,2,2);pop();push();translate(185,110);rotate(radians(angle));translate(move,0);ellipse(0,0,4,4);pop();push();translate(20,400);rotate(radians(angle));translate(move,0);ellipse(0,0,5,5);pop();push();translate(400,320);rotate(radians(angle));translate(move,0);ellipse(0,0,5,5);pop();push();translate(375,335);rotate(radians(angle));translate(move,0);ellipse(0,0,5,5);pop(); //add some randomness to the particles
//position of the mouse will determine some particles' speed
push();if(mouseY >=240){rotate(millis()/100); //bottom half of canvas = fast spinning speed
}if(mouseY <=240){rotate(millis()/500); //top half of canvas = slow spinning speed
}translate(50,100);rotate(radians(angle));translate(move,0);ellipse(0,0,2,2);pop();push();if(mouseY >=240){rotate(millis()/100); //bottom half of canvas = fast spinning speed
}if(mouseY <=240){rotate(millis()/500); //top half of canvas = slow spinning speed
}translate(50,20);rotate(radians(angle));translate(move,0);ellipse(0,0,2,2);pop();push();if(mouseY >=240){rotate(millis()/100); //bottom half of canvas = fast spinning speed
}if(mouseY <=240){rotate(millis()/500); //top half of canvas = slow spinning speed
}translate(310,55);rotate(radians(angle));translate(move,0);ellipse(0,0,2,2);pop();push();if(mouseY >=240){rotate(millis()/100); //bottom half of canvas = fast spinning speed
}if(mouseY <=240){rotate(millis()/500); //top half of canvas = slow spinning speed
}translate(310,200);rotate(radians(angle));translate(move,0);ellipse(0,0,5,5);pop();push();if(mouseY >=240){rotate(millis()/100); //bottom half of canvas = fast spinning speed
}if(mouseY <=240){rotate(millis()/500); //top half of canvas = slow spinning speed
}translate(550,170);rotate(radians(angle));translate(move,0);ellipse(0,0,3,3);pop();push();if(mouseY >=240){rotate(millis()/100); //bottom half of canvas = fast spinning speed
}if(mouseY <=240){rotate(millis()/500); //top half of canvas = slow spinning speed
}translate(510,140);rotate(radians(angle));translate(move,0);ellipse(0,0,1,1);pop();push();if(mouseY >=240){rotate(millis()/100); //bottom half of canvas = fast spinning speed
}if(mouseY <=240){rotate(millis()/500); //top half of canvas = slow spinning speed
}translate(165,135);rotate(radians(angle));translate(move,0);ellipse(0,0,2,2);pop();push();if(mouseY >=240){rotate(millis()/100); //bottom half of canvas = fast spinning speed
}if(mouseY <=240){rotate(millis()/500); //top half of canvas = slow spinning speed
}translate(150,300);rotate(radians(angle));translate(move,0);ellipse(0,0,5,5);pop(); //a wrecking ball swings across the canvas and breaks buildings
//draw the chain (an array of same sized ellipses or 'beads')
//the swinging range beads increases from top to bottom
fill(0);var bx1 =map(mouseX,0, width,100,420); //limit of swing in x direction
var by1 =map(mouseY,0, height,0,20);ellipse(bx1, by1,20,20); //draw the first (top) bead of the chain
var bx2 =map(mouseX,0, width,98,424);var by2 =map(mouseY,0, height,20,40);ellipse(bx2, by2,20,20); //draw second bead of the chain
var bx3 =map(mouseX,0, width,95,428);var by3 =map(mouseY,0, height,40,60);ellipse(bx3, by3,20,20); //draw third bead of the chain
var bx4 =map(mouseX,0, width,92,432);var by4 =map(mouseY,0, height,60,80);ellipse(bx4, by4,20,20); //draw fouth bead of the chain
var bx5 =map(mouseX,0, width,88,440);var by5 =map(mouseY,0, height,80,100);ellipse(bx5, by5,20,20); //draw fifth bead of the chain
var bx6 =map(mouseX,0, width,84,452);var by6 =map(mouseY,0, height,100,120);ellipse(bx6, by6,20,20); //draw sixth bead of the chain
var bx7 =map(mouseX,0, width,79,468);var by7 =map(mouseY,0, height,120,140);ellipse(bx7, by7,20,20); //draw seventh bead of the chain
var bx8 =map(mouseX,0, width,74,480);var by8 =map(mouseY,0, height,140,160);ellipse(bx8, by8,20,20); //draw eighth bead of the chain
var bx9 =map(mouseX,0, width,68,502);var by9 =map(mouseY,0, height,160,180);ellipse(bx9, by9,20,20); //draw ninth bead of the chain
var bx10 =map(mouseX,0, width,62,528);var by10 =map(mouseY,0, height,180,200);ellipse(bx10, by10,20,20); //draw tenth bead of the chain
var bx11 =map(mouseX,0, width,56,555);var by11 =map(mouseY,0, height,200,220);ellipse(bx11, by11,20,20); //draw eleventh bead of the chain
//draw the wrecking ball
var wbx =map(mouseX,0, width,50,595);var wby =map(mouseY,0, height,220,265);ellipse(wbx, wby, wbSize, wbSize); //the wrecking ball gets bigger as it approaches both extremes of width
if(mouseX < width/2){
wbSize =((-mouseX+30)&(mouseY)); //gets bigger by left edge
}if(mouseX > width/2){
wbSize =((mouseX*0.5+50)&(mouseY)); //gets bigger by right edge
} //draw the buildings
//make so that buildings shrink when touched by wrecking ball
//building 1
if(mouseX >0& mouseX <45){fill(255);noStroke();rect(0, height-165,45,165); //building before being touched by ball
}else{fill(255);noStroke();rect(0, height-180,45,180); //building gets shorter by 15
} //draw windows
fill(0);rect(5, height-175,5,10); //row1
rect(15, height-175,5,10);rect(25, height-175,5,10);rect(35, height-175,5,10);rect(5, height-155,5,10); //row2
rect(15, height-155,5,10);rect(25, height-155,5,10);rect(35, height-155,5,10);rect(5, height-135,5,10); //row3
rect(15, height-135,5,10);rect(25, height-135,5,10);rect(35, height-135,5,10);rect(5, height-115,5,10); //row4
rect(15, height-115,5,10);rect(25, height-115,5,10);rect(35, height-115,5,10);rect(5, height-95,5,10); //row5
rect(15, height-95,5,10);rect(25, height-95,5,10);rect(35, height-95,5,10);rect(5, height-75,5,10); //row6
rect(15, height-75,5,10);rect(25, height-75,5,10);rect(35, height-75,5,10);rect(5, height-55,5,10); //row7
rect(15, height-55,5,10);rect(25, height-55,5,10);rect(35, height-55,5,10); //draw building 2
if(mouseX >55& mouseX <100){fill(255);noStroke();rect(55, height-145,45,145);}else{fill(255);noStroke();rect(55, height-160,45,160); //building gets shorter by 15
} //draw windows
fill(0);rect(60, height-155,5,10); //row1
rect(70, height-155,5,10);rect(80, height-155,5,10);rect(90, height-155,5,10);rect(60, height-135,5,10); //row2
rect(70, height-135,5,10);rect(80, height-135,5,10);rect(90, height-135,5,10);rect(60, height-115,5,10); //row3
rect(70, height-115,5,10);rect(80, height-115,5,10);rect(90, height-115,5,10);rect(60, height-95,5,10); //row4
rect(70, height-95,5,10);rect(80, height-95,5,10);rect(90, height-95,5,10);rect(60, height-75,5,10); //row5
rect(70, height-75,5,10);rect(80, height-75,5,10);rect(90, height-75,5,10);rect(60, height-45,5,10); //row6
rect(70, height-45,5,10);rect(80, height-45,5,10);rect(90, height-45,5,10);rect(60, height-25,5,10); //row7
rect(70, height-25,5,10);rect(80, height-25,5,10);rect(90, height-25,5,10); //draw building 3
if(mouseX >110& mouseX <160){fill(255);noStroke();rect(110, height-95,50,95);}else{fill(255);noStroke();rect(110, height-130,50,130); //building gets shorter by 35
} //draw windows
fill(0);rect(115, height-125,10,10); //row1
rect(130, height-125,10,10);rect(145, height-125,10,10);rect(115, height-110,10,10); //row2
rect(130, height-110,10,10);rect(145, height-110,10,10);rect(115, height-90,10,10); //row3
rect(130, height-90,10,10);rect(145, height-90,10,10);rect(115, height-75,10,10); //row4
rect(130, height-75,10,10);rect(145, height-75,10,10);rect(115, height-55,10,10); //row5
rect(130, height-55,10,10);rect(145, height-55,10,10);rect(115, height-40,10,10); //row6
rect(130, height-40,10,10);rect(145, height-40,10,10);rect(125, height-10,20,10); //row7
//draw building 4
if(mouseX >170& mouseX <210){fill(255);noStroke();rect(170, height-105,40,105);}else{fill(255);noStroke();rect(170, height-120,40,120); //building gets shorter by 15
} //draw windows
fill(0);rect(173, height-115,5,10); //row1
rect(183, height-115,5,10);rect(193, height-115,5,10);rect(203, height-115,5,10);rect(173, height-100,5,10); //row2
rect(183, height-100,5,10);rect(193, height-100,5,10);rect(203, height-100,5,10);rect(173, height-85,5,10); //row3
rect(183, height-85,5,10);rect(193, height-85,5,10);rect(203, height-85,5,10);rect(173, height-70,5,10); //row4
rect(183, height-70,5,10);rect(193, height-70,5,10);rect(203, height-70,5,10);rect(173, height-55,5,10); //row5
rect(183, height-55,5,10);rect(193, height-55,5,10);rect(203, height-55,5,10); //draw building 5
if(mouseX >225& mouseX <280){fill(255);noStroke();rect(225, height-90,55,90);}else{fill(255);noStroke();rect(225, height-100,55,100); //building gets shorter by 10
} //draw windows
fill(0);rect(230, height-95,5,5); //row1
rect(240, height-95,5,5);rect(250, height-95,5,5);rect(260, height-95,5,5);rect(270, height-95,5,5);rect(230, height-85,5,5); //row2
rect(240, height-85,5,5);rect(250, height-85,5,5);rect(260, height-85,5,5);rect(270, height-85,5,5);rect(230, height-75,5,5); //row3
rect(240, height-75,5,5);rect(250, height-75,5,5);rect(260, height-75,5,5);rect(270, height-75,5,5);rect(230, height-65,5,5); //row4
rect(240, height-65,5,5);rect(250, height-65,5,5);rect(260, height-65,5,5);rect(270, height-65,5,5);rect(230, height-55,5,5); //row5
rect(240, height-55,5,5);rect(250, height-55,5,5);rect(260, height-55,5,5);rect(270, height-55,5,5);rect(230, height-45,5,5); //row6
rect(240, height-45,5,5);rect(250, height-45,5,5);rect(260, height-45,5,5);rect(270, height-45,5,5);rect(230, height-35,5,5); //row7
rect(240, height-35,5,5);rect(250, height-35,5,5);rect(260, height-35,5,5);rect(270, height-35,5,5);rect(230, height-25,5,5); //row8
rect(240, height-25,5,5);rect(250, height-25,5,5);rect(260, height-25,5,5);rect(270, height-25,5,5);rect(230, height-15,5,5); //row9
rect(240, height-15,5,5);rect(250, height-15,5,5);rect(260, height-15,5,5);rect(270, height-15,5,5); //draw building 6
if(mouseX >290& mouseX <355){fill(255);noStroke();rect(290, height-100,65,100);}else{fill(255);noStroke();rect(290, height-120,65,120); //building gets shorter by 20
} //draw windows
fill(0);rect(295, height-95,15,10); //row1
rect(315, height-95,15,10);rect(335, height-95,15,10);rect(295, height-80,15,10); //row2
rect(315, height-80,15,10);rect(335, height-80,15,10);rect(295, height-65,15,10); //row3
rect(315, height-65,15,10);rect(335, height-65,15,10);rect(295, height-45,15,10); //row4
rect(315, height-45,15,10);rect(335, height-45,15,10);rect(295, height-30,15,10); //row5
rect(315, height-30,15,10);rect(335, height-30,15,10);rect(295, height-15,15,10); //row6
rect(315, height-15,15,10);rect(335, height-15,15,10); //draw building 7
if(mouseX >370& mouseX <415){fill(255);noStroke();rect(370, height-90,45,90);}else{fill(255);noStroke();rect(370, height-100,45,100); //building gets shorter by 10
} //draw windows
fill(0);rect(374, height-95,7,5); //row1
rect(384, height-95,7,5);rect(394, height-95,7,5);rect(404, height-95,7,5);rect(374, height-85,7,5); //row2
rect(384, height-85,7,5);rect(394, height-85,7,5);rect(404, height-85,7,5);rect(374, height-75,7,5); //row3
rect(384, height-75,7,5);rect(394, height-75,7,5);rect(404, height-75,7,5);rect(374, height-65,7,5); //row4
rect(384, height-65,7,5);rect(394, height-65,7,5);rect(404, height-65,7,5);rect(374, height-55,7,5); //row5
rect(384, height-55,7,5);rect(394, height-55,7,5);rect(404, height-55,7,5);rect(374, height-45,7,5); //row6
rect(384, height-45,7,5);rect(394, height-45,7,5);rect(404, height-45,7,5);rect(374, height-35,7,5); //row7
rect(384, height-35,7,5);rect(394, height-35,7,5);rect(404, height-35,7,5);rect(374, height-25,7,5); //row8
rect(384, height-25,7,5);rect(394, height-25,7,5);rect(404, height-25,7,5);rect(374, height-15,7,5); //row9
rect(384, height-15,7,5);rect(394, height-15,7,5);rect(404, height-15,7,5); //draw building 8
if(mouseX >425& mouseX <466){fill(255);noStroke();rect(425, height-95,41,95);}else{fill(255);noStroke();rect(425, height-110,41,110); //building gets shorter by 15
} //draw windows
fill(0);rect(428, height-105,5,10); //row1
rect(438, height-105,5,10);rect(448, height-105,5,10);rect(458, height-105,5,10);rect(428, height-88,5,10); //row2
rect(438, height-88,5,10);rect(448, height-88,5,10);rect(458, height-88,5,10);rect(428, height-71,5,10); //row3
rect(438, height-71,5,10);rect(448, height-71,5,10);rect(458, height-71,5,10);rect(428, height-54,5,10); //row4
rect(438, height-54,5,10);rect(448, height-54,5,10);rect(458, height-54,5,10); //draw building 9
if(mouseX >479& mouseX <530){fill(255);noStroke();rect(479, height-105,51,105);}else{fill(255);noStroke();rect(479, height-140,51,140); //building gets shorter by 35
} //draw windows
fill(0);rect(482, height-135,5,10); //row1
rect(492, height-135,5,10);rect(502, height-135,5,10);rect(512, height-135,5,10);rect(522, height-135,5,10);rect(482, height-115,5,10); //row2
rect(492, height-115,5,10);rect(502, height-115,5,10);rect(512, height-115,5,10);rect(522, height-115,5,10);rect(482, height-95,5,10); //row3
rect(492, height-95,5,10);rect(502, height-95,5,10);rect(512, height-95,5,10);rect(522, height-95,5,10);rect(482, height-75,5,10); //row4
rect(492, height-75,5,10);rect(502, height-75,5,10);rect(512, height-75,5,10);rect(522, height-75,5,10);rect(482, height-55,5,10); //row5
rect(492, height-55,5,10);rect(502, height-55,5,10);rect(512, height-55,5,10);rect(522, height-55,5,10);rect(482, height-35,5,10); //row6
rect(492, height-35,5,10);rect(502, height-35,5,10);rect(512, height-35,5,10);rect(522, height-35,5,10);rect(495, height-10,20,10); //row7
//draw building 10
if(mouseX >540& mouseX <585){fill(255);noStroke();rect(540, height-120,45,120);}else{fill(255);noStroke();rect(540, height-150,45,150); //building gets shorter by 30
} //draw windows
fill(0);rect(545, height-145,20,10); //row1
rect(570, height-145,10,10);rect(540, height-130,15,10); //row2
rect(560, height-130,10,10);rect(575, height-130,10,10);rect(540, height-115,5,10); //row3
rect(550, height-115,10,10);rect(565, height-115,20,10);rect(540, height-100,10,10); //row4
rect(555, height-100,20,10);rect(580, height-100,5,10);rect(540, height-85,5,10); //row5
rect(550, height-85,10,10);rect(565, height-85,20,10);rect(540, height-70,15,10); //row6
rect(560, height-70,10,10);rect(575, height-70,10,10);rect(545, height-55,20,10); //row7
rect(570, height-55,10,10);rect(540, height-40,15,10); //row8
rect(560, height-40,10,10);rect(575, height-40,10,10);rect(540, height-25,5,10); //row9
rect(550, height-25,10,10);rect(565, height-25,20,10);rect(540, height-10,10,10); //row10
rect(555, height-10,20,10);rect(580, height-10,5,10); //draw building 11
if(mouseX >595& mouseX <640){fill(255);noStroke();rect(595, height-110,45,110);}else{fill(255);noStroke();rect(595, height-135,45,135); //building gets shorter by 25
} //draw windows
fill(0);rect(602, height-125,10,10); //row 1
rect(622, height-125,10,10);rect(602, height-105,10,10); //row2
rect(622, height-105,10,10);rect(602, height-85,10,10); //row3
rect(622, height-85,10,10);rect(602, height-65,10,10); //row4
rect(622, height-65,10,10);rect(602, height-45,10,10); //row5
rect(622, height-45,10,10);}
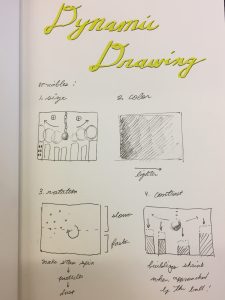
sketch
For my project, I made a dynamic drawing that is controlled by the mouse, or the user. I varied several elements, including size, color, rotation and position.
The user can move the wrecking ball to wherever in the canvas and manipulate the size of the buildings. One can see that the size of the ball itself changes, according to position as well. The size of the wrecking ball is largest when the mouse is located on both extremes of the width. The height of the buildings decreases when approached by the ball.
As for colors, as you move the mouse from left to right, the background changes from dark to light.
Another element that the mouse controls is the particles floating in air. It could be considered stars or dust. When the mouse is in the bottom half of the canvas, the particles rotate at a faster pace than they do when the mouse is in the top half of the canvas.
I would say that some challenges came from how tedious my design was. I also wish that I could have made the windows on the buildings to change color in the same fashion that the background does to keep it more consistent.
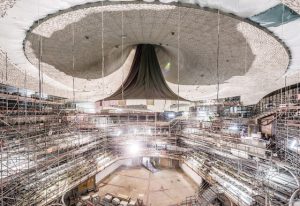
A design based on algorithms that interested me is the auditorium in the Elbphilharmonie, which is a concert hall in Hamburg designed by an architecture firm called Herzog and de Meuron and opened in 2017. The Elbphilharmonie is a complex that resembles a city; it offers many different attractions, such as the main philharmonic hall, music hall and restaurants.
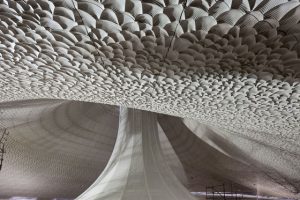
construction of the main auditoriuma closeup of individual, unique cells
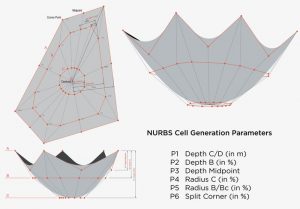
TThe building complex as a whole is extremely intricate, with its many geometries and attractive materiality but an area that is more impressive in regards to its use of technology would be the largest concert hall. The concert hall was created based on algorithms. Over 10 years, architects Jacques Herzog and Pierre de Mueron created about 10,000 gypsum fiber acoustic panels that cover the walls. Basically, the entire auditorium is covered in algorithmic, NURBS-based cells that look like shallow dugouts in the sand. The concave cells look like they were hand-carved, but were actually milled with CNC milling machines, based on precise calculations made computationally. The algorithm that lies underneath varies the characteristic of each cell so that individual cells play their unique role in handling the sounds and perfectly fill up the walls. Some of the variables here are depth, radius and splits, as seen in the image directly below.
variables of each carved cell
With the help of an acoustician (Yasuhisa Toyota) the architects were able to create and fabricate a space that insures the highest acoustic qualities that a music hall can ask for. The variations that the algorithm randomly creates within its parameters significantly affect the sound in the auditorium. Depending on the shape of the surface that sound waves hit, the sound gets manipulated differently: some are absorbed by the surface, while others are disseminated, ultimately creating a balanced harmonic sound.
Algorithms in this case allowed the firm to manifest its style of conveying through materials and complex geometries and suggest at infinite possibilities of creating structures that require such finesse that might not be achievable through manual work.
![[OLD FALL 2017] 15-104 • Introduction to Computing for Creative Practice](../../../../wp-content/uploads/2020/08/stop-banner.png)