monicah1-project-07-SectionA

sketch

var points = 5100;
var depth = 10;

function setup() {
  createCanvas(400, 400);
}

function draw() {
	background(0);

    translate(width /2, height/2);
    rotate(mouseX/2);
    drawParabolaCurve();
    drawHypotrocloid();
}   

function drawParabolaCurve() {
    strokeWeight(0.1);
    stroke(104,259,242);
    noFill()
    var Z = 6000;
    
    beginShape();
    for (var i = 0; i < points; i++) {

        var t = map(i, 10, points, 10, HALF_PI);
        var x = Z * pow(t,depth) / Z;
        var y = 2 * Z * t;

        vertex(x, y);
    }
    endShape();
    
}

function drawHypotrocloid() {
    var e = 100;
    var f = map(mouseX, 0, width, 0, 300);
    var g = e/map(mouseY, 0, height, 0, 300);

   
    beginShape();
        for (var i = 0; i < points; i++) {

            var angle = map(i, 0, points, 0, HALF_PI);
            var j = (e - f) * cos(angle) + f * cos (((e - g)/g)*angle);
            var k = (e - f) * sin(angle) - f * sin (((e - g)/g)*angle);

            vertex(j, k);
        }
    endShape();
}

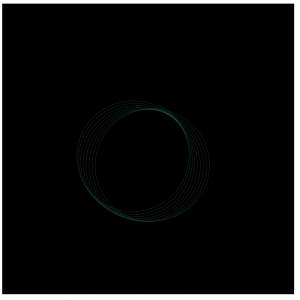
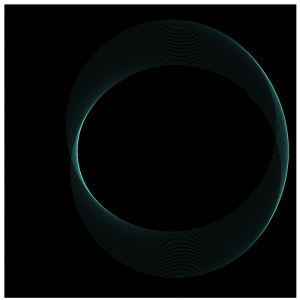
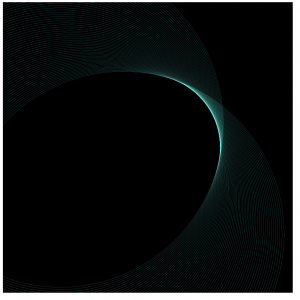
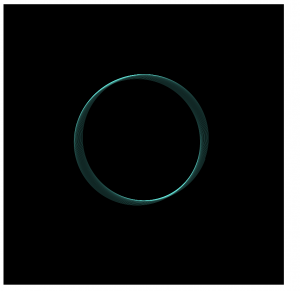
I usedParabolaCurve and Hypotrocloid in one visual, playing with stroke weight and dynamic behaviors. I like the mysterious, delicate, and sensual visual qualities.
monicah1-lookingoutward-07

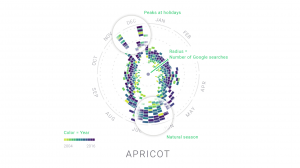
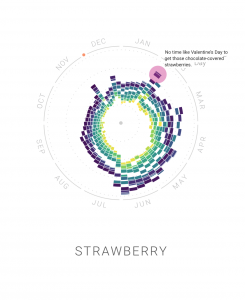
The Rhythm of Food by Moritz Stefaner

This project Mortiz Stefaner works on relating specific food and time of the year. For example, he looked at the human purchase behavior on apricot; The population of purchasing apricot, the amount they buy, and when they buy.

I am interested in this data visualization because I never seen data viz on specific food. When I really look into the visualization. The visual tells me so many information, like stories, seasons, demographic and more. When looking at data viz on strawberry, it interesting to see the anecdote on how strawberries relates to valentines. It would be interesting to see if people are keeping up with the tradition on certain holidays by looking at people behaviors when purchase food. Also, the data viz can clearly support people supply and demand needs.


monicah1-project-06

sketch

var prevSec;
var millisRolloverTime;

function setup() {
	createCanvas(400, 400);
	ellipseMode(CENTER);
	fill(255);
	noStroke();
}

function draw(){
	background(0);

	var H = hour();
    var M = minute();
    var S = second();

    if (prevSec != S) {
        millisRolloverTime = millis();
    }
    prevSec = S;
    var mils = floor(millis() - millisRolloverTime);

    var rotate1 = TWO_PI * noise(0.005*frameCount + 5);		
	var rotate2 = TWO_PI * noise(0.005*frameCount + 10);
	var rotate3 = TWO_PI * noise(0.005*frameCount + 15);
	var rx = 60 * noise(0.005*frameCount + 10);
	var tx = 200 * noise(0.005*frameCount + 20);
	var volume1 = 200 * noise(0.005*frameCount + 30);
	var volume2 = 50 * noise(0.005*frameCount + 30);

	var secondsWithFraction   = S + (mils / 1000.0);
    var secondsWithNoFraction = S;
    var secondBarWidthChunky  = map(secondsWithNoFraction, 0, 60, 0, width);
    var secondBarWidthSmooth  = map(secondsWithFraction,   0, 60, 0, width);

	translate(width/2, height/2);
	for (var i = 0; i < 10; i++) {
		push();
		rotate(rotate1 + TWO_PI * i / 3);
		translate(tx, 0);
		fill(0,255,60);
		ellipse(0, 0, volume1, volume2);
		for (var j = 0; j < 9; j++) {
			push();
			rotate(rotate2 + TWO_PI * j / 1);
			translate(rx, 0);
			rotate(rotate3);
			fill(250,250,0);
			ellipse(rx, 0, volume2, volume2);
			pop();
		}		
		translate()
		pop();
	}
}

I made a clock based on elements of rotation and noise.

monicah1-lookingoutward-06

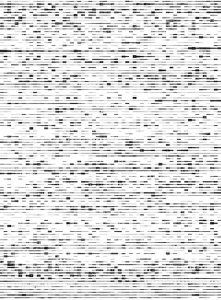
Nothing There by Brendan Dawes, 2004

Nothing There is a computational work made from the soundtrack within the movie, The Man Who Wasn’t There. In the piece, each element is dictate by the amount of sound present during that movie frame. The piece is a representation of silences and pauses within the film.

I is interested in the seemingly not organized, randomness, of this piece, is actually generated from a specific movie and specific timing within the movie. It is powerful to concise a movie silences and pauses frames visually in one piece. The black and white color choice add into to topic of silence. Looking at each element closely and standing back and look them as one piece of work, I do feel the pauses and silences that the Dawes want to represent. It is interest to see the precise informations generating the sense of randomness in the piece.

monicah1-project-05

sketch

function setup() {
    createCanvas(450, 450);
    background(10,125,185);
    noStroke();
    var tw = 60;
    var th = tw*(sqrt(3/2));
    var oy = 0;
    var ox = 0;
    var numc = 0;

    for (var y = 0; y < 10; y++) {
    	if (y%2==0){
        	numc = 10;
    	}
    	else {
    		numc = 9
    	}
        for (var x = 0; x < numc; x++) {
            var py = oy + y * th;
            var px = ox + x * tw;
     

		if (y%2 == 0){
			fill(210,255,0);
			ellipse(px,py,50,50);
			fill(255,0,160);
			rect(px,py,20,20);
		}
		else{
			fill(210,255,0);
			ellipse(px+30,py,50,50);
			fill(0,30,255);
			rect(px-10,py,40,40);
		}
		}
	}
}


I played with shapes, patterns, and colors. I liked playing with size and ratio, creating depth.

monicah1-lookingoutward-05

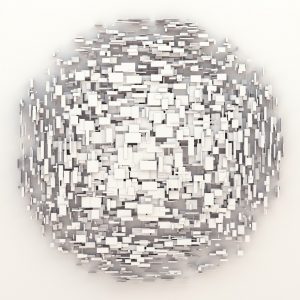
Nuclei::States_of_matter

Nuclei is made with varieties of medium Processing, c++, Koan3d,3Delight, Avisynth and Audacity. Nuclei is about space filling and field. It plays with several type of scalar fields size, ratio, density and orientation.

I am inspired and interested by the density and depth this piece creates. It seems like it can be create physically with paper or other medium. However the randomness and density of this piece help me realize it is made computationally. The piece creates the sense of unknown an mysteriousness with volume creating with one element but different sizes, ratio, and orientation. I wan to make something this intricate computationally.

monicah1-project-04

sketch

var x = 100;
var y = 10;

function setup() {
    createCanvas(400, 300);
    strokeWeight(2);
}

function draw() {
	background(0);
	for (var i = 10; i<50; i+=5){
		strokeWeight(1);
		stroke("blue");
		line(mouseX, i*y,i*y, mouseY);
	}
	for (var i = 20; i<70; i+=5){
		strokeWeight(2);
		stroke("yellow");
		line(mouseX, i*y,i*y, mouseY);
	}
	for (var i = 30; i<80; i+=5){
		strokeWeight(3);
		stroke("green");
		line(mouseX, i*y,i*y, mouseY);
	}
	for (var i = 40; i<90; i+=5){
		strokeWeight(3);
		stroke("red");
		line(mouseX, i*y,i*y, mouseY);
	}
	for (var i = 40; i<90; i+=5){
		strokeWeight(3);
		stroke("yellow");
		line(mouseY, i*y,i*y, mouseX);
	}
	for (var i = 30; i<80; i+=5){
		strokeWeight(3);
		stroke("blue");
		line(mouseY, i*y,i*y, mouseX);
	}
	for (var i = 20; i<70; i+=5){
		strokeWeight(2);
		stroke("red");
		line(mouseY, i*y,i*y, mouseX);
	}
}

I played with the angles, colors, and movements.

monicah1_lookingoutward_04

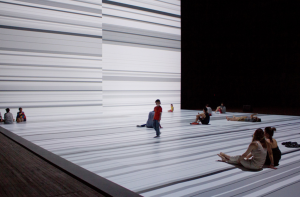
Ryoji Ikeda- The Transfinite

Ryoji Ikeda, japanese artist and electronic composer, installed The Transfinite at the park avenue armory in new york city. The installation is about the concept of infinity, rationality, and the beauty of data. In real time, it presents the analysis of artists’ soundtrack in visual and audio, a combination of music and mathematics. I went to one of his installation in downtown pittsburgh last year. The experience was like nothing else that I had before. It was beautiful to hear the music with no lyrics, moreover, looking at the digital installation matching the music was extraordinary. It was a wonderful experience both physically and digitally. The amazing part is that the digital visual and audio was created by our daily datas. I imagined I might be part of the installation too.

monicah1-project-03

sketch

var x;
var y;
var offset = 300;

function setup() {
    createCanvas(640, 480);
    ellipse (CENTER);

}

function draw() {
	background (245,255,0);
	fill (30,255,0);
	noStroke();

	var m = max (min(mouseX, 640), 0);
	var size = m *100.0 / 200.0;
	ellipse (10 + m *190.0 / 400.0, 200.0, size, size);

	fill (0,0,255);
	size = 350 - size;
	ellipse(200 + m * 190.0/400.0, 200.0. size, size);
	ellipse (10 + m *190.0 / 250.0, 200.0, size, size);
	ellipse (40 + m *190.0 / 100.0, 150.0, size, size);

	fill (240,70,20);
	rect (40 + m *300.0 / 100.0, 150.0, size, size);
	rect (50 + m *100.0 / 50.0, 70.0, size, size);


	var line1 = map(mouseY, 100, 400, 76, 310);
    stroke(240, 10, 150);
    strokeWeight(10);
    line(240, line1, 240, 311);


    var line2 = map(mouseY, 100, 400, 76, 312);
    stroke(240, 10, 150);
    strokeWeight(10);
    line(252, line1, 253, 313);

    var line3 = map(200, mouseY, 400, 76, 310);
    stroke(240, 10, 150);
    strokeWeight(10);
    line(240, line4, 240, 311);


    var line4 = map(200, mouseY, 400, 76, 312);
    stroke(240, 10, 150);
    strokeWeight(10);
    line(252, line2, 253, 313);


    noStroke();
  
 
    fill(255);
    ellipse(mouseX, 100, 60, 60);

    fill(0);
    ellipse(width - mouseX, 200, 60, 60);

    if (mouseX > x) {
    	x += 10;
    	offset = -10;
    }

    if (mouseX > x){
    	x -= -10;
    	offset = 10;
    }

}

I tried to play with depth, rotation, and colors of objects in this assignment.

monicah1_lookingoutward_03

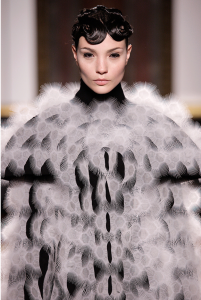
Digital Fabrication by Iris Van Herpen Collaborated with Neri Oxman and Julia Koerner at 2013 Paris Fashion week.

The inspiration of Iris Van Herpen coulture is inspired by nature, generating augmentation and thinking about form, materials, movement, and wearability. They work on designing algorithm that centered by humans’ moment and material behavior.

I am impressed by the high fidelity of work that is possible in computational and 3D fabrication. Often times, we may not be able to control what the computational work would produced base on algorithms. Here, the computational work is closely human form centered, which is amazing. High craftsmanship with 3D fabrication can powerfully apply on so many things. This fashion work of line show how technology is already advanced, hoping 3D fabrication can integrated to common people.