LookingOutward-07

For this weeks project, I chose a project with athenahealth. Fathom, a design firm focused on creating visuals that show data, partnered alongside athenahealth to create a visual showing how patients move through their healthcare network. The application divides patients’ interaction into four parts: practice, patient, orders, and payers.

Four parts of patient interaction with healthcare network.

Practice includes initial patient exchanges with caregivers, patient includes the patient’s individual interaction with the online health portal, orders include orders and lab transactions, and payers include payer transactions like processing of insurance claims.

When in action, the application has a series of dots that appear and float around the screen between the various groups, changing colors according to the category and where it is.

I find this application very visually pleasing and creative compared to many other data displaying applications. It’s easy to revert to a graphical display of data, but this application uses a much more original visual. Standing alone, the application can easily catch peoples eyes and be a work of art. However, in reality it displays data in a way that shows relationships and connections between various areas of the healthcare network.

https://fathom.info/athenahealth/

rfarn-project-07-curves

I started this project by simply creating basic curves. I started with the astroid curve.

However, I wasn’t inspired by this simple curve so I decided to explore some other curves. I came across the epitrochoid curve.

I decided to add a simple interaction, increasing the general radius as well as the loop sizes as the mouse moves from side to side. Then I added the astroid curve back on top as a little embellishment.

sketch

function setup() {
    createCanvas(480, 480);
}

function draw() {
    background(36, 7, 26);
    translate(width/2, height/2); //moves curves from (0,0) center to center of canvas
    epitrochoid(); //draws epitrochoid curve
    astroid(); //draws radial astroid curve

}

function epitrochoid() {
    var b = 5; 
    var h = (b * 4) + mouseX/4; //change as mouse moves from side to side
    var a = 30 + mouseX/3;

    fill(107, 77, 87);
    strokeWeight(2);
    stroke(221, 200, 196);
    beginShape();
    for(var t = 0; t < 2 * PI; t += PI/500){ //1000 points along circle
        var x = (a + b) * cos(t) - h * cos(((a + b)/b) * t); //x coordinate
        var y = (a + b) * sin(t) - h * sin(((a + b)/b) * t); //y coordinate
        vertex(x, y);
    }
    endShape(CLOSE);
}

function astroid() {
    var a = 25 + mouseX/2; //changes as mouse moves from side to side

    noFill();
    strokeWeight(10);
    stroke(107, 77, 87);
    beginShape();
    for(var t = 0; t < 2 * PI; t += PI/500){ //1000 points along circle
        var x = a * pow(cos(t), 3); //x coordinate
        var y = a * pow(sin(t), 3); //y coordinate
        vertex(x, y);
    }
    endShape(CLOSE);
}

LookingOutwards-06

For this week’s looking out post, I decided to use Piet Mondrian’s piece: Composition No. 10 Pier and Ocean, created in 1915.

The inspiration behind this piece was the rhythms created by the waves in the ocean hitting and splashing against pier. However, he uses a randomness to illustrate the rhythm and feel of the pier and ocean. From first impression, one would view Mondrian’s piece as a very random, abstract piece. In reality, the “randomness” behind his work is a very calculated randomness.

Mondrian considered art as a reflection of the spirituality of nature. By creating artwork that was stripped down to the very basics, he hopes to show the energy and balance of the forces in nature. He used simple vertical and horizontal shapes to represent the positive and negative universal energies. Every line and space in his works is carefully placed to reflect the energies of nature and recreate the balance in a visual form.

http://www.piet-mondrian.org/pier-and-ocean.jsp

rfarn -Project-06-AbstractClock

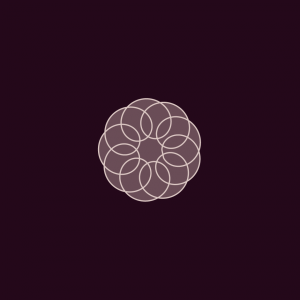
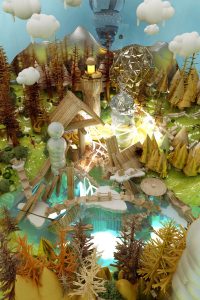
For this project, it took me a while to figure out what I wanted to do. At first I was stuck on the idea of a clock being circular and thought of creating a flower with petals to represent hours, minutes and seconds. However, I thought this wasn’t abstract enough. After pondering for a bit, I came up with the idea of creating a landscape with certain parts that would gradually change over time. At first, I thought of just creating a natural landscape with a sun, river, and mountains, but I felt this wasn’t personalized enough.

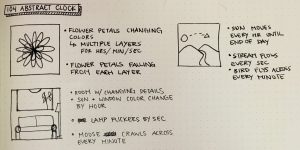
While thinking of what to do, I was siting at my kitchen table staring at the couch across from me and out my window. I finally decided to take inspiration from my own room and create an image of this view of the room. I decided to add a few different fun features to the actual clock.

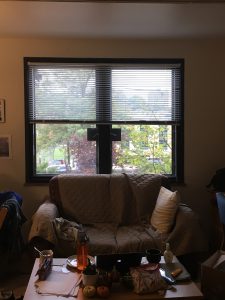
In the abstract clock, the light turns on and off by the second, the sky and sun shift by the hour, and the mouth of the couch gradually opens by the minute.

sketch

function setup() {
    createCanvas(480, 400);
}

function draw() {
	background(164, 158, 141);
	var h = hour();

//window assembly
	var windowM = 80; //margins on sides of window (distance from edge of canvas to edge of window)
	var windowW = 320; //width of window
	var windowH = 240; //height of window
	
	if(h > 0 & h < 13){ //sky brightens from 1am - 12pm
		var skyR = h * (167/12); //red
		var skyG = h * (206/12); //green
		var skyB = h * (214/12); //blue
	} else { //sky darkens from 1pm - 12am
		var skyR = 167 - (h - 12) * (167/12); //red
		var skyG = 206 - (h - 12) * (206/12); //green
		var skyB = 214 - (h - 12) * (214/12); //blue
	}

	//window
	noStroke();
	fill(skyR, skyG, skyB);
	rect(windowM, 0, windowW, windowH);
	strokeWeight(10);
	stroke(60, 61, 59);
	line(windowM, 0, windowM, windowH); //left border
	line(windowM + windowW, windowH, windowM + windowW, 0); //right border

	//sun
	var sunDiam = 100; //diameter of sun
	var sunX = width/2; //x position of sun

	if(h > 0 & h < 13){ //sun rises from 1am-12pm
		var sunY = (windowH + sunDiam/2) - h * ((windowH + sunDiam)/12);
	} else { //sun lowers from 1pm-12am
		var sunY = -sunDiam/2 + (h - 12) * ((windowH + sunDiam)/12); //y position of sun
	}
	
	if(h > 0 & h < 13){ //sun brightens from 1am-12pm
		var sunR = h * (211/12); //red
		var sunG = h * (130/12); //green
		var sunB = h * (115/12); //blue
	} else { //sun darkens from 1pm-12am
		var sunR = 211 - (h - 12) * (211/12); //red
		var sunG = 130 - (h - 12) * (130/12); //green
		var sunB = 115 - (h - 12) * (115/12); //blue
	}

	noStroke();
	fill(sunR, sunG, sunB);
	ellipse(sunX, sunY, sunDiam, sunDiam);

	
//couch
	var couchR = 228; //couch red
	var couchG = 231; //couch green
	var couchB = 189; //couch blue
	var cushionW = 180 - minute() * (140/60); //changing width of cushion
	var cushionR = 240 + minute() * (140/60); //changing x position of right cushion

	strokeWeight(5);
	stroke(couchR - 10, couchG - 10, couchB - 10);
	fill(couchR, couchG, couchB);
	rect(60, windowH - 10, 360, height - windowH + 10, 40);	//back of couch
	
	//couch face
	noStroke();
	fill(211, 130, 115);
	rect(60, windowH + 65, 360, 75); //mouth gums
	strokeWeight(30);
	stroke(261, 80, 65);
	line(120, 345, 360, 345); //mouth
	fill(255);
	noStroke();
	rect(210, 330, 20, 20); //tooth right
	rect(250, 330, 20, 20); //tooth left
	ellipse(140, 270, 30, 40); //eye white left
	ellipse(340, 270, 30, 40); //eye white right
	fill(0);
	ellipse(340, 275, 20, 20); //pupil left
	ellipse(140, 275, 20, 20); //pupil right

	//cushions
	strokeWeight(5);
	stroke(couchR - 10, couchG - 10, couchB - 10);
	fill(couchR, couchG, couchB);
	rect(60, windowH + 65, cushionW, 75, 20); //left cushion
	rect(cushionR, windowH + 65, cushionW, 75, 20); //right cushion
	rect(50, 260, 40, 200, 40); //left arm rest
	rect(width - 90, 260, 40, 200, 40); //right arm rest

//lamp
	noStroke();
	if(second() % 2 == 0){ //turns on every other second
		fill(242, 239, 199);
		rect(440, 60, 50, 100);
	} else {
		fill(100);
		rect(440, 60, 50, 100);
	}
	fill(60, 61, 59); 
	rect(470, 160, 20, 400); //lamp stand
}

LookingOutward-05

For my 3D computer graphics project, I choose to feature the work of Alex McLeod. I’m using his piece, Mystical Pond 2010 as my example, but I admire his work as a whole in general.

Alex McLeod is a new media visual artist who creates landscape “paintings” through computer rendering. He uses renderings of various materials and textures to create romantic, otherworldly landscapes. Through his art, he uses reoccurring themes such as overpopulation, urban overdevelopment, and climate change.

I view artists such as Alex McLeod as a bridge between traditional artists and modern graphic animators. McLeod treats his work similar to that of traditional artists, trying to convey a message with no limits or boundaries to his work. However, he uses modern technologies and modern “materials”/mediums to create his art.

http://www.alxclub.com/

rfarn-Project-05-wallpaper

Before beginning to code my wallpaper, I looked around online for inspiration. A lot of the online patterns I found incorporated organic and complex shapes. For my wallpaper, I wanted to focus on the use of for loops and repetition of simple shapes. I made a few rough sketches to help visualize what I needed to code.

I decided to use the last thumbnail sketch as a basis for my actual coded wallpaper design. After coding the shapes, I then went and played around with different colors.

sketch

function setup() {
    createCanvas(480, 480);
    background(121, 128, 113);

    //creating circular pattern
    var cdiam = width/5; //diameter of circles
    var spacex = 3 * cdiam / 4; //space between in x direction
    var spacey = 4 * cdiam / 3; //space between in y direction
    var ox = (width - (spacex * 6))/2; //x position
    var oy1 = (height - (spacey * 3))/2; //y position for every odd column
    var oy2 = oy1 - 2 * cdiam / 3; //y position for every other column

    for(var x = 0; x < 7; x++){ 

        var posx = ox + x * spacex; //x position consistent

        if(x % 2 == 1){
            for(var y = 0; y < 4; y++){ //4 circles
                fill(210, 213, 221);
                strokeWeight(10);
                stroke(153, 154, 198);

                var posy1 = oy1 + y * spacey; //y position of odd columns

                ellipse(posx, posy1, cdiam, cdiam);
            }
        } else {
            for(var y = 0; y < 5; y++){ //5 circles
                fill(184, 186, 207);
                strokeWeight(10);
                stroke(153, 154, 198);

                var posy2 = oy2 + y * spacey; //y position of even columns

                ellipse(posx, posy2, cdiam, cdiam);
            }
        }
    }

    //creating line pattern
    var lineox = ox + spacex/2; //original x position of lines
    var lineoy = oy1 - spacey/4; //original y position of lines

    for(var xline = 0; xline < 6; xline++){ // 6 vertical lines
        strokeWeight(5);
        stroke(232, 235, 228);

        var posVline = lineox + spacex * xline; // position of vertical lines

        line(posVline, 0, posVline, height);
    }

    for(var yline = 0; yline < 8; yline++){ // 8 horizontal lines
        strokeWeight(5);
        stroke(232, 235, 228);

        var posHline = lineoy + spacey/2 * yline; //position of horizontal lines

        line(0, posHline, width, posHline);
    }

    //creatings dots
    for(var dotsx = 0; dotsx < 6; dotsx++){
        for(var dotsy = 0; dotsy < 8; dotsy++){

            var posxdots = lineox + spacex * dotsx; //position of dots in x direction
            var posydots = lineoy + spacey/2 * dotsy; //position of dots in y direction

            noStroke();
            fill(121, 128, 113);
            ellipse(posxdots, posydots, 15, 15);
        }
    }

    noLoop();
}

function draw(){

}

Looking Outward-04

For sound art, I found a project called The Classyfier. This project was created by Benedict Hubener, Stephanie Lee and Kelvyn Marte at the CIID.

The Classyfier is a table shaped speaker that detects what type of beverage people are drinking and plays a certain playlist according to the beverage. The speaker picks up on cue noises, such as the clinking of wine glasses or the popping open of a beer can.

I find this project inspiring because of the aspect of machine learning. The machine picks up on certain sound characteristics and compares it to a catalogue of sounds preprogrammed into it. From there, it is able to connect the suitable playlist and play the right music. In addition, the table has a feature where the user can knock on the tabletop to skip to the next song. This project connects very human understandings such as genres, mood, vibes, to a very robotic calculation. From a simple sound characteristic, a computer program is able to emulate the mood of drinking a relaxing glass of wine or cracking a cold beer with a pal.

Link

rfarn-Project-04-StringArt

My string art design is fairly simple. Once understanding the concept of a for loop, I was able to quickly apply it to the creation of this string art. There were only a few small problems I faced, such as having to reverse the direction of the increments by subtracting them from the height. Besides little technical/syntax troubles, the overall project was quick and straight forward.

sketch

var yincrement = 15; //increments along y-axis
var xincrement = 20; //increments along x-axis
var x1position = 1; //points constantly flush left
var y1position = 299; //points constantly flush bottom
var x2position = 399; //points constantly flush right
var y2position = 1; //points constantly flush top

function setup(){
    createCanvas(400, 300);
    background(0);
}

function draw() {
	for(var i = 0; i < 21; i += 1) {
		strokeWeight(0.5);
		stroke(255); //white
		line(x1position, yincrement * i, xincrement * i, y1position); //lines between left and bottom
		stroke(255, 0, 0); //red
		line(x2position, yincrement * i, xincrement * i, y2position); //lines between right and top
		stroke(0, 255, 0); //green
		line(xincrement * i, y1position, x2position, height - yincrement * i); //lines between bottom and right
		stroke(0, 0, 255); //blue
		line(x1position, height - yincrement * i, xincrement * i, y2position); //lines between top and left
	}
}

LookingOutwards-03

For my computational digital fabrication project, I found a 3D printing self-folding electronics project. As the name explains, the project focuses on 3D printing structures that can fold up on their own.

They use various techniques such as a structure that folds as a reaction to water or a structure that buckles and compresses due to changes in membrane of material in certain areas. The point of the project is that the mechanisms causing the material to fold are introduced during the 3D printing process. Once 3D printed, the piece already has the ability to self-fold. I find it interesting how the self-folding aspect is integrated into the piece as it is printed. A more robotic self-folding mechanism would be made up of multiple pieces with complex structures, electronics and programming. However, this is a much more advanced, intricate alternative. It introduces more scientific aspects, looking in depth at the formation and structure of the material and experimenting with various ingredients.

link

rfarn Project-03

For this project, I struggled with figuring out where to start with my coding. The assignment was fairly open and creative, so it was hard to come up with an idea on the spot for what I wanted to do. I played around with stationary shapes and then incorporated some transformations and movement to create a dynamic drawing.

sketch

var w1 = 40;
var h1 = 40;
var w2 = 40;
var h2 = 40;
var w3 = 40;
var h3 = 40;
var w4 = 40;
var h4 = 40;
var R = 105;

function setup() {
    createCanvas(640, 480);
}

function draw() {
    background(R, 98, 109);
    noStroke();
    
    
    if(mouseX < 640  & mouseX > 0){ //changing background color
        R = mouseX * (1/4);
    }

    fill(232, 199, 222); //top circle
    ellipse(width/2, height/4, w1, h1);
    if(mouseX > width/2 - w1/2 & mouseX < width/2 + w1/2 && 
       mouseY > height/4 - h1/2 && mouseY < height/4 + h1/2 && 
       dist(mouseX, mouseY, width/2, height/4) < w1/2) { //when mouse is in border of circle
        w1 += 5;//grows bigger
        h1 += 5;
    } else { if(w1 > 40 & h1 > 40){ //shrinks back down to 40 x 40
        w1 -= 5;
        h1 -= 5;
        }
    }

    fill(217, 189, 197); //right circle
    ellipse(width * (3/4), height/2, w2, h2);
    if(mouseX > width * (3/4) - w2/2 & mouseX < width * (3/4) + w2/2 && 
       mouseY > height/2 - h2/2 && mouseY < height/2 + h2/2 && 
       dist(mouseX, mouseY, width * (3/4), height/2) < w2/2) { //when mouse is in border of circle
        w2 += 5; //grows bigger
        h2 += 5;
    } else { if(w2 > 40 & h2 > 40){ //shrinks back down to 40 x 40
        w2 -= 5;
        h2 -= 5;
        }
    }

    fill(203, 190, 179); //bottom circle
    ellipse(width/2, height * (3/4), w3, h3);
    if(mouseX > width/2 - w3/2 & mouseX < width/2 + w3/2 && 
       mouseY > height * (3/4) - h3/2 && mouseY < height * (3/4) + h3/2 && 
       dist(mouseX, mouseY, width/2, height * (3/4)) < w3/2) { //when mouse is in border of circle
        w3 += 5; //grows bigger
        h3 += 5;
    } else {if(w3 > 40 & h3 > 40){ //shrinks back down to 40 x 40
        w3 -= 5;
        h3 -= 5;
        }
    }

    fill(188, 175, 156); //left circle
    ellipse(width/4, height/2, w4, h4);
    if(mouseX > width/4 - w4/2 & mouseX < width/4 + w4/2 && 
       mouseY > height/2 - h4/2 && mouseY < height/2 + h4/2 && 
       dist(mouseX, mouseY, width/4, height/2) < w4/2) { //when mouse is in border of circle
        w4 += 5; //grows bigger
        h4 += 5;
    } else { if(w4 > 40 & h4 > 40){ //shrinks back down to 40 x 40
        w4 -= 5;
        h4 -= 5;
        }
    }

    fill(255); //white dots
    ellipse((mouseX - width/5) * 2, (mouseY - height/5) * 2, 15, 15);
    ellipse((mouseX - width/5) * 2, (mouseY + height/5) * 2, 15, 15);
    ellipse((mouseX + width/5) * 2, (mouseY - height/5) * 2, 15, 15);
    ellipse((mouseX + width/5) * 2, (mouseY + height/5) * 2, 15, 15);
    

}