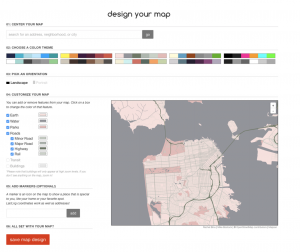
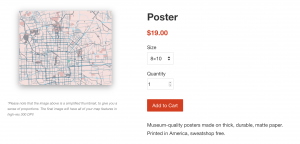
ManyMaps is one of the custom software created by Rachel Binx. She is currently working at Netflix, with the content Science & Algorithms team in Los Angeles. She is an American data visualizer, developer, and designer. She is the co-founder of Meshu and Gifpop, two companies that create physical objects, such as maps and animated GIFs, from social data. For this particular project, it is a site for designing our own map prints. The site is built on Shopify, and Rachel Binx made the site end-to-end, including concept, frontend and backend code, visual design, and photography. It is made possible by OpenStreetMap, which is the largest open-source mapping community in the world. The individual data tiles come from Mapzen, an open-source mapping company. All of the posters and canvas prints are made in the USA.
Overall, I really enjoyed this software/website as I am able to create my own design of the place I like. For example, the place I chose there is Beijing, China where is my hometown. By selecting my favorite colors with the important location, I was able to build a connection with the place even though I am not physically there.
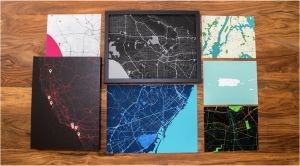
The design page for the users creating their dream map | updated 2017The poster I designed for my hometownThe samples/art works presented on the website
//Clair(sijing) Sun
//session C
//sijings@andrew.cmu.edu
//Assignment-06-compositionwithCurve

var t=0;
var r=60;
var curveP1;
var curveP2;
var color1=141;
var color2=141;

function setup() {
  createCanvas(480, 480);
}

function draw() {
  var t=map(mouseY, 0, height/4, height/2, height/4);//constrain it between hieght/2 and height/3
  background(156,170,164);
  noStroke();
  var limit;//curve for determining how many times we want to rotate
  if (mouseX<width/2){
    limit=map(mouseX,0,width/2,0,16);
  }else{
    limit=map(mouseX, width/2, width,16,0);
  }
  for (var num=0;num<limit;num++){//set limit as our limit for iteration
    //leafs
    angleMode();
    fill(200,195,167);
    arc(50, 50, 140, 140, 180, 270,CHORD);//all used chord becuase we need to create
    arc(50, 80, 140, 140, 200, 270,CHORD);//a effect of leaves
    arc(width-50, height-50, 140, 140, 180, 270,CHORD);
    arc(width-50, height-80, 140, 140, 200, 270,CHORD);
    fill(104,103,78);
    arc(50, 70, 160, 140, 30, 0,CHORD);
    arc(60, -90, 260, 240, 190,40, CHORD);
    arc(width-50, height-30, 160, 140, 30, 0,CHORD);
    arc(width-50, height-90, 260, 240, 190,40, CHORD);
    fill(203,169,111,70);
    arc(30, -40, 260, 240, 190,40, CHORD);
    arc(20, 70, 140, 140, 180, 270,CHORD);
    arc(55, 115, 140, 140, 200, 270,CHORD);
    arc(width-150, height-90, 260, 240, 190,40, CHORD);
    arc(width-20, height-70, 140, 140, 180, 270,CHORD);
    arc(width-55, height-115, 140, 140, 200, 270,CHORD);
    fill(212,202,144);
    arc(50, 120, 240, 240, 200, 270,CHORD);
    arc(width-115, height-120, 240, 240, 200, 270,CHORD);
    fill(104,103,78,100);
    arc(-20, 90, 160, 140, 30, 0,CHORD);
    arc(20, -90, 260, 240, 190,40, CHORD);
    arc(width-80, height-90, 160, 140, 30, 0,CHORD);
    arc(width-80, height-90, 260, 240, 190,40, CHORD);

  //inner loop for drawing the actual curve
    for (var i=0;i<670;i++){
      r=mouseX/5;//set the radius to continue change
      if (num%4==0){//set different conditions for determing which direction we want
        var x=r*cos(t)*(1+cos(t));
        var y=r*sin(t)*(1+cos(t));
      }
      if (num%4==1){
        var x=r*cos(t)*(1-cos(t));
        var y=r*sin(t)*(1-cos(t));
      }
      if (num%4==2){
        var x=r*sin(t)*(1+cos(t));
        var y=r*cos(t)*(1+cos(t));
      }
      if (num%4==3){
        var x=r*sin(t)*(1-cos(t));
        var y=r*cos(t)*(1-cos(t));
      }
      t+=0.97;
      curveP1=width/2+num*2+x-12;//circles position x
      curveP2=height/2+num+y;//circles position y
      if (mouseX<width/2){
        var color1=map(mouseX, 0, width/2, 200, 74);//set conditions for changing color
        var color2=map(mouseX, 0, width/2, 121, 36);
      }else{
        var color1=map(mouseX, width/2, width, 80,200);
        var color2=map(mouseX, width/2, width, 35,121);
      }

      rotate(PI/5.0);//for rotating shape
      fill(255,color1,color2,255-mouseX/3);
      var size=map(mouseX,width/2,width,2,10);//also constrain size
      ellipse(curveP1,curveP2,size,size);
    }

  }


}
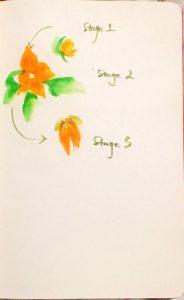
sketch before starting the project
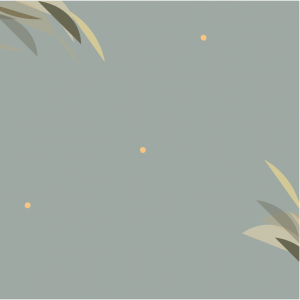
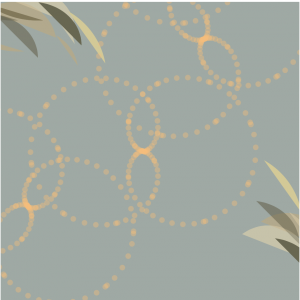
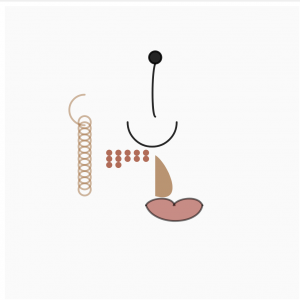
For this project, I wanted to express the idea a flower is blooming and then dying based on our mouse movement from left of the canvas to the right. So we can see there are changes of the number of petals (increase when mouseX approaching to the center of the canvas) and decreases when mouseX leaving the center of the canvas and going to the edge. With this movement, there are also changes in color, opacity, size, and the position of each dots. The audience can play this interactive work by rotating the flower and seeing how they can transform a flower from born to death. There are also some leaves being created for decoration. Here are some screenshots of the different states of the flower.
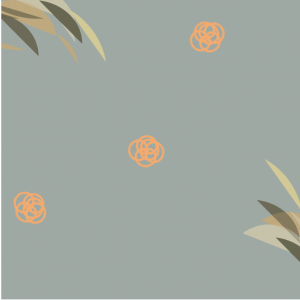
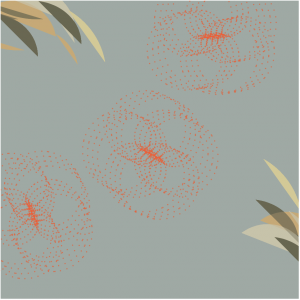
when the flower first appear, color-light orangeWhen flowers get bigger and curves appear, color becomes darker orangewhen flower bloom and become orange red
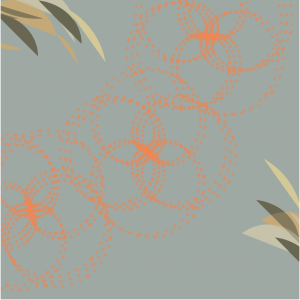
The final state of the curves, which will be reduced to fewer curves
var eyeballx;
var eyebally;
var mouthp=326;
var hourF=255;
var minuteF=255;
var secondF=255;
var centerS=5;
var eyeballs=30;
var eyelidsx1=480/2; //replaced width
var eyelidsx2=80;
var eyelidsx3=180;
var eyelidsy1=480/2-20;
var eyelidsy2=80;
var eyelidsy3=360;

function setup() {
    createCanvas(480, 480);

}

function draw() {
    background(250,250,250);
    var h = hour();
    var m = minute();
    var s = second();
    //eyeball-second
    eyeballx=width/2;
    eyebally=height/2-30;
    secondF=255-s*2;//transparency decreasing based on minutes seconds and hours
    minuteF=255-m*5;
    hourF=255-h*10;
    angleMode(DEGREES);
    noFill();
    strokeWeight(3);
    //eyes opening-second
    if (s%2==0){//for each second, eye will correspondingly open and close
        stroke(0,0,0,secondF);
        push();
        fill(0,0,0,secondF);
        ellipse(eyeballx,eyebally,centerS,centerS);
        fill(0,20,128,secondF);
        ellipse(eyeballx,eyebally,eyeballs,eyeballs);
        pop();
        arc(eyelidsx1, eyelidsy1, eyelidsx2, eyelidsy2, eyelidsx3, eyelidsy3);
    }else{
        stroke(0,0,0,secondF);
        arc(eyelidsx1, height/2-50, eyelidsx2, eyelidsy2, eyelidsy3, eyelidsx3);
    }

    fill(0,0,0,secondF);
    ellipse(width/2+5,84,20,20);
    noFill();
    stroke(0,0,0,secondF);
    curve(width/2+40, 86, width/2+5, 94, width/2+5, 181, width/2+40, 115);
    fill(173,115,66,minuteF); //for colouring fading in minute
    stroke(0,0,0,hourF);//for colouring fading in hour
    push();
    strokeWeight(0);
    curve(width/2-110, height/2+6, width/2+5, height/2+4, width/2+5, height/2+71, width/2-310, height/2-80);
    strokeWeight(3);
    fill(172,36,25,hourF);
    curve(width/2+10, 396, width/2-10, mouthp, width/2+37, mouthp, width/2+30, 431);
    curve(width/2+10, 121, width/2-10, mouthp, width/2+82, mouthp, width/2+30, 121);
    translate(45, 0);//for moving the second lips
    curve(width/2+10, 396, width/2-10, mouthp, width/2+37, mouthp, width/2+30, 431);
    pop();

    //minute
    var fp1=width/2;
    var fp2=height/2-70;
    var offset1=10;
    var offset2=15;
    for (var y = 0; y < 6; y++) {//nested for loop for drawing the cols and rows
        noStroke();
        for (var x = 0; x < 5; x++) {
            if (((x+1)+(y)*5)<=m){//determing when the next dot appears
                fill(168,59,32,minuteF);
                var py = fp1 + y * offset1;
                var px = fp2 + x * offset2;
                ellipse(px, py, 10, 10);
            }
        }
    }
    var fp3=width/2;
    var fp4=height/2+70;
    for (var y1 = 0; y1 < 6; y1++) {
        noStroke();
        for (var x1 = 0; x1 < 5; x1++) {
            if (((x1+1)+(y1)*5)<=(m-30)){//note: need to minus 30 for calculating the second part of the dots
                fill(168,59,32,minuteF);
                var py1 = fp3 + y1 * offset1;
                var px1 = fp4 + x1 * offset2;
                ellipse(px1, py1, 10, 10);
            }

        }
    }

    //hour
    noFill();
    stroke(173,115,66,hourF);
    arc(width/2-110, height/2-70, 50, 50, 90, 270);
    var hourh=height/2-50
    for (var i=0;i<h;i++){//number of earings accordings to number of hours
        ellipse(width/2-110, hourh,20,20);
        hourh+=10;
    }
}
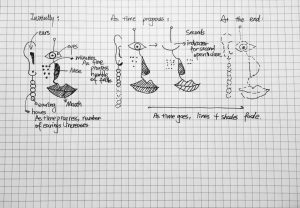
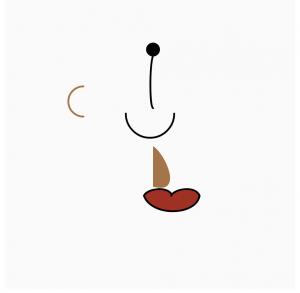
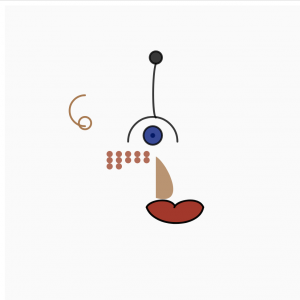
For this project, I intended to express an idea of “fading”. The start point of the clock will be a full face with all features visible (not including the earings and the wrinkles, since they are the indication of cumulative time). Then, as time progressed, the eyes will blink (close and open) as an indicator for seconds. The number of wrinkles will increase as minutes increases. So the number of blush will be the number of minutes for each hour. Lastly, the number of earings will be the number of hours. Thus, a way to calculate time is to add the number of earings with number wrinkles and the number of times the eye blinks. At the end, the whole face will fade away.
Draft drawing | 2017.10.5
Here are some screenshots for different time periods, so we can see the different representation of time changes.
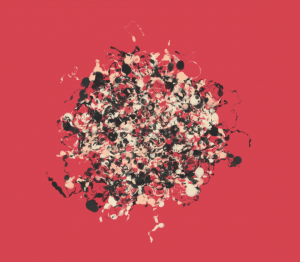
My ideas for the use of randomness in the computation of art is about randomized patterns that a function computes. “Generative Art with Node.js and Canvas” is one of the randomized artwork I appreciated. This is not a famous art piece but a small weekend project that combines Node.js and HTML5 Canvas to create high-resolution generative artwork. The reason I chose this instead of other big names works is because of the amazing color combination and the shape of each growing elements. Visually, this appears to me as a really interesting and aesthetic artwork. In the artist’s blog, he detailedly records of his process. He chose to use Node.js, pursuing a fast speed and a high resolution of the pattern.
Form2 | 2016 | Matt DeslauriersForm3 | 2016 | Matt DeslauriersForm4 | 2016 | Matt Deslauriers
In each version, the particle is rendered as a small pattern with direction and velocity. The scale and the mass’ scale is randomized to reach some straight and curly lines. After this, he uses photographs as “distortion maps” to drive the algorithm so some of his work looks as random segments creating some larger scale pattern. Lastly, he randomized the color from the “color lovers API”. He also uses many randomizations including the choice of color, the scale of particles, and the mass’ scale. Thus, I think this uses a “truly” random method for accomplishing the final results. Overall, I enjoyed the visual pattern and the pattern each particle accomplished.
var topSw1=14;//for house roof, x axis
var topSw2=5;//for house's left wall, x axis
var topSw3=23;//for house's right wall, x axis
var topSw=30;//for houseRoof's weight
var topSh1=0;//for house roof, y axis
var topSh2=5;//for house's left and right wall, y axis
var topSh=25;//for houseRoof's height
var numofRow1=15;//for defining numbers of loop
var numofCol1=20;
var locFx=14;//for flower's x axis
var locFy=20;//for flower's y axis
var locYc=30;//flower's height in between
var locXc=1.25;//flower's weight
var flowerW=11;//flower's petal's size


function setup() {
    createCanvas(480, 455);
}

function draw() {
    scale(1.3);
    background(255);
    var r1=230;
    var b1=138;
    var g1=92;
    for (var row1=0; row1<numofRow1;row1++){
        for (var col1=0; col1<numofCol1;col1++){
            noStroke();
            r1=r1+0.2;//for gradiant color
            b1=b1+0.3;
            g1=g1+0.3;
            fill(r1,b1,g1);
            if (row1%2!=0){//for setting the condition
                topSw1=30;//shifting between rows constantly
            }else{
                topSw1=15;

            }
            var x1=topSw1+col1*topSw;
            var y1=topSh1+row1*topSh-10;//based on calculation for eight points
            var x2=topSw1+col1*topSw+15;
            var y2=topSh1+row1*topSh;
            var x3=topSw1+col1*topSw;
            var y3=topSh1+row1*topSh+10;
            var x4=topSw1+col1*topSw-15;
            var y4=topSh1+row1*topSh;
            quad(x1,y1,x2,y2,x3,y3,x4,y4)

        }
    }
    var r2=225;//color variable for the walls
    var b2=205;
    var g2=203;
    var r3=240;
    var b3=240;
    var g3=240;

    for (var row2=0; row2<numofRow1;row2++){
        for (var col2=0; col2<numofCol1;col2++){
            noStroke();
            r2=r2+0.2;//changing varaibles for the color
            b2=b2+0.1;
            g2=g2+0.1;
            fill(r2,b2,g2);
            if (row2%2!=0){//for changing positions
                topSw2=20.5;
                topSw3=39;

            }else{
                topSw2=5;
                topSh2=5;
                topSw3=23;
            }
            var x11=topSw2+col2*topSw-5;//for setting up the eight points
            var y11=topSh2+row2*topSh-5;
            var x21=topSw2+col2*topSw+10;
            var y21=topSh2+row2*topSh+5;
            var x31=topSw2+col2*topSw+10;
            var y31=topSh2+row2*topSh+20;
            var x41=topSw2+col2*topSw-5;
            var y41=topSh2+row2*topSh+10;
            quad(x11,y11,x21,y21,x31,y31,x41,y41);
            r3=r3-0.2;//for the second side wall
            b3=b3-0.1;
            g3=g3-0.1;
            fill(r3,b3,g3);

            var x12=topSw3+col2*topSw-9;//for setting up the eight points
            var y12=topSh2+row2*topSh+4;
            var x22=topSw3+col2*topSw+7;
            var y22=topSh2+row2*topSh-6;
            var x32=topSw3+col2*topSw+11;
            var y32=topSh2+row2*topSh+8;
            var x42=topSw3+col2*topSw-8;
            var y42=topSh2+row2*topSh+20;
            if (col2==numofCol1-1){
                x32=topSw3+col2*topSw+7;
                y32=topSh2+row2*topSh+10;
            }
            quad(x12,y12,x22,y22,x32,y32,x42,y42);
            }
    }
    var r4=187;
    var g4=116;
    var b4=52;

    //green flower, flower roots, and door
    for (var row3=0; row3<numofRow1;row3++){
        for (var col3=0; col3<numofCol1;col3++){
            noStroke();
            fill(96,185,165);
            if (row3%2!=0){
                locFx=26;

            }else{
                locFx=10;
            }
            var e1=locFx+locYc*col3;
            var e2=locFy*locXc*row3;
            angleMode(DEGREES);//change radians to degree
            arc(e1, e2, flowerW, flowerW, -50, 10, PIE);
            arc(e1, e2, flowerW, flowerW, 35, 90, PIE);
            arc(e1, e2, flowerW, flowerW, 110, 155, PIE);
            arc(e1, e2, flowerW, flowerW, 175, 220, PIE);


            strokeWeight(1);
            stroke(87,148,83);
            noFill();
            curve(e1+30,e2+35,e1, e2, e1+7, e2, e1+15, e2+20);//the flower roots
            noStroke();

            //door and door handle
            r4+=0.2;
            g4+=0.2;
            b4+=0.2;
            fill(r4,g4,b4);
            if (row3%2!=0){
                topSw2=20.5;
                topSw3=39;
            }else{
                topSw2=5;
                topSh2=5;
                topSw3=23;
            }
            var x1=topSw2+col3*topSw;
            var y1=topSh2+row3*topSh+4;
            var x2=topSw2+col3*topSw+5;
            var y2=topSh2+row3*topSh+8;
            var x3=topSw2+col3*topSw+5;
            var y3=topSh2+row3*topSh+18;
            var x4=topSw2+col3*topSw-1;
            var y4=topSh2+row3*topSh+13;
            quad(x1,y1,x2,y2,x3,y3,x4,y4);
            fill(255);
            ellipse(x1+3,y1+8,3,3);

        }
    }

}
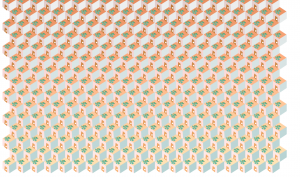
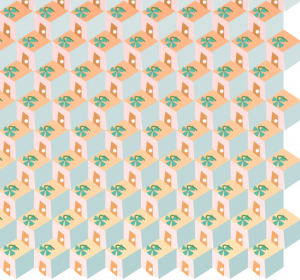
For this project, my inspiration came from the two-dimensional way of expressing three-dimensional object. The whole pattern is meant to be a set of houses with a plant living on top of it. The only problem I met was that I ignored the dimension I suppose to use for the project and used a much larger dimension. The actual pattern I created is larger than what I have now. Overall, I am happy about learning for loop, it makes my concept to another level.
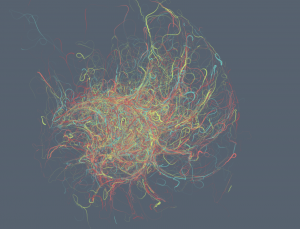
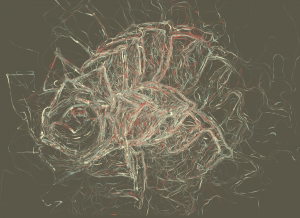
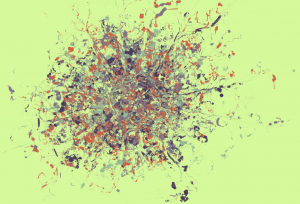
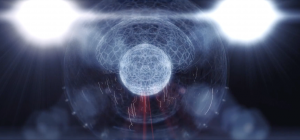
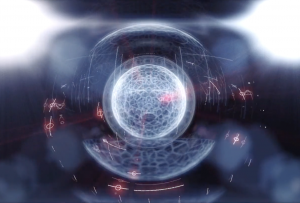
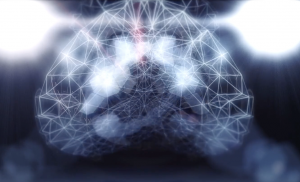
Inspired by Andy Lomas’ Aggregation 2, I am interested in finding something using mathematical rules to construct natural forms. SoN01R is a real-time dynamic artistic data visualization and sonification of quantum fluctuations. SoN01R looks like a 2D graphic at first, as it revolves and changes through time, it becomes a 3D sphere where particles keep flying around it. The combination successfully created a three-dimensional scene. The project is created by Frederik De Wilde who studies fine arts, media arts and philosophy. My admiration of this project mainly came from the four different stages of SoN01R, which will be shown in the following pictures.
For each visualization, SoN01R uses a real-time data from the Quantum Science Department in Australian National University. The method used here is to collect a physical quantum source first and then generate true random numbers in real-time which drive the audiovisual work. The final visualization is used Quantum fluctuation data, Processing, and Final Cut proX. The whole idea behind this project is to visualize something that is immaterial, short-lived, and universal. Watching the video, we seem to follow the transformation and to understand something that is very distant from our normal perception of moving/transforming objects.
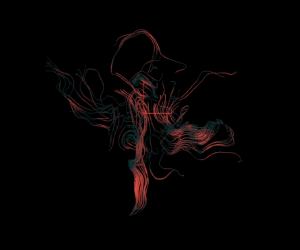
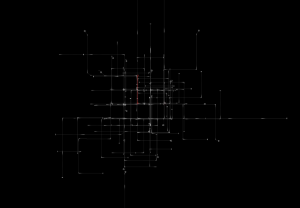
The visualization of sound inspired me because I used to do artworks about visualization, for example, the visualization of math. Thus, I zoomed into the relationship between sound (amplitude and frequency) and visual patterns to see if one relates to the other. Through my exploration, I found Simon Russell’s work to be a really interesting example to me. He is an animation director based in London. This project is about sound visualization and it is called “Audio Geometry Exploration- Sonification in Houdini”. This is a project using Houdini experiments where geometry is used to visualize sound and creates patterns. Simon discovered that Houdini is really flexible with audio and allow the audio to create f-curves from geometry. So he can manipulate in myriad ways. To be more specific, Simon used 3d geometry to connect collisions of lines in the visualized part with an audio pulse based on the shape’s height. The basic strategy is to export from Houdini into Cinema 4D and see cloners and splines to create additional geometry. Last but not least, he used After Effects and Audition to composite and mix. Overall, I really admire the coherence between the visual part and the sound. It is really pleasant to watch the whole video when two of our sensory parts are combined well.
//Clair(sijing) Sun
//session C
//sijings@andrew.cmu.edu
//stringArt
var angle=0
function setup() {
    createCanvas(400, 300);
}

function draw() {

    //outer patel
    strokeWeight(1.5);
    background(247,234,186);


    //left top middle petal - 1st curve
    var curveinY = height/2+40;//local variable for determing the changes in location of lines
    var curveinX2 = width/2;

    for (var i5 = 0 ; i5 < 80 ; i5 ++) {
        stroke(250,112,154);
        line(0, curveinY, curveinX2, 0);
        curveinY -= 10;//by minusing 10, we change the start position of y everytime a new line is created
        curveinX2 += 10;//by adding 10, we change the end position of x everytime a new line is created
    }


    //left bottom petal - 2nd curve
    var curve1Y = height/2+50;
    var curve1X2 = width/2+50;
    var color31=251;//an initial value for color changing
    var color32=171;
    var color33=126;
    var colorchange3=0;//the variable helps changing the color

    for (var i = 0 ; i < 50 ; i ++) {
        colorchange3+=3;//the value each time the RGB value changes
        stroke(color31,color32+colorchange3,color33+colorchange3);
        line(0, curve1Y, curve1X2, height);
        curve1Y -= 10;//similar concept as the previous curve
        curve1X2 -= 10;
    }

    //petal at the top left, far back - 3rd curve
    var curve2X = 50;
    var curve2Y2 = height/2+50;
    var color21=250;//color for 3rd curve variables
    var color22=172;
    var color23=168;
    var colorchange2=0;//vairble helps chainging the color

    for (var i2 = 0 ; i2 < 50 ; i2 ++) {
        colorchange2+=4;//changed value everytime the RGE value changes
        stroke(color21,color22+colorchange2,color23+colorchange2);
        line(curve2X, 0, 0, curve2Y2);
        curve2Y2 -= 10;//ending y position changed
        curve2X += 10;//starting x position changed
    }

    //patel at the top right -4th curve
    var curve3X = 50;
    var curve3Y2 = 50;
    var color1=255;
    var color2=185;
    var color3=205;
    var colorchange1=0;

    for (var i3 = 0 ; i3 < 50 ; i3 ++) {
        colorchange1+=2;
        stroke(color1,color2+colorchange1,color3);
        line(curve3X, 0, width, curve3Y2);
        curve3X += 10;//starting x position changed
        curve3Y2 += 10;//ending y position changed
    }

    //petal at the bottom right - 5th curve
    var curve4Y = 50;
    var curve4X2 = width-50;
    var color11=255;
    var color12=65;
    var color13=101;
    var colorchange=0;

    for (var i4 = 0 ; i4 < 50 ; i4 ++) {
        colorchange+=5;//color gradient between lines
        stroke(color11,color12+colorchange,color13);
        line(width, curve4Y, curve4X2, height);
        curve4X2 -= 10;
        curve4Y += 10;
    }


    //top left petal, on the front - 6th curve
    var curvein2X = width/2;
    var curvein2Y2 = height/2;
    var color41=255;
    var color42=125;
    var color43=125;
    var colorchange4=0;

    for (var i6 = 0 ; i6 < 80 ; i6 ++) {
        colorchange4+=3;
        stroke(color41,color42+colorchange4,color43);
        line(curvein2X, 0, 0, curvein2Y2);
        curvein2X -= 10;
        curvein2Y2 += 10;
    }

    push();//to avoid changing color and stroke for other variables
    noStroke();
    fill(255,255,255);
    ellipse(width/2,height/2-20,135,135);
    pop();

    //middle spinning flower
    if (mouseX>110&mouseX<270&&mouseY>90&&mouseY<200){
        //when mouse approaches the middle, circle appears
        for(var ii = 1; ii <=100; ii+=0.1) {//set to 100 so it will keep spinning
            angle+=30;//changing variable for spinning
            stroke(255, 114, 115);
            line((width/2-20)+computeX(3,angle), (height/2+20)+computeY(3,angle),
                width/2+computeX(70,angle+140), (height/2-20)+computeY(70,angle+140));
        //the inspiration came from deliverables
        }

    }


}

function computeX(r,angle) {//creating own function to cauculate the spinning circle
    return r*cos(angle);
}

function computeY(r,angle) {
    return r*sin(angle);
}
For this project, I had a really hard time to figure out what I really want to do because I personally don’t like string art which seems to be too scientific for me. However, after seeing the provided examples, I start to understand its beauty. I first analysed the Holly Hatfield’s blog on “7th Grade String Art” to figure out the algorithm. Once I understood how curves were created, my project became easier. My intention was to create a unique style of an eye where the spinning eyeball will appear once your mouse is on the pupil. After I finished creating the project, I felt my algorithm was too simple so I started figuring out how to make gradient curves (which is shown and explained in the comments). The whole process was fun and improved my understanding of this language.
My first encounter with Madeline Gannon’s project helped me think about things from another perspective. Can this organic and hand-made like wearable decoration be made by computational digital fabrication? Watching Gannon’s video, I was attracted by this combination. Exploring even deeper, I found many similar ideas where digital fabrication and computational algorithms are used to produce wearable and fashionable objects. One project that I really like is the “Kinematics Dress” by Nervous System. Jessica Rosenkrantz and Jesse Louis-Rosenberg, which is also called as “Nervous System”, have been doing highly influential work in the computational design of constructing decorative objects and garments.
The Kinematics Dress is a technical achievement made by a 3D-printed garment to satisfy people’s needs of wearing a dress made out of current technology that is comfortable and durable. The Kinematics Dress is fabricated in nylon by 3D printing with Selection Laser Sintering. The first idea of the project is to make a necklace where the necklace is printed flat and can be folded later. The object will be made in computer code relating to kinematics algorithms first and then printed in a 3D printer.
X-Ray View Rendering Showing Hinge Structure | 2014.12.04|in Studio
The Nervous System intends the move from assembling all little pieces and construct a larger piece to making a smart material that will self-assemble itself. They start with computational folding and simulation to construct the dress in one piece. They then create a large object of a 3d scanned person that is larger than the 3d printer and then fold to suit the fabrication. Then, when taking out of the machine, the dress gets unfold. The final presentation of the dress is hard material connected with softer connections where they link with each other and can move freely. I really admire this project as it combines engineering and science with design and fabrication. It presents me with a bigger idea that opens up more possibilities to create garments with today’s technology.
Swatch of Kinematics Structure Showing Hinge Details| 2014. 12. 04|in StudioDynamic Picture of The Whole Dress | 2014. 12. 04|in Studio
//Clair(sijing) Sun
//session C
//sijings@andrew.cmu.edu
//Project-03-Dynamic Drawing

var moonposX=540;//moon position
var moonposY=140;
var moonR=80;
var frontTX1=300;//front mountain1
var frontTY1=260;
var frontTX2=250;//front mountain2
var frontTY2=260;
var frontTX3=350;//front mountain3
var frontTY3=260;
var front2TX1=250;
var front2TY1=260;
var front2TX2=200;
var front2TY2=260;
var front2TX3=300;
var front2TY3=260;
var islandDegree1=180;//island
var islandDegree2=90;
var islandPosX1=300;
var islandPosY1=250;
var islandWidth=390;
var islandHeight=390;
var backTX1=200;//back mountain1
var backTY1=260;
var backTX2=160;
var backTY2=260;
var backTX3=240;
var backTY3=260;
var back2TX1=180;//back mountain2
var back2TY1=260;
var back2TX2=104;
var back2TY2=260;
var back2TX3=254;
var back2TY3=260;
var moonColor1=156;
var moonColor2=193;
var offsetFish=20;//for fish to follow with a distance
var color1=243;//change color when mouse arrive the moon
var color2=244;
var color3=225;
var bird=0;//a condition for mouse in and outside of the island


function setup() {
    createCanvas(640, 480);

}

function draw() {
    background(color1,color2,color3);
    noStroke();
    fill(moonColor1,moonColor2,204);
    moonColor1+=mouseY/400;//moon color change
    //print("bird"+bird);for debugging
    if (moonColor1>=254&bird>0){//moon color changing as mouse moves
        moonColor1=mouseX;
        moonColor2=mouseY;
    }
    var moveMouse=mouseX-500;//to create moon rotatons
    moonposX+=moveMouse;
    if (moveMouse>30&bird>0){//two edge cases
        moveMouse=5;
    }
    if (moonposX<5&bird>0){
        moonposX=635;
    }
    if (moonposX>635&bird>0){
        moonposX=5;
    }

    if (mouseX>470&mouseX<530&&mouseY<163&&mouseY>93){
        color1=224;//background color change
        color2=125;
        color3=105;

    }else{
        color1=243;
        color2=244;
        color3=225;
    }
    if (bird==0&back2TY1<305){//for mountains disappear
        back2TY1+=1;
        backTY1+=1;
        frontTY1+=1;
        front2TY1+=1;
    }else{//for the mountains appear
            back2TY1-=1;
            backTY1-=1;
            frontTY1-=1;
            front2TY1-=1;
            if (back2TY1<45){//to stop mountain from moving further
                back2TY1=45;
            }
            if(backTY1<30){
                backTY1=30;
            }
            if (frontTY1<90){
                frontTY1=90;
            }
            if (front2TY1<110){
                front2TY1=110;
            }


    }

    //mountains
    ellipse(moonposX,moonposY,moonR,moonR);
    fill(222,226,227);
    triangle(back2TX1,back2TY1,back2TX2,back2TY2,back2TX3,back2TY3);
    translate(100,0);
    triangle(back2TX1,back2TY1,back2TX2,back2TY2,back2TX3,back2TY3);
    translate(-100,0);
    fill(163,180,90);
    triangle(backTX1,backTY1,backTX2,backTY2,backTX3,backTY3);
    fill(65,69,41);
    triangle(frontTX1, frontTY1, frontTX2, frontTY2, frontTX3, frontTY3);
    fill(93,105,57);
    triangle(front2TX1, front2TY1, front2TX2, front2TY2, front2TX3, front2TY3);
    fill(90,139,157);
    angleMode(DEGREES);
    arc(islandPosX1, islandPosY1, islandWidth, islandHeight, 0, islandDegree1,islandDegree2);


    if (mouseX>106&mouseX<494 && mouseY>251){//for determining wether the mouse is on the island
        fill(175,215,198,100);
        bird=0;
    }else{
        fill(175,215,198);
        bird=1;
    }

    //fish drawings
    arc(mouseX-offsetFish, mouseY+offsetFish, 30,30,0,100,130);
    arc(mouseX-offsetFish-9, mouseY+offsetFish+14.5, 10,10,0,100,130);
    translate(-20,5);//for multiple fishes
    arc(mouseX-offsetFish, mouseY+offsetFish, 30,30,0,100,130);
    arc(mouseX-offsetFish-9, mouseY+offsetFish+14.5, 10,10,0,100,130);
    translate(-20,5);
    arc(mouseX-offsetFish, mouseY+offsetFish, 30,30,0,100,130);
    arc(mouseX-offsetFish-9, mouseY+offsetFish+14.5, 10,10,0,100,130);
    translate(-25,0);
    arc(mouseX-offsetFish, mouseY+offsetFish, 30,30,0,100,130);
    arc(mouseX-offsetFish-9, mouseY+offsetFish+14.5, 10,10,0,100,130);
    translate(30,35);
    arc(mouseX-offsetFish, mouseY+offsetFish, 30,30,0,100,130);
    arc(mouseX-offsetFish-9, mouseY+offsetFish+14.5, 10,10,0,100,130);
    translate(20,-25);
    arc(mouseX-offsetFish, mouseY+offsetFish, 30,30,0,100,130);
    arc(mouseX-offsetFish-9, mouseY+offsetFish+14.5, 10,10,0,100,130);
    translate(25,-10);
    arc(mouseX-offsetFish, mouseY+offsetFish, 30,30,0,100,130);
    arc(mouseX-offsetFish-9, mouseY+offsetFish+14.5, 10,10,0,100,130);
    translate(10,10);
    arc(mouseX-offsetFish, mouseY+offsetFish, 30,30,0,100,130);
    arc(mouseX-offsetFish-9, mouseY+offsetFish+14.5, 10,10,0,100,130);

    //rotating the boat on the water
    if (bird>0){
        var degree=cos(mouseX);
        rotate(degree);
        //print(degree);for debugging the boat rotation
        fill(104,76,16);
        arc(400, 220, 50,30, 0, islandDegree1,islandDegree2);
    }


}
For this project, my idea is to create a narrative drawing where the audience can control the pace by either putting the mouse outside of the lake and inside of the lake. The project is intended that the audience start by putting their mouses inside the lake and then gradually towards the outside. The fish group is always following the mouse. When the fish jumps out of the lake, the mountain grows up and the boat appears. The users can also manipulate the speed that the moon/the sun rotates. When the mouse(in my drawing, the fish group) meet the original point of the sun, the background color will change. Four variables here are 1. the color of the moon 2. the background color 3. the speed of moon’s rotation 4. the rotation angle of the boat (slightly to create the effect of its floating) 5. the size of the mountain 6. the location and the color of the fish.
![[OLD FALL 2017] 15-104 • Introduction to Computing for Creative Practice](../../../../wp-content/uploads/2020/08/stop-banner.png)