sjahania – final project

sjahania-final-project

My project is a simple, interactive keyboard. They keys light up when you press them, and I included harmonics to make it sound more like a real piano.

Press on a key and the note will sound! You can click and drag in order to play more than one note quickly.

To run:
1. Download the file “sjahania-final-project”
2. Open “index.html” in your browser
3. Play away!

Project-09-sjahania

sketch

var underlyingImage;

function preload() {
    var myImageURL = "https://i.imgur.com/Q9MzvBG.jpg";
    underlyingImage = loadImage(myImageURL);
}

function setup() {
    createCanvas(400, 480);
    background(0);
    underlyingImage.loadPixels();
    frameRate(10);
}

function draw() {
	var lineStartX = random(width);
    var lineStartY = random(height);
    var lineStartX2 = random(width);
    var lineStartY2 = random(height);
    var ix = constrain(floor(lineStartX), 0, width-1);
    var iy = constrain(floor(lineStartY), 0, height-1);
    var theColorAtLocationXY = underlyingImage.get(ix, iy);

    stroke(theColorAtLocationXY);
    line(lineStartX, lineStartY, lineStartX + 20, lineStartY + 20);
    line(lineStartX2, lineStartY2, lineStartX2 + 20, lineStartY2 - 20);

}

I wanted to do something with lines, so I started by just making the line from one random point to another. The problem was it was only using the color from the starting point, so it just made this big blob with no actual portrait. So I shortened the distance of the lines so that the colors wouldn’t stray from their rightful spots too much.

LookingOutwards-08-sjahania

Jake Barton is a pioneer in blending technology, digital media, and architecture into emotional and engaging digital media experiences for museums, companies, and public places. He received a Bachelor in Science of Speech from Northwestern, and then continued his education at NYU where he was awarded a MPS in Interactive Telecommunications. He is the founder of Local Projects, a firm based out of New York City specializing in creating innovative story-telling experiences that captivate audiences. In his own words on Local Projects’ website, he and his firm “create bold new ideas and bring them to life.” I admire the fact that he utilizes an interdisciplinary team of artists, coders, and architects to create his work because it recognizes that fact that collaboration is key to success in art and in life. Out of all his amazing projects, I enjoy his work for the National September 11 Memorial & Museum the most. In this project, he brings victims’ stories to life which inspires personal connections between them and the visitors. This strategy of appealing to qualities of humanity is something that I can utilize in the future to engage my audience with my work.

LookingOutwards-06-sjahania

I asked my friends if they knew of any randomly generated art projects, and someone brought a 15-112 project to my attention. Lingdong Huang (a student at Carnegie Mellon) created a procedurally generated world for a side scroll game called Hermit. He created beautiful three-dimensional landscapes that interact with one another and have some sort of depth.

If I am understanding it correctly, the artist coded a few shapes, and then randomly generated the rest of the pictures. So there are millions of different random combinations of shapes to create the tree, the ground, and the things the character and his horse can do.


This is the video that Lingdong Huang posted for his project. It is very dramatic.

Project-06-Abstract-Clock-sjahania

sketch

function setup() {
    createCanvas(400, 450);
}

function draw() {
    background(255, 239, 213);
    noStroke();
    
    // Fetch the current time
    var H = hour();
    var M = minute();
    var S = second();

    //Glass streaks
    stroke(0);
    line(100, 150, 115, 135);
    line(100, 155, 120, 135);
    line(105, 155, 120, 140);

    line(220, 150, 235, 135);
    line(220, 155, 240, 135);
    line(225, 155, 240, 140);

    line(340, 150, 355, 135);
    line(340, 155, 360, 135);
    line(345, 155, 360, 140);
    
    // Compute the widths of the rectangles
    var mappedH = map(H, 0,23, 0, 300);
    var mappedM = map(M, 0,59, 0, 300);
    var mappedS = map(S, 0,59, 0, 300);

    //Display glasses
    noFill();
    stroke(0);
    rect(30, 100, 100, 300);
    rect(150, 100, 100, 300);
    rect(270, 100, 100, 300);
    
    // Display the rectangles. 
    fill(47, 184, 255);
    quad(30, 400 - mappedH, 130, 400 - mappedH, 130, 400, 30, 400);
    fill(47, 132, 255);
    quad(150, 400 - mappedM, 250, 400 - mappedM, 250, 400, 150, 400);
    fill(47, 46, 255);
    quad(270, 400 - mappedS, 370, 400 - mappedS, 370, 400, 270, 400);

    //Glass bases
    fill(0);
    rect(30, 390, 100, 10);
    rect(150, 390, 100, 10);
    rect(270, 390, 100, 10);

    //Water drops
    fill(47, 184, 255);
    ellipse(80, 50, 50, 50);

    fill(47, 132, 255);
    ellipse(200, 50, 50, 50);

    fill(47, 46, 255);
    ellipse(320, 50, 50, 50);

    // Display numbers to indicate the time
    fill(255);
    textAlign(CENTER);
    textSize(15);
    text(H, 80, 50);
    text(M, 200, 50);
    text(S, 320, 50);


}

I really like the glass half-empty and glass half-full idea, and how it gets harder to see things as glass half-full as time runs out. So I flipped it, and made it so the glasses fill with water as time goes on. It took me a while to figure out how map() works, but I eventually got it.

LookingOutwards-05-sjahania

The Graphics Codex is a website and app I found that teaches people how to make basic graphics using programming. It has a series of “courses” with projects that allow people to practice the skills they learn. The project I was the most interested in is called “Meshes.” It involves using geometrical shapes (mostly triangles) to create three-dimensional pictures. The course explains how to think topographically, and gives the ins and outs of using algorithms to program the actual displays.


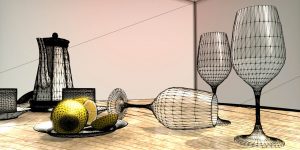
This is an example of how one would use triangles to create 3D shapes in computer graphics. The triangles are left in to show a map, and to get the people seeing the image to “think topographically.”

One thing I found interesting is the course’s definition of topography. It explains that topography is the connectedness of the points on a two-dimensional surface in three-dimensional space. I learned that while the “mesh” part animates in graphics, the actual connectedness stays the same, and this is an important point in computer graphics.

website link: http://graphicscodex.com/projects/meshes/index.html

Project-05-Wallpaper-sjahania

sketch

function setup() {
    createCanvas(400, 400);
    background(100,180,180);

    var lineX = 20; // x coordinate of lines
    var arrowX = 15; // y coordinates of arrows and dots
    var arrowY = 20; // y coordinates of arrows and dots

    //outermost loop has the first set of alternating x values
    for (x1 = 0; x1 <= 400; x1 += 40) { 

    	//next loop has the second set of alternating x values
    	for (x2 = 20; x2 <= 400; x2 += 40){

    		//third loop has the y values that increase each iteration
    		for (y = 0; y <= 400; y += 15) {

    			//arrows(leaves)
    			//if statement skips every 4th arrow
    			if (y % 60 != 0) {

    				//make them green
    				stroke(0,120,0);
    				strokeWeight(1);

    				//makes left side of each arrow on the x1 lines
    				line(arrowX + x1, arrowY + y - 5, lineX + x1, arrowY +  y);

    				//makes right side of each arrow on the x1 lines
    				line(lineX + x1, arrowY + y, arrowX + x1 + 10, arrowY + y - 5);

    				//makes left side of each arrow on the x2 lines
    				line(arrowX + x2, arrowY + y - 5 + 30, lineX + x2, arrowY +  y + 30);

    				//makes right side of each arrow on the x2 lines
    				line(lineX + x2, arrowY + y + 30, arrowX + x2 + 10, arrowY + y - 5 + 30);      	
    			} 

    			//dots (flowers)
    			//if statement puts them at the top of each set of arrows
    			if (y % 60 == 0) {

    				//random colors
    				fill(random(0,255), 73, 113);

    				//random sizes
    				strokeWeight(random(5,10));

    				point(lineX + x1, y + 30);
    				point(lineX + x2, y);
    			}	

    			//lines (stems)
    			//make them green
    			stroke(0,120,0);
    			strokeWeight(1);

    			//x1 lines
    			line(lineX + x1, 0, lineX + x1, height);

    			//x2 lines
    			line(lineX + x2, 0, lineX + x2, height);
    		}
    	}
    }
    noLoop();
}

function draw() {
}

I had a lot of trouble with this because I liked a lot of different designs I found online, but could not picture how to put them in p5.js. In the end, I combined two designs I liked to make a relatively simple pattern that looks kind of like flowers.


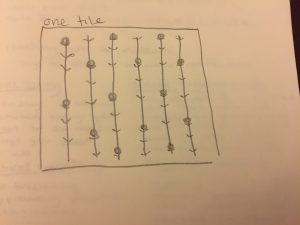
This was my sketch. It was simple but still something I could challenge myself by trying to code.


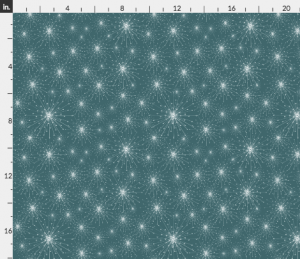
I used this as inspiration for the flower “dots”. The image was titled “Dandelion,” so I thought about just using circle shapes for my flowers.


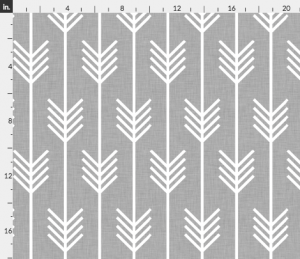
I used this as inspiration for the leaves. I actually started with the arrow design, and then decided they looked like leaves and added to them.

LookingOutwards-04-sjahania

Fraction is a French artist and composer named Eric Raynaud who focuses on combining audio and visual art to immerse audiences in a different kind of performance. One of his projects, called Entropia, is a geodesic sphere of lights that react to sound, accompanied by a pixel-mapped display of lights in an IMAX dome. The displays both change based on the sounds that Fraction plays from within the sphere. It uses real-time programming to connect the sound and the display and then project it to the audience.


This is a video of the kinds of performances Fraction gives.

I found this particularly interesting because it uses the lights that react and the pixel mapped part to give the audience an overwhelming sensation. I also did a project about geodesic domes in high school, so that is probably why this one stood out the most. I also cannot fathom how one would make displays from sounds like the ones in the video by coding. I wonder how many different displays he can make with the sounds he coded.

website: http://www.fractionmusic.com/project/entropia-av/

Project-04-StringArt-sjahania

sketch

var density; //changes how thick the arcs are

//changes the colors
var col1; 
var col2;


function setup() {
    createCanvas(400, 300);
    background(240);
}

function draw() {
	//redraws a new canvas every time the mouse is pressed
	fill(240);
	rect(0,0,400,300);

	//sets the colors based on the x coordinate of the mouse
	col1 = mouseX/(400/255);
	col2 = mouseX/(400/255);

	for (var a = 0; a < 400; a += density) {
		//draws the top left arc
		stroke(180,255 - col2,180);
		line(a, 0, 0, 400-a);

		//draws bottom left arc
		stroke(255 - col1,180,180);
		line(400 - a, 300, 0, 300 - a);

		//draws bottom right arc
		stroke(180,col2,180);
		line(a, 300, 400, 300 - a);


		//draws top right arc
		stroke(col1,180,180);
		line(a, 0, 400, a);
	}

}
//changes the thickness of the arcs by drawing a different # of lines
function mousePressed() {
	density = random(5,12);
}


Using the for loop took me a while because it is different enough from python to really throw me off. Once I figured it out, I had fun making different shapes, but I settled for something symmetrical because the other shapes I made weren’t very aesthetically pleasing. Then I played with colors.

LookingOutwards-03

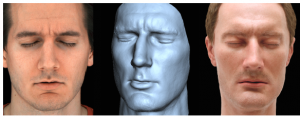
One of the projects at the Computational Fabrication Group at Massachusetts Institute of Technology involves analyzing faces and recreating them on a computer. Faces are challenging because we are sensitive to the minute details on a face, and algorithms can only do so much. The CFG managed to develop algorithms to analyze and reproduce human appearances in real-time. They use this technology to make advances in cosmetics, movies, computer vision, and even virtual reality.

This is fascinating to me because human face details are so intricate and complex. All of my projects have been very simple so I can’t imagine how they managed to develop an algorithm to track and recreate faces in real-time.