Project-07 Composition with Curves

//Yoonseo(Dave) Choi
//Section B
//yoonseo1@andrew.cmu.edu
//Project 07
var npoints =100; //points for generating curve
function setup() {
    createCanvas(480,480); //canvas size of 480 by 480
    angleMode(DEGREES); //set radian to degree

}

function draw() {
    background(0);//set background to black
    stroke(255); //curve colro tobe white 
    var mx = constrain(mouseX,30,width-30); // return mousex value within constrain
    var my = constrain(mouseY,30,height-30); //return mousey value within constrain
    noFill(); //no fill on geometry
    heart(mx,my); // execute heart function wiggly heart
    heart2(mx,my); //execute heart2 function line following mouse
    nails(mx,my);
}
function heart(rn1,rn2){ //for getting parameter for x,y mouse 
    strokeWeight(0.5); //set stroke size to 0.5
    push() 
    beginShape();
    translate(width/2,height/2) // make it center at middle 
    for (var i =0; i <npoints;i++) { // for loop for creating geometry
    var t = map (i,0,npoints,0,360); // map t value to degree
    var x = 16*sin(t)*sin(t)*sin(t); // x function from the mathworld wolf cam
    var y = 13*cos(t)-5*cos(2*t)-2*cos(3*t)-cos(4*t); //y function from mathworld wolf cam 
    vertex(x*rn1/40+(rn1/50*random(-0.5,0.5)),-y*rn2/40+(rn2/50*random(-0.5,0.5))); //create heart shape with wiggle 
    //as mouse move wiggle gets small or big
    }
    endShape(CLOSE); //end the geomtry
    pop();
}
function heart2(rn1,rn2){
    strokeWeight(0.5);//set stroke size to 0.5
    push();
    
    for (var i =0; i <npoints;i++) { // for generating geometry
    var t = map (i,0,npoints,0,360); // t value to degree
    var c = color (150,0,0); // color to red 
    stroke(c); // set stroke color to red
    var x = 16*sin(t)*sin(t)*sin(t); // heart x
    var y = 13*cos(t)-5*cos(2*t)-2*cos(3*t)-cos(4*t);//heart y 
    line(rn1,rn2,x*rn1/60+width/2,-y*rn2/60+height/2); //create line from heart to mouse position
}
    pop();
}
function nails(rn1,rn2){
    stroke(255,81,51,500-(rn1+rn2)/2) //color alpha change based on the mosue
    strokeWeight(0.4);  //stroke weight 

    push(); 
    beginShape();
    translate(width/2,height/2);
    for (var i =0; i <npoints; i++){
    var t = map (i,0,npoints,0,360); //mapping to dgrees 
    var r = map((rn2+rn1),0,(height+width),0,100); // mapping radius to max 100 based on mouse
    var x = r*cos(t); // circle x
    var y = r*sin(t); //circle y 
    vertex(x*rn1/200,y*rn2/200);//outer line for the vertex
    vertex(x*rn1/150,y*rn2/150);//inner circle for connecting 
  }
    endShape(CLOSE); //close the geometry 
    pop();
}

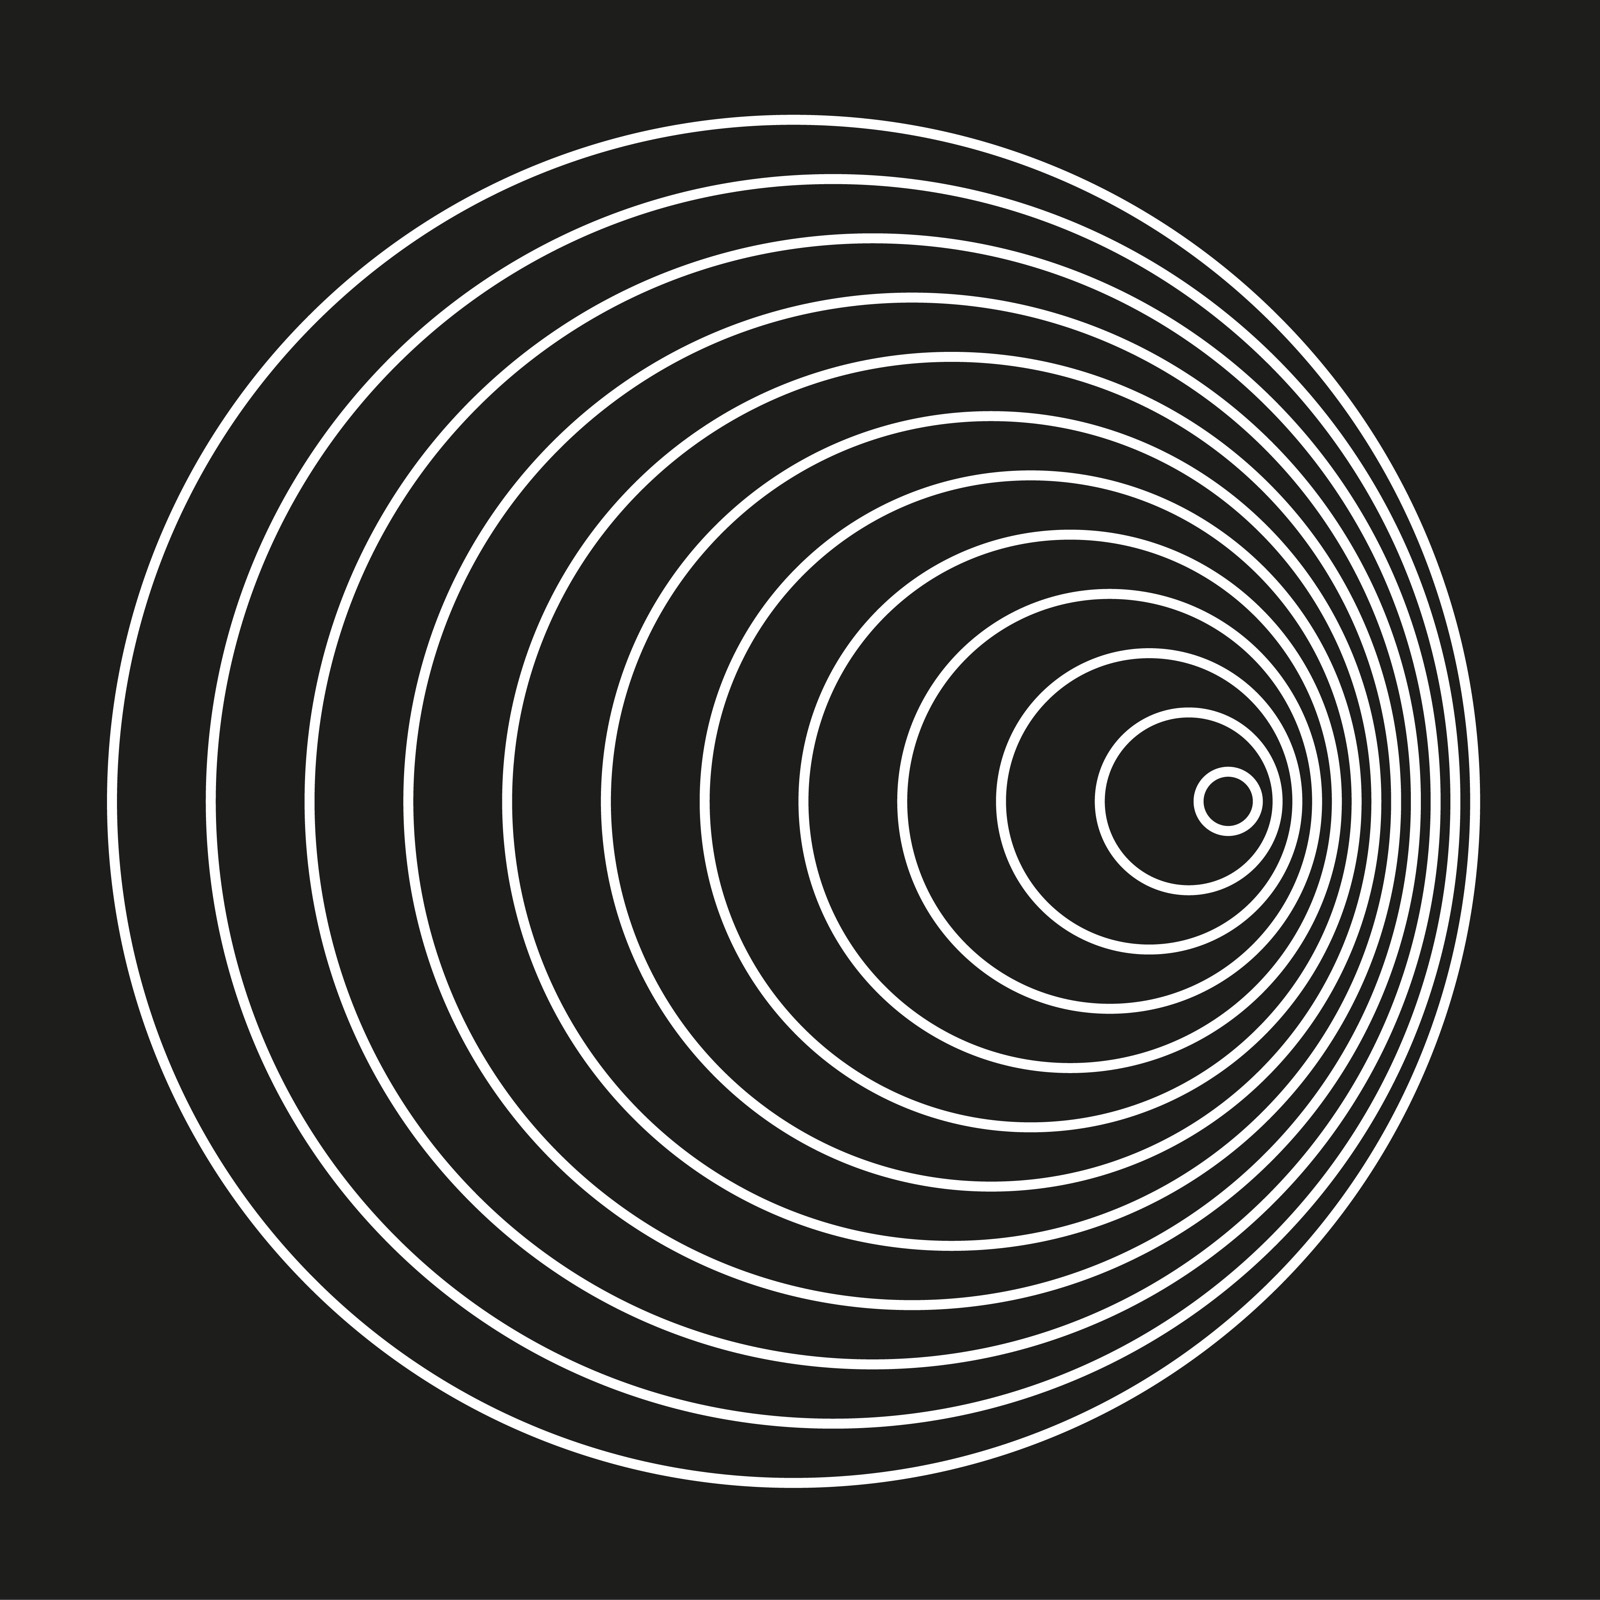
While I was searching for which curve to play with, I found heart shaped curve. I wanted to express emotion that I was having when the idea came up. I wanted the heart to give unstable look with directional element. At the same time, I look for other curve that could be used to show nail. I wanted to illustrate nails in the heart when heart is small but as it grow, nail starts to disappear. I have used r cos(theta) and r sin(theta) to generate the circular curve that will be used to represent the nail. To show the instability of the heart I used the wiggling motion, and I have used line to move along with the mouse coordinate to show dynamic direction that heart can point to.

Lookingoutwards -07

This is a project from Stamen. Name of the project is Facebook Flowers. The projects starts with George Takei sharing a picture on Facebook. After the initial share, shares that followed generates thread that continues as more shares occur. In the process, popular people are revealed as branching-off points of their own, and the process begins again. It is named flower because the visualization of data resembles the organism.

This project is particularly admiring on a fact that it converted the data that could be represented boring to interesting representation. It was always an interesting idea to record or see how fast and wide can social media spread information abroad. This project proves that social media is one of the fastest way to spread any thing to variety of people.

More dramatic case of sharing

Project 6-Abstract Clock

Dave AbClock

function setup() {
angleMode(DEGREES); //set angles to be degree
createCanvas(480, 480);

}

function draw() {
     //set back ground to be white
     stroke(20,30);
    var sec = second(); //return seconds
    var min = minute(); //return minutes
    var hr = hour(); //return hours
    seccount = map(sec,0,60,0,360)+90; //convert the second value to the angle usable for clock
    mincount = map(min,0,60,0,360)+90; // convert the minute value to the angle usable for clock
    hourcount = map(hr,0,12,0,360)+90; //convert the hour value to the angle usable for clock
    //adding 90 degree to begin the clock at 12 O clock direction

    movement(); //initiate movement
}
function movement(){ //same as above except radius changed and color 
    var centerx = width/2; //center of x 
    var centery = height/2; //center of y
    var radius = 150; //set radius to 150
    var x1 = -cos(seccount) *radius; //x1 coordinate for seconds
    var y1 = sin(seccount) * radius; //y1 coordinate for seconds
    var x2 = -cos(mincount) *radius; //x coordinate for minute
    var y2 = sin(mincount) * radius; //y coordinate for minute
    var x3 = -cos(hourcount) *radius; // x coordinate for hour
    var y3 = sin(hourcount) * radius; // y coordinate for minute
    var drad = dist(centerx+x2,centery-y2,centerx+x1,centery-y1); //distance of seconds to minute
    var drad2 = dist(centerx+x1,centery-y1,centerx+x3,centery-y3); //distance of seconds to hour
    fill(y3*12,y1*6,y2*3,120); //color of triangle to be based on second, minute, and hours
    triangle(centerx+x1,centery-y1,centerx+x2,centery-y2,centerx+x3,centery-y3); //create triangle on x,y coordinate of time
    fill(0,0,255,200);// color of seconds to be blue 
    ellipse(centerx+x1,centery-y1,x1,x1); //second hand circle
    fill(50,50,50,dist(centerx+x2,centery-y2,centerx+x1,centery-y1)); //minute hand size and opacity change
    ellipse(centerx+x2,centery-y2,drad/2,drad/2); // minute hand circle
    fill(0,255,0,dist(centerx+x1,centery-y1,centerx+x3,centery-y3)); //hour hand size and opacity change
    ellipse(centerx+x3,centery-y3,drad2/2,drad2/2); //hour hand circle

    //indication of actual points
    fill(0);
    ellipse(centerx+x1,centery-y1,10,10);
    ellipse(centerx+x2,centery-y2,10,10);
    ellipse(centerx+x3,centery-y3,10,10);

}


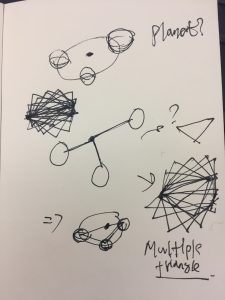
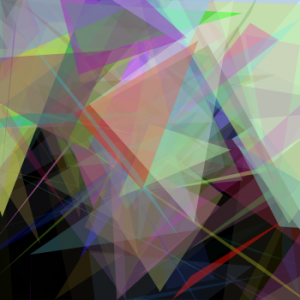
I first started by looking at the http://procyonic.org/clocks/. this website gave me idea that I could create some sort of orbit system just like planetary system. In stead of making them orbit, I wanted to create some sort of relationship among three points that are representing time. I connected them into triangle and overlap of the triangles created interesting form.

After creating a clock code program , I connected three points with triangle p5 function. That was not enough to give abstraction to generated form. I decided to move further and place ellipse on each of the points to make is legible, but at the same time establishing another layer of relationship. I made size the ellipse to be different based on distance of points from the seconds hand location and color to change based on the clock time.

As a result, I have a generative clock that is interesting to stare and keep record to see what kind of forms generate as time passes.

Looking outwards-06 randomness

https://chriscummins.cc/s/genetics/#

This is a generative art that consist of the genetic Algorithms.

This works by using the genetic algorithm to model a population of individuals, each containing a string of DNA which can be visualized in the form of an image. It starts with a population consisting randomly generated gene pool, then each is compared against the reference image. Each individuals are ranked by their likeness to it and display the fittest image for generative process. DNA with most accurate representation of the reference image is selected over previous generation and constantly generating best candidate. I appreciate this project not only because it is randomly generated but it is combining the field of coding into biology. He released the code of this algorithm on his github website.

yoonseo1-project5 Wall paper

Davewall

////Yoonseo(Dave) Choi
//Section B
//yoonseo1@andrew.cmu.edu
//Project 05 - Wall Paper
function setup() {
    createCanvas(480, 480);
    background(0); //set back ground to black

}
 
function draw() {
	noStroke(); // removing Stroke from the petals
    for (var p = 0;p < 12; p ++){ // setting for loop for patter
    	for (var j = 0; j <12; j ++){
    		var red = map(p*200,0,height,0,255);  //color set for red
            var green = map(j*200,0,width,0,255); //color set for green 
    		petal(p*200+90,j*200+90,red,green,random(0,255)); //execute petal 
    		stroke(255,4); //set stroke color
    		line(p*40,0,p*40,height); //vertical stroke
    		line(0,p*40,p*40,0); // diagonal stroke
    		line(width,p*40,p*40,height); // diagonal stroke
    		noStroke(); // no stroke for the petal

    	}
   }
   noLoop(); //only run once
}

function petal(x,y,r,g,b){ //petal function
	push(); // setting geomety
	scale(0.45); //scale down whole thign by 0.45 too big initially
	fill(r,0,b); // set color of petals
	rectMode(CENTER); // settting center to middle
	translate(x,y); //translate to x, y coordinate given at execution
	for (var i = 0; i < 6; i ++){ //for loop for petal rotation
	push(); 
	scale(1.1) //scale petals up by 1.1
	rotate(TWO_PI*i/6); //make them rotate around the center 
	translate(50,0); //translate them 50 from the cente 
	rotate(180); //rotate the single petals by 180 to create form intended
	beginShape(); //half of petal
	vertex(40,20);
	bezierVertex(70,30,40,50,40,60);
	endShape();
	beginShape(); //another half of petal
	vertex(40,20);
	bezierVertex(-10,35,40,50,40,0);
	endShape();
	pop();// pop the form 

	}
	pop(); //pop the whole 
	}

For this project I started with a flower initially to create a wall paper pattern. I started to modify the form from there and transformed the petals into irregular petal shapes. I have populated them by giving 6 petals a center. I had to scale the petal sizes down because they were too big initially. I have used the color to give random variation through out the wall paper. I have used for loop and random variable for the color lies inside of the loop. After the placement of the petals, it needed extra color of form to contrast with. I decided to put white transparent thin lines to give emphasis on the petals and contrast through out whole wall paper pattern.

yoonseo1-Looking outwards5

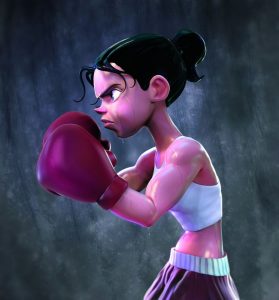
This is “Fight like a girl” by self-taught illustrator and graphic designer Aliel Rocha Prates. I admire two things about this project. First is the creator is self taught and she has produced this amazing art work. I consider that the depiction of any kind of liquid in art work is one of hardest challenge to achieve. I do not exactly know how she has created the art, but I can guess initial was done in sketch form than into the production of form and shape then she post-processed in photoshop for wet skins and illumination. In her website, all of the works seem to remind me of Pixar. Her works are not realistic but very fun to look at the illustration.

Project 04-String Art

Dave String

//Yoonseo(Dave) Choi
//Section B
//yoonseo1@andrew.cmu.edu
//Project-04
//String Art
var slider; //slider variable
var n; // output variable for sequence
var spix; //x coordinate variable for spiral sequence 
var spiy; //y coordinate variable for spiral sequence
var nn; //simple sequence variable to connect with spiral
var Svalue;  //variable for slider value
function setup() {
    createCanvas(400, 300); // set canvas size to 400,300
    slider = createSlider(0,170,0); // slider that value goes from 0,170 and start value with 0
}
function draw() {
    Svalue = slider.value(); //return slider value to Svalue
    background(0); //set background color to black
    //sequence();
    
    stroke(255,255,255,70);//set color to be white and Alpha value of 100
    strokeWeight(1) // stroke weight to be 1 pix. 
    sequence(); //execute simple sequence function. 
    Bloom(); // execute Bloom function
}


function sequence(){ //simple arithmatic sequence
    for (var i =0; i <=Svalue; i+=5){ // increment of i in 5s if smaller than slider
        n = 2*i+1; //out put equation

        line(0,height/2+n,n*3,height); // sequence and inverse connected on left bottom corner 
        line(width,height/2+n,width-n*3,height); //Same on right bottom corner
        line(0,height/2-n,n*3,0); //same on left top corner
        line(width,height/2-n,width-n*3,0); //same on right top corner. 
    }
}
function Bloom(){
    for (var j = 0; j <=Svalue/100; j+= 0.1){// slider value divided by 100 to fit trigonomatric values. 
        //based on r(t) = exp(t) in polar equation
        spix = exp(j)*cos(j); //x coordinate based on cos with exponaential value
        spiy = exp(j)*sin(j); //y coordeinate based on sine with exponential value
        //top and bottom of flower
        line(width/2+spix*20,height/2+spiy*20,width/2-spix*20,height/2+spiy); //connecting lines to each points generated
        line(width/2-spix*20,height/2-spiy*20,width/2+spix*20,height/2-spiy);
        line(width/2-spix*20,height/2+spiy*20,width/2+spix*20,height/2-spiy);
        line(width/2+spix*20,height/2-spiy*20,width/2-spix*20,height/2+spiy);
        //left and right of flower
        line(width/2+spiy*20,height/2+spix*20,width/2-spiy*20,height/2+spix);
        line(width/2-spiy*20,height/2-spix*20,width/2+spiy*20,height/2-spix);
        line(width/2-spiy*20,height/2+spix*20,width/2+spiy*20,height/2-spix);
        line(width/2+spiy*20,height/2-spix*20,width/2-spiy*20,height/2+spix);
        for (var w = 0; w <=Svalue;w+=60){ //connecting the polar equation with linear sequence
            nn = 2*w+1; //same sequence as above
            line(width/2+spiy*20,height/2+spix*20,width,height/2+nn); // connecting sequence with points on same quadrant
            line(width/2-spiy*20,height/2+spix*20,0,height/2+nn);   //left borrom corner
            line(width/2+spiy*20,height/2-spix*20,0,height/2-nn);   // left top corner
            line(width/2-spiy*20,height/2-spix*20,width,height/2-nn); // right top corner
        }
    }
}

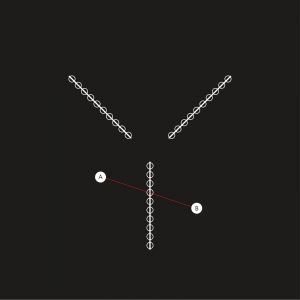
For this project, I wanted to look into other equations rather than simple arithmetic equations. I tried to incorporate the polar equation (spiral,r(t) = exp(t))to generate interesting shape and line movements. I added the slider so user can interact with the shape and see the process of generating.

Looking outwards-04

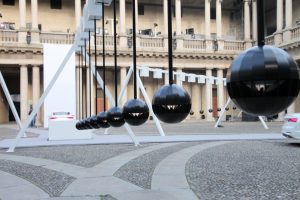
This is a project that comes to me as unique. I enjoy watching movie on AIs or reading articles on AI’s learning capabilities. This is Sonic Pendulum by Yuri Suzuki Design Studio. At first pendulum seems to be essential part of the project, but it is not. Pendulums are generating calming ambient sound, but the algorithm is using space and crowd in surrounding to create new composition of sounds. Most impressive part is that if this was normal project, they would have used algorithm to be fixed, which will generate similar sound over periods of time; however, team trained the AI to create infinite composition, which is site and moment to moment specific. This project shows that it is not only possible to make program react vibrantly with surrounding, but also possible to adapt and trained to generate new type of compositions. 

Project 3-Dynamic Art

Dave Dynamic

//Yoonseo(Dave) Choi
//Section B
//yoonseo1@andrew.cmu.edu
//Assignment-03-B
//variable for Bezier curvature 
var Curv;
//variable for Red, Green, Blue color. 
  var R = 0;
  var B = 0;
  var G = 0;
  function setup() {
  createCanvas(640, 480); //setting Canvas size to 600x480
  //No fill for any geometry
  noFill();
  //initializing Curv 
  Curv = 0;
}
function draw() {
  //adding random number to Red for change of color when it is < 255 
  
  //adding random number to Blue for change of color when it is < 255 
 
   //adding random number to Green for change of color when it is < 255  

  //When any of R,G,B elements are over 255, it resets to 0.
  if (R >= 255){
    R = 0;
  }
  if (G >= 255){
    G = 0;
  }
  if (B >= 255){
    B = 0;
  }
  //variable for color c
  var c = color(R,B,G);
  //continuously assign color variable to stroke
  stroke(c, 10);
  //setting up standard place for x and y coordinate. 
  var x = width/2;
  var y = height/2;
  //Dividing the canvas into four difference quadrant. 
  if (mouseX > x & mouseY < y ) { //when mouse is on right top quadrant
    Curv += mouseX/60; //Curv value goes up randomly from 1 to 5
    R += mouseX/120 + mouseY/50;// Red is sum of differenct X and Y value
   }
   if (mouseX < x & mouseY < y){//when mouse is on left top quadrant
    Curv -= mouseY/30; //Curv value goes down randomly from 4 to 12
    B += mouseX/40 + mouseY/80;// Blue is sum of differenct X and Y value
   }
   if (mouseY > y & mouseX > x){//when mouse is on right bottom quadrant
    Curv += mouseY/60;//Curv value goes up randomly from 4 to 12
   }
   if (mouseY > y & mouseX < x){//when mouse is on left bottom quadrant
    Curv -= mouseX/30;//Curv valvue goes down randomly from 1 to 5
    G += mouseX/70 + mouseY/100;// Green is sum of differenct X and Y value
   }
   //when Curv is larger than height or width, or less than 0 , it will reset to 0.
  if ( Curv > height || Curv < 0 || Curv > width){ 
    Curv = 0;
   }
   //setting background to black 
  background(0);
  //bezier curves.
  //each for statement is used to generate multiple bezier curve based on increment of i value
  //bezier curve assigns, anchor points and control points to create paramatric curve. 
  //bezier(anchor pts, anchor pts, control pts, control pts, control pts2,control pts2, anchor pts2,anchor pts2)
  for (var i = 0; i < mouseX; i += 30){
    bezier(mouseX-(Curv+i/2.0), mouseY-Curv+i, Curv*2, Curv, Curv*2, Curv*2, mouseX, 0);
  }
  //based on the i and z constraint, number of lines are decided. 
  // i or z's constraints are defined by mouse X adn Y position
  // all the position of the anchor points are based on the mouse X and Y 
  for (var z = 200; z < mouseY; z += 30){
    bezier(mouseX-(Curv+z/2.0), mouseY-Curv+z, Curv*4, Curv/6, Curv*3, Curv*2, width-mouseX, 0);
  }
 for (var i = 0; i < height-mouseY; i += 30){
    bezier(mouseX+(Curv+i/2.0), mouseY+Curv+i, Curv*2, Curv, Curv*2, Curv*2, 0, mouseY);
  }
  for (var z = 200; z < width-mouseX; z += 30){
    bezier(mouseX+(Curv+z/2.0), mouseY-Curv+z, Curv*4, Curv/6, Curv*3, Curv*2, width, height-mouseY);
  }
  

}

For this Dynamic art project, I focused on the movement of line in a curve form. At first, I wanted to express very light wing like motion based on the mouse position. I abstracted the initial concept and created the following digital illustration of movement. Fortunately, I found a example at p5js website that resembles part of what I imagined. I took that example and modified to create my own dynamic art.

Looking Outwards 3:Computational Fabircation

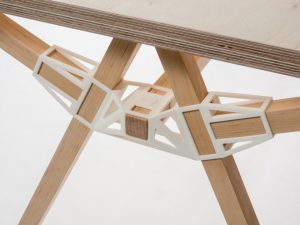
This is Furniture project that collaborated with 3D printing technique. It is done by Studio Minale-Maeda. This project comes to me as inspirational project and differentiate from lots of 3D printed projects that I have seen. Most of 3D printed projects I have seen are consisted of abstract shapes, or stands out by itself. This was interesting concept because it is interacting with the other physical material as part of structural support with addition to its aesthetic. Generating this type of structure requires the understanding of the initial structure of the table, or any type of furniture, then removing some parts of structure and replace the existing with newly developed 3D printed parts.