//Anna Boyle
//Section D
//aboyle@andrew.cmu.edu
//Project 07 Curves

function setup() {
    createCanvas(480,480);
}

function draw() {
    background(38,48,97)
    //draws all the stars/moons
    //Placement and size deliberately chosen by me
    push();
    translate(width/2, height/2-30);
    drawHypotrochoid()
    pop();
    push();
    translate(50,100);
    scale(0.2,0.2);
    drawHypotrochoid();
    pop();
    push();
    translate(400,50);
    scale(0.15,0.15);
    drawHypotrochoid();
    pop();
    push();
    translate(220,40);
    scale(0.1,0.1);
    drawHypotrochoid();
    pop();
    push();
    translate(100,350);
    scale(0.25,0.25);
    drawHypotrochoid();
    pop();
    push();
    translate(30,240);
    scale(0.1,0.1);
    drawHypotrochoid();
    pop();
    push();
    translate(420,400);
    scale(0.2,0.2);
    drawHypotrochoid();
    pop();
    push();
    translate(360,340);
    scale(0.1,0.1);
    drawHypotrochoid();
    pop();
    push();
    translate(410,180);
    scale(0.17,0.17);
    drawHypotrochoid();
    pop();
    push();
    translate(50,430);
    scale(0.1,0.1);
    drawHypotrochoid();
    pop();
    fill(255)
    //text to show how many sides there are
    textSize(20)
    text("SIDES:",15,30)
    text(sides,85,30)
    textSize(30)
    //"Goodnight, moons" when circles
    //"Goodnight, stars" when star-shaped
    if (mouseY<100){
        celestial="moons"
  } if (mouseY>380){
        celestial="stars"
  } if (mouseY>=100 & mouseY<=380){
        celestial="."
        fill(38,48,97)
  }
    text ("Goodnight, ", 130, 410)
    text(celestial,285,410)

}

//how many sides there are
var sides=4

function drawHypotrochoid(){
    var x;
    var y;
    //makes the shapes bigger or smaller
    var a=constrain(mouseX/4, 40, 130);
    var b=a/sides
    var h=constrain(mouseY/16, 0, b)
    var ph=mouseX/50
    var nPoints=100
    noStroke()
    fill(243,250,142)
    //the equation for the curve
    beginShape();
        for (var i=0; i<nPoints; i++){
        var t=map(i, 0, nPoints,0,TWO_PI);
        x = (a-b) * cos(t) + h * cos(ph + t*(a-b)/b);
        y = (a-b) * sin(t) - h * sin(ph + t*(a-b)/b);
           vertex(x,y)
    }
    endShape(CLOSE);
}

//If mouse is pressed, another side is added
//stays between 4 and 8 sides
function mousePressed(){
    sides=sides+1
      if (sides>8){
          sides=4
  }
}
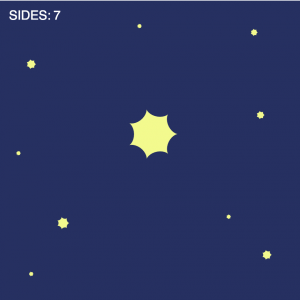
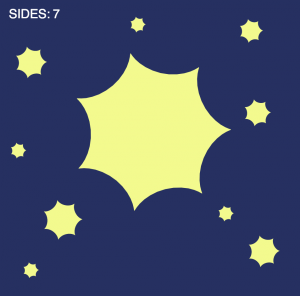
For the type of curve, I selected hypotrochoid. (http://mathworld.wolfram.com/Hypotrochoid.html). Since it was fairly similar to epitrochoid curves, I referenced the example while I was writing my code. I had some trouble making it look like what I wanted it to; for a while, it was only a circle that got thinner or wider as you moved the mouse. Eventually I figured out that the number you divide variable a by is the number of sides. When I increased that number, it looked a lot more like the example image given on mathworld.wolfram.com. I made it so the curve starts with four sides, but you can add up to eight by clicking the mouse. You can make the curve bigger or smaller by moving the mouse from left to right or vice versa.


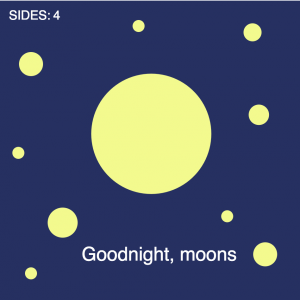
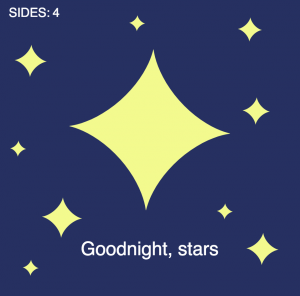
Somewhere along the line I realized that the two extremes were a circle and a star shape, so I made it a sky full of celestial objects and I added the text “Goodnight, moons” and “Goodnight, stars” when the mouse was at the top and the bottom.


I wish I had done more to experiment visually, but overall I enjoyed this project!
![[OLD FALL 2017] 15-104 • Introduction to Computing for Creative Practice](wp-content/uploads/2020/08/stop-banner.png)