Christine Chen-Project-07-Curves

Christine Chen-Project-07-Curves

/*
Christine Chen
Section E
cyc1@andrew.cmu.edu
Project-07-Curves
*/

var nPoints = 100;
var eyeSize = 10;
var pupilSize = 5;

function setup() {
    createCanvas(480, 480);
    frameRate(10);
}

function draw(){
    background(189, 232, 252); //blue

    leaves();
    push();
    translate(width/2, height/2);
    drawHeart();
    pop();
    eye();
    blush();
    mouth();
}

function drawHeart(){
    //color
    noStroke();

    //peach turns "ripe" when its big
    if (mouseY > 130){ 
        fill(255, 178, 182); //light pink
    } else {
        fill(192, 222, 188); //light green
    }

    //heart
    beginShape();
    for (var i = 0; i < nPoints; i++) {
        var t = map(i, 0, nPoints, 0, TWO_PI);

        x = 16 * pow(sin(t), 3);
        y = 13 * cos(t) - 5 * cos(2 * t) - 2 * cos(3 * t)
             - cos(4 * t) * mouseX/90;

        mouseX = constrain(mouseX, 80, 70);
        mouseY = constrain(mouseY, 80, 200);

        x = map(x, -1, 15, -1, mouseY);
        y = map(y, -1, 15, -1, mouseY);

        vertex(x, y);
    }
    endShape(CLOSE);
}

function eye(){
    fill(0); //black
    var eyeLX = width/2 - 20 - mouseY/10;
    var eyeRX = width/2 + 20 + mouseY/10;
    ellipse(eyeLX, height/2, eyeSize, eyeSize); //left eye
    ellipse(eyeRX, height/2, eyeSize, eyeSize); //right eye
}

function blush(){
    noStroke();
    fill(229, 51, 60); //red
    var blushLX = width/2 - 20 - mouseY/7;
    var blushRX = width/2 + 20 + mouseY/7;
    ellipse(blushLX, height/2 + 15, eyeSize + 20, eyeSize); //left 
    ellipse(blushRX, height/2 + 15, eyeSize + 20, eyeSize); //right 
}

function mouth(){
    fill(232, 91, 98); //dark pink
    ellipse(240, 260, mouseY/10, mouseY/10);
}

function leaves(){
    noStroke();
    fill(112, 230, 134);

    //bigger leaves
    var leafLX = width/2 - 70;
    var leafRX = width/2 + 70;
    ellipse(leafLX, height/2 + 100, 150, 100); //left 
    ellipse(leafRX, height/2 + 100, 150, 100); //right 

    //smaller shadows on top
    fill(107, 221, 129);
    ellipse(leafLX + 20, height/2 + 90, 110, 80); //left 
    ellipse(leafRX - 20, height/2 + 90, 110, 80); //right 
}


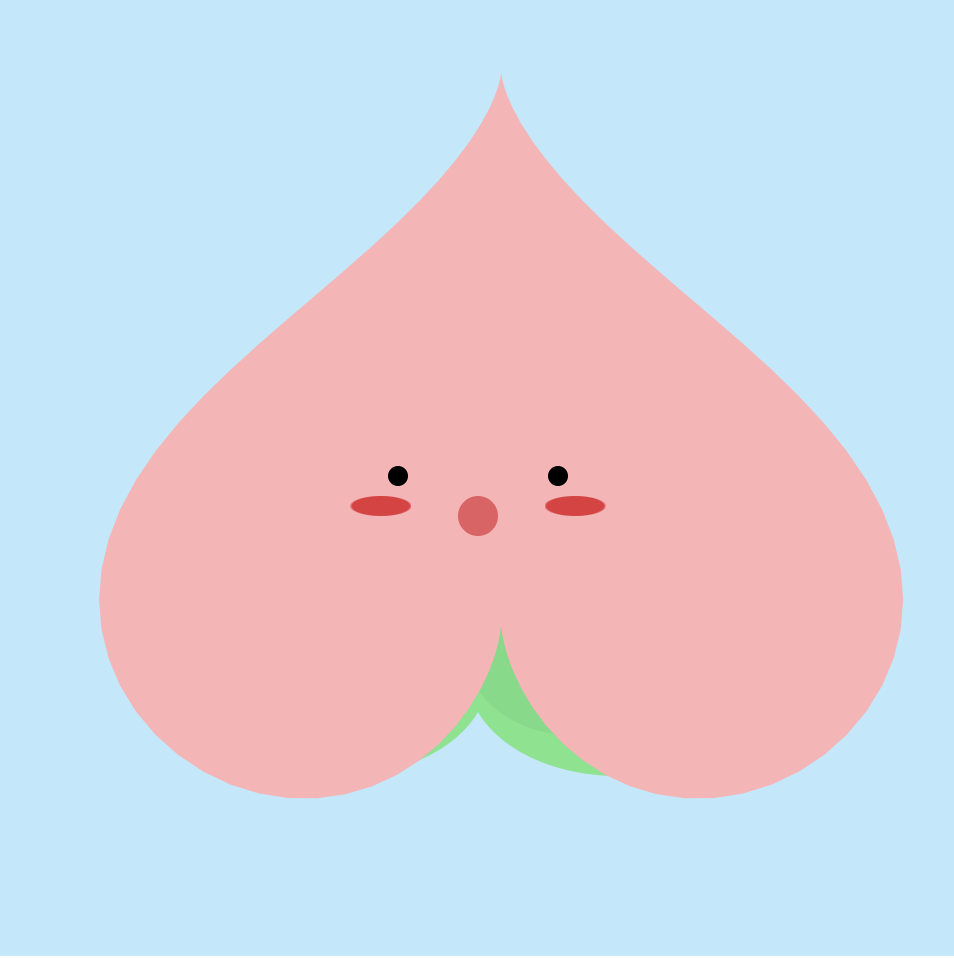
I was initially just playing with the heart curve. Then when I made it pink, the idea of making it into a peach came to my mind. When the peach is small, it is unripe and so it is green. Once it gets big(once mouseY is larger than a particular point) it becomes ripe(pink). I initially wanted to play around with the curve even more, but I realized that doing so would make the shape not a heart, which wouldn’t work with the idea of a peach. Thus, I just play around with making the curves change “rationally”(so it keeps the shapes of a heart) according to the mouse positions.
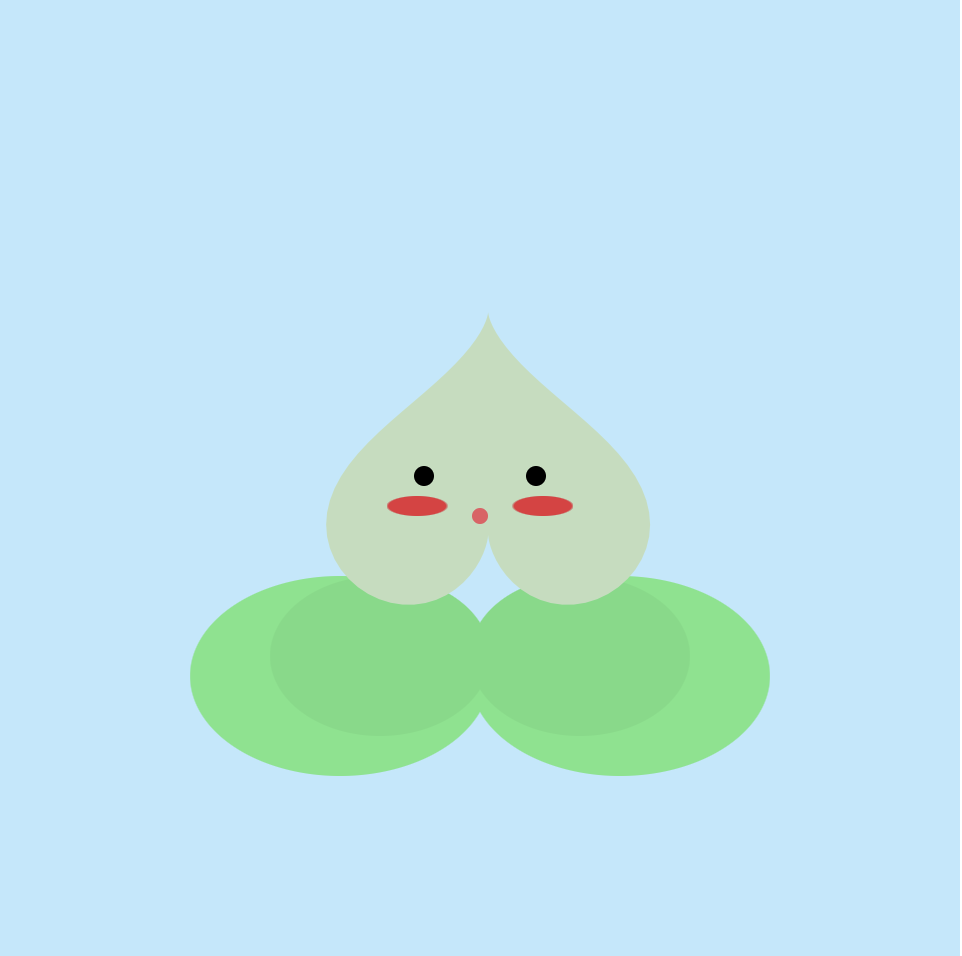
Unripe State
Ripe state


Vicky Zhou – Project 07 – Curves

sketch

/*Vicky Zhou
Section E
vzhou@andrew.cmu.edu
Project_07_Curves*/

var nPoints = 50; //amount of mapped out points
var EPITROCHOID1 = 0; // parametric form 
var HYPOTROCHOID = 0; //parametric form

function setup() {
    createCanvas(480, 480);
}

function draw() {
	background(15, 15, 25);
	translate(width/2, height/2);
	//draw light blue epitrochoid curve
	drawEPITROCHOID1();
	//draw light pink hypotrochoid curve
	drawHYPOTROCHOID();
	//draw orange circle epitrochoid curve
	drawEPITROCHOID2();
	//draw yellow circle epitrochoid curve
	drawEPITROCHOID3();
}

function drawEPITROCHOID1() {
	push();
	stroke(140, 200, 240);
	strokeWeight(0.75);
	noFill();
	var x; //x pos
	var y; //y pos
	var t = 90; //angle variable
	var b = constrain(mouseX / 100, 0, 10); //outside curve variable
	var h = map(mouseY, 0, mouseY, 30, height/2); //height variable
	beginShape();
	for (var i = 0; i < nPoints; i ++){
		var a = map(i, 0, nPoints, 0, TWO_PI); //inside circle size variable 
		x = (a + b) * cos(t) - h * cos (((a + b) / b) * t); //parametric eq1
		y = (a + b) * sin(t) - h * sin (((a + b) / b) * t); //parametric eq2
		vertex (x + random(0, 2), y + random(0, 2));
	}
	endShape();
	pop();
}

function drawHYPOTROCHOID() {
	push();
	strokeWeight(0.5);
	stroke(190, 140, 140);
	noFill();
	var x; //x pos
	var y; //y pos
	var t = constrain(mouseX / 10, 0, 100); //angle variable
	var b = 5; //outside curve variable
	var h1 = constrain(mouseX/ 2, width/4, width/3); //height variable 1 
	var h2 = constrain(mouseY/2, width/3, width/2); //height variable 2
	beginShape();
	for (var i = 0; i < nPoints; i++){
		var a = map(i, 0, nPoints, 0, TWO_PI); //inside circle size variable
		x = (a - b) * cos(t) + h1 * cos(((a - b)/b) * t);
		y = (a - b) * sin(t) + h2 * sin(((a - b)/b) * t);
		vertex(x, y);
	}
	endShape();
	pop();
}

function drawEPITROCHOID2() {
	push();
	noStroke();
	fill(100, 130, 190);
	var x; //x pos
	var y; //y pos
	var t = 100; //angle variable
	var b = constrain(mouseX / 100, 0, 10); //outside curve variable
	var h = constrain(mouseX/2, 0, 100); //height variable
	beginShape();
	for (var i = 0; i < nPoints; i ++){
		var a = map(i, 0, nPoints, 0, TWO_PI); //inside circle size variable 
		x = (a + b) * cos(t) - h * cos (((a + b) / b) * t); //parametric eq1
		y = (a + b) * sin(t) - h * sin (((a + b) / b) * t); //parametric eq2
		ellipse(x + random(-1, 1), y + random(-1, 1), 5, 5);
	}
	endShape();
	pop();
}

function drawEPITROCHOID3() {
	push();
	stroke(160, 140, 110);
	strokeWeight(0.3);
	noFill();
	var x; //x pos
	var y; //y pos
	var t = 190; //angle variable
	var b = constrain(mouseX, 0, 5); //outside curve variable
	var h = map(mouseY, 0, mouseY, 30, height/2); //height variable
	beginShape();
	for (var i = 0; i < nPoints; i ++){
		var a = map(i, 0, nPoints, 0, TWO_PI); //inside circle size variable 
		x = (a + b) * cos(t) - h * cos (((a + b) / b) * t); //parametric eq1
		y = (a + b) * sin(t) - h * sin (((a + b) / b) * t); //parametric eq2
		vertex(x + random(-5, 5), y + random(-3, 3));
	}
	endShape();
	pop();
}

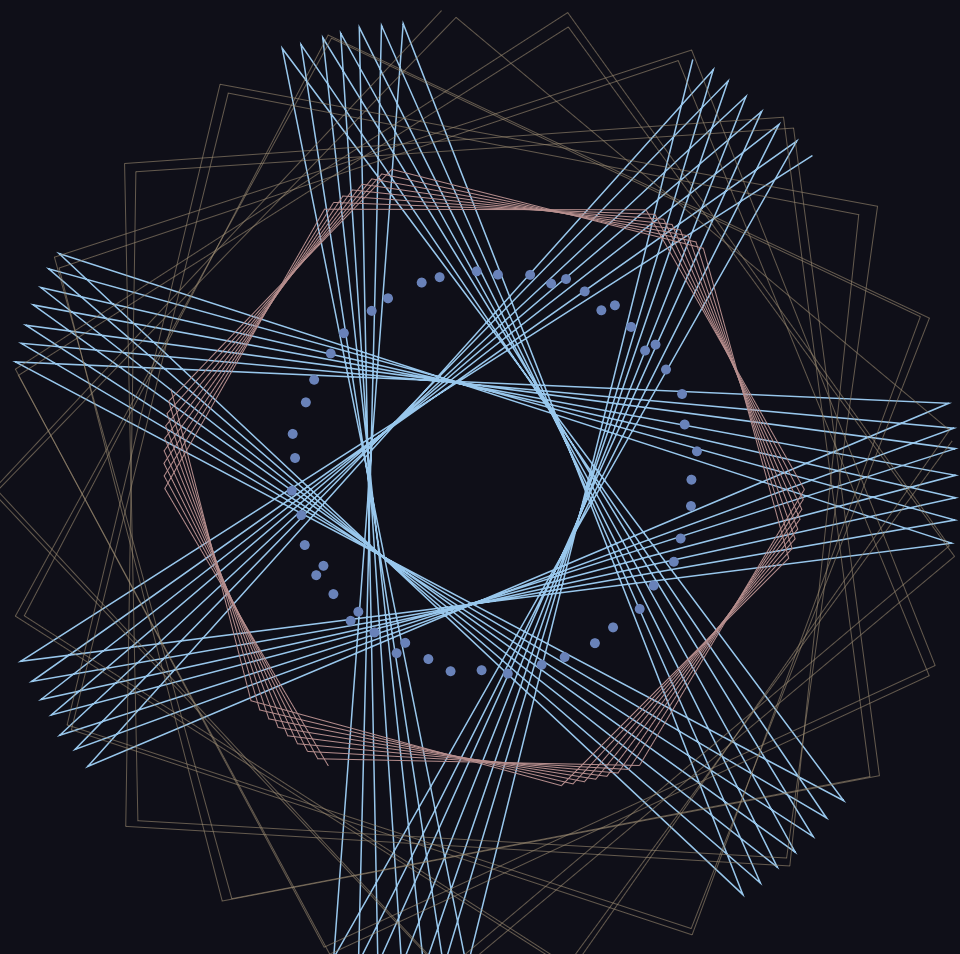
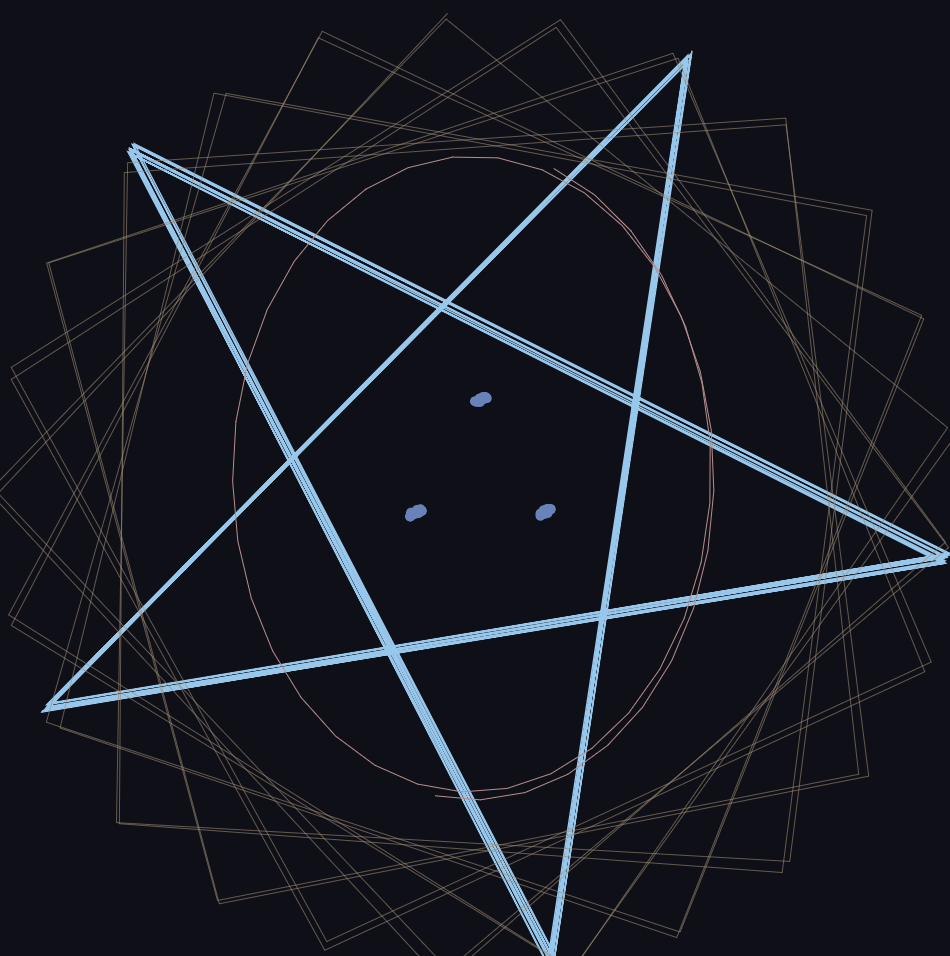
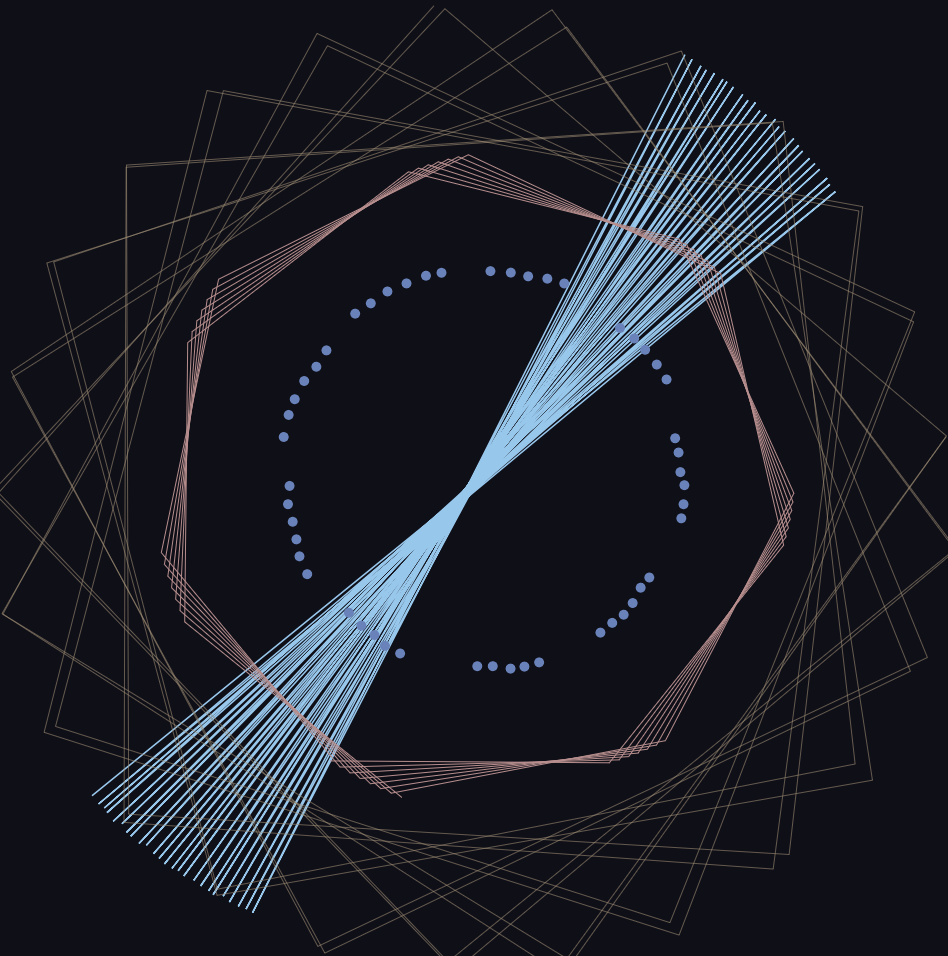
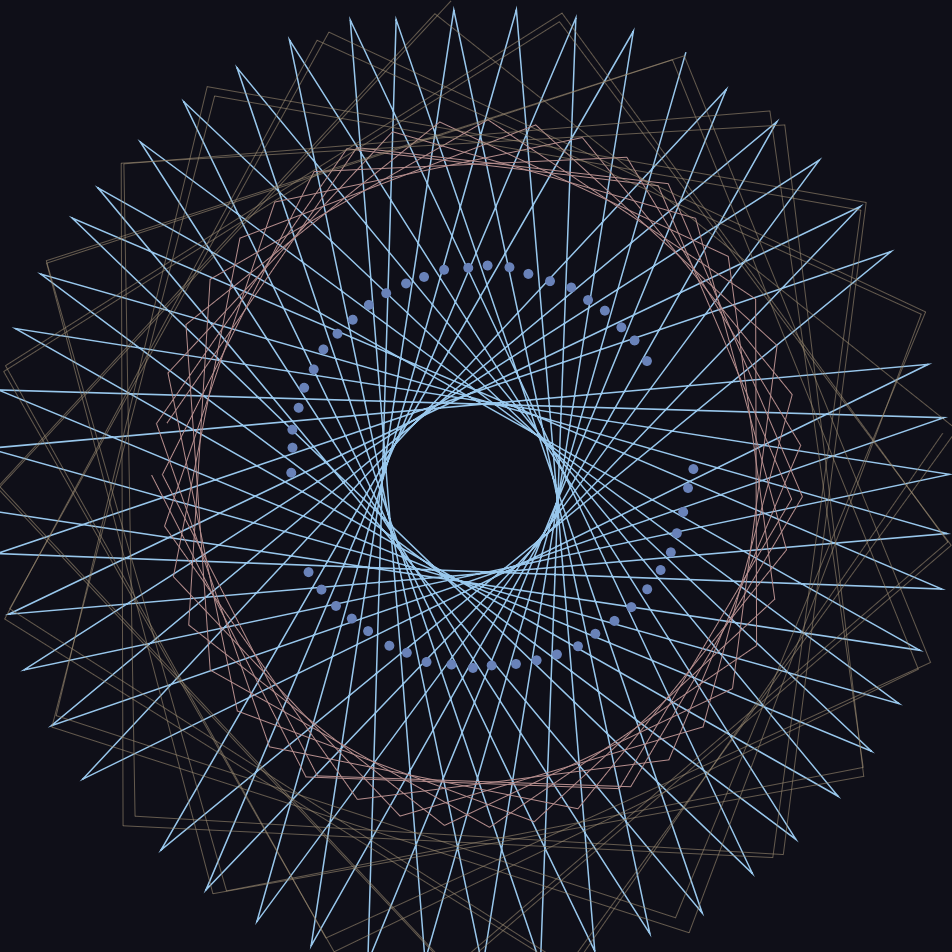
This project was incredibly satisfying to make! Although it was a bit of a struggle at first to understand what each variable manipulated in the curve, plugging in random values and seeing what was affected was helpful and how I learned how to manipulate my curves into the desired look. I added a bit of “jitter” effect to my curves as well because I enjoy how they make the piece feel like it is constantly interactive even when the user is not altering the curves. For future iterations and/or ideas I think it would be interesting to incorporate equations that are not necessarily parametric, explicit, and/or polar.

Example 1
Example 2
Example 3
Example 4

Audrey Zheng – Project – 07

sketch

//Audrey Zheng
//Section A
//audreyz@andrew.cmu.edu
//Project-07


function setup() {
    createCanvas(400, 600);
}

function draw() {
	background(81,60,85);
    push();
    translate(width / 2, height / 3);

	drawHypotrochoid();
	drawHypocycloid();
	drawEpicycloid();

	pop();

	drawFlower(40,20);
    
}

function drawFlower(x,y) {

    translate(x, y);
	drawHypotrochoid();
	drawHypocycloid();
	drawEpicycloid();


}

function drawHypotrochoid() {
	var x;
	var y;

	var a = 100; //radius
	//var a = map(mouseX,0,width, 50,90);
	var b = 20; //spirograph radius

	//var b = map(mouseX,0,width,5,20);
	 //distance pen to center of spirograph

	var h = map(mouseX, 0, width, 40,60);

	
	//var h = map(mouseX, 0, width, 40,60);

	angleMode(DEGREES);
	stroke(189,230,137);
	fill(82,82,115);

	beginShape();


	for (var t = 0; t < 360; t++) {
		x = (a - b) * cos(t) + h * cos(((a - b)/b) * t);
		y = (a - b) * sin(t) - h * sin(((a - b))/b * t);


		vertex(x,y);


	}

	endShape(CLOSE);


}

function drawHypocycloid() {
	var x;
	var y;

	var a = 50; //radius
	//var a = map(mouseX,0,width, 50,90);
	var b = 10; //spirograph radius
	var n =  a/b;

	angleMode(DEGREES);

	stroke(98,210,159);
	fill(57,138,166,70);

	beginShape();
	var multiple = map(mouseY,0,height, -1,1)

	for (var phi = 0; phi <360; phi ++) {
		
		x = (a/n) * ((n-1) * cos(phi) - cos((n-1) * phi));

		y = (a/n) * ((n-1) * sin(phi) + sin((n-1) * phi));

		vertex(multiple *x,multiple *y);

	}
	endShape(CLOSE);
}

function drawEpicycloid() {
	var x;
	var y;

	var a = 40; //radius
	//var a = map(mouseX,0,width, 50,90);
	var b = 5; //spirograph radius

	angleMode(DEGREES);


	beginShape();


	var multiple = map(mouseY, 0, height, 1,2);;

	for (var phi = 0; phi <360; phi ++) {
		
		x = (a+ b) * cos(phi) - b * cos(((a + b)/b) * phi);

		y = (a + b) * sin(phi) -  b * sin(((a+b)/b) * phi);

		vertex(multiple *x, multiple *y);


	}
	endShape(CLOSE);

}


Philip Gates – Project 07 – Curves

sketch

var nPoints = 200;  //set number of vertex points for trifolium shape

function setup() {
    createCanvas(400, 400);
}

function draw() {
    background(255);
    noStroke();
   
    //draw center trifolium
    push();
    translate(width/2, height/2);
    fill("blue");
    drawTrifolium();
    pop();

    //draw upper left trifolium
    fill("violet");
    drawTrifolium();

    //draw upper right trifolium
    push();
    translate(width, 0);
    fill("violet");
    drawTrifolium();
    pop();

    //draw lower left trifolium
    push();
    translate(0, height);
    fill("violet");
    drawTrifolium();
    pop();

    //draw lower right trifolium
    push();
    translate(width, height);
    fill("violet");
    drawTrifolium();
    pop();
}

//draw Trifolium shape based on mouseX, mouseY
function drawTrifolium() {

    var x;
    var y;
    var r;
    var theta;

    var a = mouseY; //mouseY governs size of trifolium
    var petals = map(mouseX, 0, width, 2, 45); //mouseX governs number of petals
    var petalsInt = round(petals); //rounds petals to nearest integer (no partial petals)

    //create base trifolium shape using equation from Mathworld
    beginShape(); 
    for (var i = 0; i < nPoints; i++) {
        theta = map(i, 0, nPoints, 0, TWO_PI);
        r = -a * cos(petalsInt * theta);
        x = r * cos(theta);
        y = r * sin(theta);
        vertex(x,y);
    }
    endShape(CLOSE);
}

I found the trifolium curve on Mathworld and decided to see what it could do.

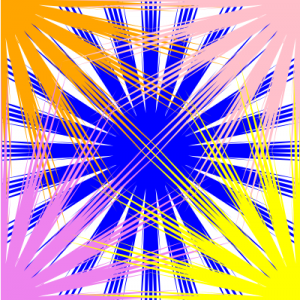
I discovered that changing one number in the equation would cause more “petals” to appear on the trifolium (making it not exactly a “tri”folium anymore, but it looks great), and set this to mouseX. Testing another variable, I found it governed the size of the trifolium shape, so I set this to correspond to mouseY.

To make things more interesting, I added four more trifoliums in the corners of the canvas (so only a corner of each was visible). I started with each one a different color:

…but decided I preferred the patterns that emerged when all 4 corner shapes were the same color, creating a more ambiguous web rather than 4 distinct shapes.

Xindi Lyu-project 07- Curves-Section A

sketch

 
/*
Xindi Lyu
Section A
xindil@andrew.cmu.edu
*/


var nPoints = 100;
var HYPOCYCLOID = 1;
var EPICYCLOID = 0;
var curveMode = HYPOCYCLOID;

function setup() {
    createCanvas(500, 500);
    frameRate(10);
        }


function draw() {
    
    push();
    translate(250,250);
    switch (curveMode){
        case HYPOCYCLOID:
        drawHypocycloid();
        break;
        case EPICYCLOID:
        drawEpicycloid();
        break;
    }
    pop();


    }


function drawHypocycloid() {//drawcurve
    background(200,200+mouseX*0.1,200+mouseY*0.1);//make the changing background for Hypocycloid
    var x;
    var y;
    var a=map(mouseX, 0, 500, 1, 100);//size of the geometry
    var n=map(mouseX, 0, 500, 1, 15);//devision of thhe curve
    fill(200,150+mouseX*0.1,200+mouseY*0.1);//fill the geometry with changing color 
    
    stroke(0.4*mouseX+0.4*mouseY);//change the ourline color
    beginShape();
    for(var i=0; i<nPoints; i++){
        var t = map(i, 0, nPoints, 0, 2*PI);
        x=a*(((n-1)*cos(t)+cos((n-1)*t))/n);
        y=a*(((n-1)*sin(t)-sin((n-1)*t))/n);
        vertex(x+random(-5,5),y+random(-5,5));
    }
    endShape(CLOSE);
}


function drawEpicycloid() {//drawcurve
    background(200,150+mouseX*0.1,200+mouseY*0.1);//make the changing background for Epicycloid
    var x;
    var y;
    var a=map(mouseX, 0, 500, 1, 100);//size of the geometry
    var n=map(mouseY, 0, 500, 1, 15);//devision of thhe curve
    fill(200,200+mouseX*0.1,200+mouseY*0.1);;//fill the geometry with changing color 
    stroke(0.4*mouseX+0.4*mouseY);
    beginShape();
    for(var i=0; i<nPoints; i++){
        var t = map(i, 0, nPoints, 0, 2*PI);
        x=(a+n)*cos(t)-n*cos((a+n)/n*t);
        y=(a+n)*sin(t)-n*sin((a+n)/n*t);
        vertex(x+random(-5,5),y+random(-5,5));
    }
    endShape(CLOSE);
}

function mousePressed(){
    curveMode = 1- curveMode;//switch between geometries
}

For this project I experimented with two different types of curves and rendering them with the jittering effect to add a lively feeling to the image.

Jenna Kim (Jeeyoon Kim)- Project 7- Wallpaper

jeeyoonk07

/* Jenna Kim (Jeeyoon Kim)
Section E
jeeyoonk@andrew.cmu.edu
Project 7
*/

var nPoints = 360

function setup() {
    createCanvas(500, 500);
    
}

function draw() {
	//drawing curve
	background(130, 20, 40);
	push();
	translate(width / 2, height / 2);
	drawAstroidCurve();
	pop(); 

	fill(255, 100);
	textSize (30);
	textFont('Roboto');

	text("CHAOS", width / 2 - 50, 480);
}

function drawAstroidCurve() { //
	// Astroid;
	//Link: http://mathworld.wolfram.com/Astroid.html
	var x; 
	var y;
	var xR = constrain(mouseX, 0, 500);
	var ellipseR = map(mouseX, 0, 500, 10, 120);
	var a = map(xR, 0, 500, 40, 30);
	var b = map(xR, 0, 500, 50, 300);
	var h = constrain(mouseY, 0, 400);


	stroke(255);
	strokeWeight(0.5);

	//chaotic ASTROID CURVE
	beginShape();
	fill(130, 20, 40);
	for (var i = 0; i < nPoints; i++) {
		x = (4 * a * cos(i)) + (b * cos(3 * h * i));
	    y = (2 * a * sin(i)) - (b * sin(3 * h * i));
        vertex(x, y);
	};
	endShape(CLOSE);

	noStroke();
	fill(255);
	ellipse(3, 5, ellipseR, 50);
}

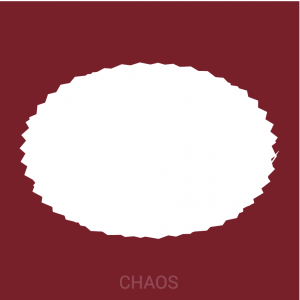
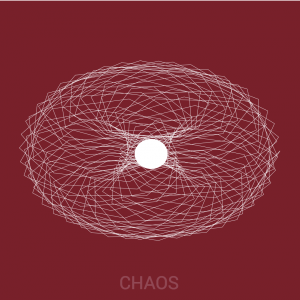
For this project, I wanted curves that combine to create a chaotic feeling. The ellipse in the middle is supposed to represent a ball of string, and make the whole canvas look like the string is “unraveling” from the ball of string (the ellipse in the middle). I used an Astroid curve from the MathWorld site to reference the function. At first, I was confused on how to utilize map(); and constrain(); to explore different curves and its sizes and limits. However, I eventually understood these concepts through this project. Throughout out the project, I was really amazed on how many variations of curves an asteroid that create although I input certain constraints.

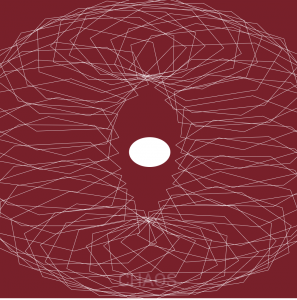
Below are my process work. The top picture shows that I struggled for awhile on how to make the curves show in thin lines. I realized that I had to fill them with background color. The bottom picture is another part of the process. I explored different constrain();.


Project-07: Jaclyn Saik

sketch

/* Jaclyn Saik 
Section E
jsaik@andrew.cmu.edu
Project 07
*/

var maxP = 100; //boundary for points plotted by the curve 
var chang = 1; //variable ised for flipping orientation of fish curve


function setup() {
    createCanvas(480, 480);
    noStroke();   
}

function draw() {
    background("PaleTurquoise");
    textSize(10);
    noStroke();
    fill("LightSeagreen");
    text("click me! yay!", 30, 70);
    text("¡a fish that is math!", 80, 300);
    text("math", 270, 400);
    text("glug....glug", 60, 430);
    text("so interactive!", 350, 30);

    translate(width/2, height/2); //puts axis in center of the canvas 
    if (mouseIsPressed) { //sets if statement that inverses fish curve when mouse is pressed
                chang = -1;
            } else {
                chang = 1;
            }
            print(chang); 
    drawFishie(); //calls fish function 
    drawFishie2();
    drawFishie3(); 
    drawFishie4();
}

function drawFishie() {
        var x; //x value for fish curve parametric equation 
        var y; //y value for fish curve parametric equation 
        var a = constrain(mouseY, 20, 450); //constrains a to value between 20 and 450
        var consT = map(mouseX, 0, width, 1, 5); //maps consT so that mouse X plots a number between 1 and 5
        stroke("peachpuff");
        fill("lightpink");
        
        beginShape();
        for (var i = 0; i < maxP; i++) { //for loop that sets maxiumum points form variable above 
            var t = map(i, 0, maxP, 0, TWO_PI); 

        //fish curve
        //http://mathworld.wolfram.com/FishCurve.html

        x = (a * cos(t)) - ((chang)*((a*(sq(sin(t))))) / 2); //change varibale inverses curve when mouse is pressed
        y = (a* cos(t) * (consT)*sin(t));  //constant manipulates the height of
        // the curve based on mouse x position      
        vertex(x, y);
    }
    endShape(CLOSE);
}

function drawFishie2() { //outline, which is slightly off
        var x; //x value for fish curve parametric equation 
        var y; //y value for fish curve parametric equation 
        var a = constrain(mouseY, 20, 450); //constrains a to value between 20 and 450
        var consT = map(mouseX, 0, width, 1, 10); //maps consT so that mouse X plots a number between 1 and 5
        stroke("tomato");
        strokeWeight(2);
        noFill();
        
        beginShape();
        for (var i = 0; i < maxP; i++) { //for loop that sets maxiumum points form variable above 
            var t = map(i, 0, maxP, 0, TWO_PI); 

        //fish curve
        //http://mathworld.wolfram.com/FishCurve.html

        x = (a * cos(t)) - (.5*(chang)*((a*(sq(sin(t))))) / 2); //change varibale inverses curve when mouse is pressed
        y = (a* cos(t) * (consT)*sin(t));  //constant manipulates the height of
        // the curve based on mouse x position      
        vertex(x, y);
    }
    endShape(CLOSE);
}

function drawFishie3() { //outline, which is slightly off
        var x; //x value for fish curve parametric equation 
        var y; //y value for fish curve parametric equation 
        var a = constrain(mouseY, 20, 400); //constrains a to value between 20 and 450
        var consT = map(mouseX, 0, width, 0, 5); //maps consT so that mouse X plots a number between 1 and 5
        stroke("salmon");
        strokeWeight(8);
        noFill();
        
        beginShape();
        for (var i = 0; i < maxP; i++) { //for loop that sets maxiumum points form variable above 
            var t = map(i, 0, maxP, 0, TWO_PI); 

        //fish curve
        //http://mathworld.wolfram.com/FishCurve.html

        x = (a * cos(t)) - (.5*(chang)*((a*(sq(sin(t))))) / 2); //change varibale inverses curve when mouse is pressed
        y = (a* cos(t) * 7*(consT)*sin(t));  //constant manipulates the height of
        // the curve based on mouse x position      
        vertex(x, y);
    }
    endShape(CLOSE);
}

function drawFishie4() { //outline, which is slightly off
        var x; //x value for fish curve parametric equation 
        var y; //y value for fish curve parametric equation 
        var a = constrain(mouseY, 20, 450); //constrains a to value between 20 and 450
        var consT = map(mouseX, 0, width, 0, 6); //maps consT so that mouse X plots a number between 1 and 5
        stroke("orange");
        strokeWeight(5);
        noFill();
        
        beginShape();
        for (var i = 0; i < maxP; i++) { //for loop that sets maxiumum points form variable above 
            var t = map(i, 0, maxP, 0, TWO_PI); 

        //fish curve
        //http://mathworld.wolfram.com/FishCurve.html

        x = (a * cos(t)) - (.7*(chang)*((a*(sq(sin(t))))) / 2); //change varibale inverses curve when mouse is pressed
        y = (a* cos(t) * 10*(consT)*sin(t));  //constant manipulates the height of
        // the curve based on mouse x position      
        vertex(x, y);
    }
    endShape(CLOSE);
}

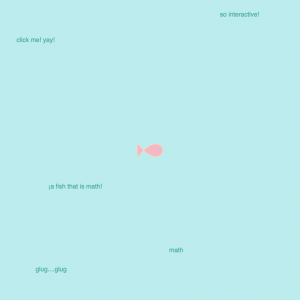
Fish Curve!
For this project, I had to experiment a lot with figuring out a way to build a shape that relied on the equations I gave it. I hadn’t really thought about it before, but we have been creating equations for the for loops we’ve been generating these past 2 weeks, so once I wrapped my head around this concept, I was able to understand how to plug these equations in and turn them into code. I originally played around with a cruciform curve (which I forgot to screenshot!), but after figuring out the fish curve, I wasn’t as inspired by it’s shape. The fish curve, by the way, is a curve that is based off an ellipse’s equation, with a pedal point at a specific point of eccentricity e^2 = 1/2. I had fun manipulating the variables on my various curves so that the different fish outlines took on slightly different characteristics, and adding interactions (click on screen!).


My first fish I created (after experimenting with a couple other types of curves, which I forgot to document. At first, I wanted to make the fish tiny like an actual fish, but I decided something that grew with the mouse was more exciting.

Jisoo Geum – Project 07 – Curves

sketch

// Jisoo Geum
// Section B
// jgeum@andrew.cmu.edu 
// Project-07
var x;
var y; 
var bR; // big radius outside 
var r; // smaller radius inside 
var d; // distance from the center of the interior circle 
var mx; // mouseX
var my; // mouseY 

function setup() {
    createCanvas(480, 480);
}

function draw() {
    background(255,0,0);
    translate(width/2, height/2);
    noFill();
    mx = constrain(mouseX,0, width);
// draw a Hypotrochoid with ellipses 
        strokeWeight(1);
        stroke(255);
        for (var a = 0; a < 2*TWO_PI; a ++){ // a is angle 
            bR = 50; // big radius 
            r = map( mx, 0, width, 10, 65 ); // small radius
            d = map( mx, 0, width, 10, 100 ); // distance 
            x = (bR-r)*cos(a) + d*cos( ((bR-r)/r)*a ) ;
            y = (bR-r)*sin(a) - d*sin( ((bR-r)/r)*a ) ;
        ellipse(0,0,x*5,y*7);
        }

// draw Nephroid
            strokeWeight(0.25);
            stroke(255);
            for (var a = 0; a < 10*TWO_PI; a ++){ // a is angle 
                bR = map( mx, 0, width, 0, 130 ); // big radius  
                x = bR*((3*cos(a)) -  (cos(3*a))) ;
                y = bR*((3*sin(a)) -  (sin(3*a))) ;
            ellipse(0,0,x*30,y*15);
            }

// draw Hypotrochoid 
    beginShape();
        strokeWeight(.75);
        stroke(255);
        for (var a = 0; a < 25*TWO_PI; a ++){ // a is angle 
            bR = 200;   // big radius 
            r = map( mx, 0, width, 10, 130 ); // small radius
            d = map( mx, 0, width, 10, 300 ); // distance 
            x = (bR-r)*cos(a) + d*cos( ((bR-r)/r)*a ) ;
            y = (bR-r)*sin(a) - d*sin( ((bR-r)/r)*a ) ;
        vertex(x,y);
        }
    endShape();

}


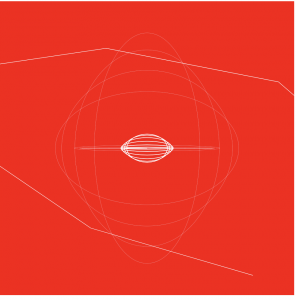
I first went to WolframMathworld website too look for shapes that I found interesting. I eventually decided to use the equations for hypotrochoid and nephroid since I thought the combination of roulette and plane curves would make a good contrast.  Although the curves in the final iteration didn’t turn out as I thought, I thought that the shapes were still interesting.

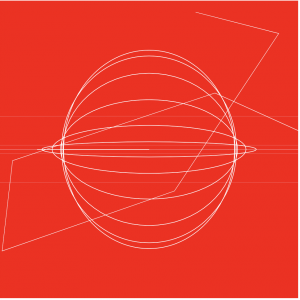
These are the process images before I adjusted the limits in the for loops and the parameters of vertex & shapes. If I could change anything from the final design, I would adjust the map()  more so that the movement would look more organized.

Mimi Jiao – Project 7 – Section E

click + drag/click to explore

/* 
Mimi Jiao
wjiao@andrew.cmu.edu
Section E
Project 7
*/

var mousepress; //boolean for switching states in mousePressed()
var r = 255; //initial color variable
var power = 33; //exponent for astroid functions
var scaleFactor = 1; //scaling elements variable
var increaseScale = .01; //variable for if statement in altering scale

function setup() {
    createCanvas(480, 480, WEBGL);
    background(0, 0, 255);
}

function draw() {
    background(0, 0, 0);
    strokeWeight(random(.4,.6)); //random strokeweight for jitter effect
    stroke(0, 0, 255);

    //drawing the rainbow background
    push();
    translate(0, 0, -100);
    drawBG();
    pop();

    //drag mouse to rotate astroids around X and Y axis
    if (mouseIsPressed) {
        rotateX(mouseX * .01);
        rotateY(mouseY * .013);
    }
    //rotate astroids 
    rotateZ(frameCount * .02);
    rotateX(frameCount * .001);
    rotateY(frameCount * .01);
    stroke(0, 0, 255);
    ellipsoid(25, 25, 25); //center ellipsoid
    stroke(0, 255, 0);
    scale(scaleFactor); //scaling the astroids

    //constantly scales up and scales down the astroids
    if (scaleFactor < 5 & scaleFactor >= 1) {
        scaleFactor += increaseScale;
    }else if (scaleFactor >= 5) {
        increaseScale = -increaseScale;
        scaleFactor += increaseScale;
    }else if (scaleFactor === .99) {
        increaseScale = -increaseScale;
        scaleFactor = 1;
    }

    //drawing the astroids & rotating them to form a spike
    drawAstroid();
    push();
    rotateZ(5);
    rotateX(3);
    rotateY(4);
    drawAstroid2();
    pop();
    push();
    rotateZ(3);
    rotateX(4);
    rotateY(5);
    drawAstroid2();
    pop();
    push();
    rotateZ(3);
    rotateX(4);
    rotateY(5);
    drawAstroid();
    pop();
    push();
    rotateZ(4);
    rotateX(3);
    rotateY(5);
    drawAstroid();
    pop();
    push();
    rotateZ(4);
    rotateX(3);
    rotateY(5);
    drawAstroid2();
    pop();
    
}

//first draw astroid function
function drawAstroid() {
    mappedMouseX = map(mouseX, 0, width, 0, 12);
    beginShape();
    noFill();
    for(var i = 0; i <  250 * TWO_PI; i ++) {
        stroke(0 , 255, 0);
        vertex(300 * (cos(i)**power), 
             300 * (sin(i)**power));
        //changes color of astroid based on mouseY
        if (mouseY >= height / 2) {
            stroke(r , 0, 0);
        }
       
    }
    endShape(); 
}

//second draw astroid function (different color)
function drawAstroid2() {
    mappedMouseX = map(mouseX, 0, width, 0, 12);
    beginShape();
    noFill();
    for(var i = 0; i < 250 * TWO_PI; i ++) {
        stroke(-r , 255, r);
        vertex(300 * (cos(i)**power), 
             300 * (sin(i)**power));
       
    }
    endShape();
}

//drawing the rainbow background 
function drawBG() {
    push();
    for (var i = 0; i < 1000; i++) {
        noFill();        
        stroke(i * sin(i) + 455, i * cos(i), sin(i) * width);
        beginShape();
        vertex(sin(i) * 900, cos(i) * 900,
               sin(i)* 900);
        vertex(sin(i) * 850, cos(i) * 850,
               cos(i) * 850);
        vertex(cos(i), sin(i), sin(i));
        endShape(CLOSE);
    }
    pop();

}

//if mouse is pressed, change color of specific astroids
function mousePressed() {
    if (mousepress === true) {
        r = random(20, 255);
    } else {
        r = 255;
    }
    mousepress = !mousepress;
}

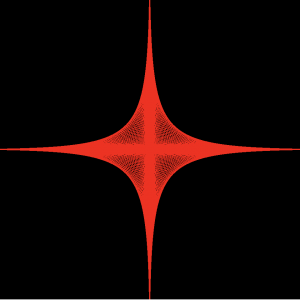
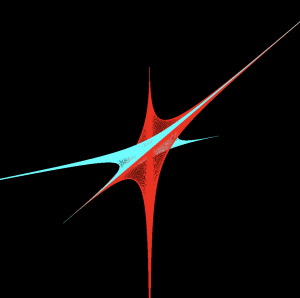
I wanted to continue along the same path as I did for my project last week by using WEBGL again. This time, I really wanted to create a more 3D object that didn’t only exist on one plane, so I tried to play around with rotating the X, Y, and Z axis for the astroids. For this project, I utilized the mousePressed function and mouseIsPressed to play around with interaction. Here are some of my previous explorations below.


Rachel Lee Project 07 Section E

sketch

/* Rachel Lee
Section E
rwlee@andrew.cmu.edu
Project 07: Curves */

function setup() {
    createCanvas(500, 500);
}

function draw() {
    background(150, 200, 170);
    strokeWeight(1);
    fill(255);
	drawHypothrochoid();
}

function drawHypothrochoid() {
	// radius of circle a changes with mouseX within bounds
	var a = constrain(mouseX, 0, width / 3.5); 
	// radius of circle b
	var b = 10; 
	// distance from center of interior circle changes with mouseY
	var h = map(mouseY, 0, height / 5, height / 2, height / 4); 

    // t considers all values in a circle (360 degrees)
    for (var t = 0; t < 360; t ++) { 
    	// hypotrochoid equations affecting x and y (parametric equations)
        var x = width / 2 + (a - b) * cos(radians(t)) + h * cos(((a - b) / b)) * (radians(t)); 
        var y = height / 2 + (a - b) * sin(radians(t)) - h * sin(((a - b) / b) * (radians(t))); 
        // drawing hypothrochoid inspired ellipse
        ellipse(x, y, 5, 5);
    }

    // color of elements change depending on mouseY position
    if (mouseY <= height / 2) {
        stroke(247, 138, 100);
    } else if (mouseY > height / 2) {
    	stroke(170, 160, 200);
    }
}

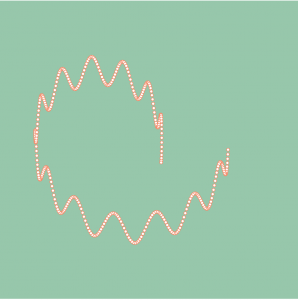
For this project, I was inspired by the curves of the Hypotrochoid. I really enjoyed the curves that were being created in by the two simultaneous circles operating at once, and decided to add interaction to alter the tightness of the coils and play around with three dimensionality in space. While this project was initially challenging, I found it really fun to see what kind of results the curve would program.

Example of tighter coiled curve
Example of looser coiled curve