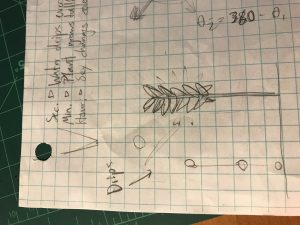
Kyle Leve-LO-Week-07

An interactive project that focuses on computational information visualization that I find interesting is a program by Kim Rees that illustrates the path of space tourism. This project can be found on NBC News and it explains what the future process of people exploring space will be. It shows the full cycle of space tourism from liftoff, to journeying through space, to the descent back to Earth. What I noticed about this project is how well it is done and how much detail was put into it. As you go through each step, the points are placed at points regarding the height at which they take place. This allows for the user to visualize the whole cycle of the journey and understand just how much of an experience space travel will be. The software is easy to use and it provides a fun and interactive experience that correlates its design to the actual process.

http://interactive.nbcnews.com/virgin-galactic/

Link to the interactive project.

This undated image provided by Virgin Galactic shows Virgin Galactic’s first SpaceShipTwo, an air-launched suborbital spaceplane type designed for space tourism. It is manufactured by The Spaceship Company, a California-based company owned by Virgin Galactic. Space tourism companies are employing designs including winged vehicles, vertical rockets with capsules and high-altitude balloons. While developers envision ultimately taking people to orbiting habitats, the moon or beyond, the immediate future involves short flights into or near the lowest reaches of space without going into orbit. (Virgin Galactic via AP)

https://www.dailymail.co.uk/sciencetech/article-3447431/Space-tourism-projects-glance.html


Project 6 Liz Maday

final liz maday 6

var r;
var g;
var b;
var array = [];
var array2 = [];
var array3 = [];

function setup() {
	createCanvas(415, 210);
}
 function draw() {
 	background('lightblue');
 	strokeWeight(1.5);
 	var s = second();
 	var m = minute();
 	var h = hour();

    //lines
    for (var i = 0; i < 7; i += 1) {
    	var space = 60;
    	var x = (i * space) + 20;
    	var y = 0;
    	line(x, y + 50, x, (y + 65));
    	array = ['0s', '10s', '20s', '30s', '40s', '50s', '60s'];
    	array2 = ['0m', '10m', '20m', '30m', '40m', '50m', '60m'];
        textSize(15);
        fill('red');
        text(array[i], x - 10, y + 20);
        fill('green');
        text(array2[i], x - 10, y + 40);
    }
    
    //second boxes
    for (var i = 0; i < s; i += 1) {
    	var x = (i * (space/10)) + 15;
    	var y = 80;

    	fill('red');
    	rect(x, y, 5, 5);

    }

    //minute boxes
    for (var i = 0; i < m; i += 1) {
    	var x = (i * (space/10)) + 15;
    	var y = 90;
    	fill('green');
    	rect(x, y, 5, 15);
    }

    //hour boxes
    for (var i = 0; i < h; i += 1) {
    	var x = (i * 10) + 15;
    	var y = 110;
    	fill('yellow');
    	rect(x, y, 10, 25);

    }

    //hour lines
    for (var i = 0; i < 5; i += 1) {
    	var space = 40;
    	var x = (i * space * 1.5) + 20;
    	var y = 150;
    	line(x, y, x, (y + 15));
    	textSize(15);
    	array3 = ['0hrs', '6hrs', '12hrs', '18hrs', '24hrs'];
    	text(array3[i], x - 10, y + 40);
    	
    }    

 }

I liked how this project made me think about how time can be efficiently displayed in a more simplistic way than a typical clock. My concept for this project had to adjust a few times, as I was still figuring out how to manipulate the time functions.

Yiran Xuan – Project 06 – Abstract Clock

I started with the idea of a water dripping, at first wanting to just have a series of pitchers pouring into each other. However, this seemed rather uninteresting, and also the mechanics of the water pouring seemed to complicated. I thought it would be better to display each time unit differently, so I went with a plant growing in front of a changing sky.

sketch


var currentsec = second();
var dropdistance = 200;

var totalminutes = hour()*60 + minute();
var sunlight;

var waterlevel = 0;

function setup() {
    createCanvas(300, 300);
    angleMode(DEGREES);
    
}

function draw(){
	totalminutes = hour()*60 + minute();
	sunlight = round(abs(totalminutes/3 - 240)); //ensures that sunlight value is greatest when totalminutes is half of the midnight value

	background(120 - sunlight/2, 240 - sunlight, 240 - sunlight) //background changes gradually each minute; is darkest in the evening and early morning, lightest during the day
	
	
	if(currentsec != second()){ //if start of a new second, create droplet at top of canvas
		dropdistance = 0;
	}
	else {
		dropdistance += 5; //allow droplet to fall
	}

	currentsec = second();

	waterlevel = second();

	noStroke()
	fill(0, 255, 255);
	ellipse(100, dropdistance, 6, 6); //draw droplet
	rect(0, 300 - (waterlevel/2), 300, waterlevel/2); //draw water at the bottom


	stroke('green');
	strokeWeight(7);
	var plantheight = 270 - minute()*4;
	line(120, 300 - (waterlevel/2), 120, plantheight); //draw plant stalk

	noStroke();
	fill('green'); //draw plant leaves
	triangle(120, plantheight, 120 - 15, plantheight - 20, 120 - 40, plantheight - 10);
	triangle(120, plantheight, 120 + 15, plantheight - 20, 120 + 40, plantheight - 10);


}

Project 6 rrandell

sketch

/* Rani Randell
rrandell@andrew.cmu.edu
Section A
Project 6 */


function setup() {
    createCanvas(310, 300);
    background(255, 0, 0); //keep background here so the dragging effect happens
}

function draw() {
	
	var h = hour();
	var m = minute();
	var s = second();

	fill(255, 0, 0);
	ellipse(h * 5, 75, 30, 30); //hour
	ellipse(m * 5, 150, 30, 30); //minute
	ellipse(s * 5, 225, 30, 30); //second

}

This sculpture by famous minimalist artist Donald Judd, is the inspiration for my clock. Although it is very simple, sometimes the best and most complex art is often extremely simple because it is so thought provoking.

Looking Outwards 6


http://nifty.stanford.edu/2009/stone-random-art/

This is a link to the artists page, and below is a piece that he randomly formulated.

This project was executed by a student at Harvey Mudd College named Christopher Stone. He generated a program that makes randomly generated arithmetic expressions that are translated into intricate pieces. The artist uses the traversal of an abstract syntax tree as an algorithm to generate the intricate works, as well as functions like reverse and append in various programming languages to get the desired looks, but all of the arithmetic inside the functions are totally randomized. By using sin and cos functions along with pi, the results are beautifully colorful abstract works. The resulting images are representative of ‘glitch’ artwork and are simple and complex at the same time.

Yingyang Zhou-LookingOutwards-6

This is a collection of work of a course happened during 2015 spring in RISD led by Carl Lostritto who is a Graduate Program Director and Assistant Professor of Architecture at RISD.

Aaron Tobey

Rami Hammour: A text of random meaning!

Matthew Solomon


These work are inspired by the most reliable source of randomness universally available on the computer, random.org, which samples natural phenomena and digitally records and processes it to achieve “true” randomness, many students are inclined to operate physically, and experiment with material media to generate random values. Students find themselves facing the same quandary raised by Bishop Derry. Something like a splatter of paint may be unpredictable at first, but as the mechanism for splattering paint becomes more controlled–and less contingent, it becomes clear that randomness can be rarely achieved by physical means–at least on the scale of paint. But it can certainly be done. Lavarand is one example in which the behavior of Lava Lites helps to generate random numbers. Another related example entails creating a manually-operated random machine with geometry. In a course I once taught, Matthew Solomon created a random number generator with a triangle as a seed. A line bounces within the triangle based on a set of rules. Numbers are generated based on where the line intersects the edge of the triangle. Aaron Tobey wrote a script to execute a similar though slightly more complex series of geometric operations and logical rules to build a random sequence.

The work suggests that computing may serve as a medium for art rather than a tool to make art. Because randomness so inhuman, to wield might mean to undermine our humanity, but it also might function as a foil in our efforts to better understand the nature of our own creative instincts.


Project 06 – Min Lee

sketch

var prevSec;
var millisRolloverTime;

function setup() {
    createCanvas(480, 480);
    millisRolloverTime = 0;
}

function draw() {
	//changes background color to be different from minute color 
	if  (H % 2 == 1) {
		background(221, 84, 105)
	} else {
		background(141, 173, 157)
	}

	var H = hour();
	var M = minute();
	var S = second();

    text("Hour: "   + H, 10, 22);
    text("Minute: " + M, 10, 42);
    text("Second: " + S, 10, 62);

    if (prevSec != S) {
		millisRolloverTime = millis();
	}
	prevSec = S;
	var mils = floor(millis() - millisRolloverTime);

	//makes minute and second values move smoothly
    var fractionSeconds = S + (mils / 1000.0);
    var secondsWidth = map(fractionSeconds, 0, 60, -300, 300);
    var minutesSmooth = map(M + (fractionSeconds / 60.0), 0, 60, -HALF_PI, PI + HALF_PI);
    var fractionHours = H + (minutesSmooth / 60.0)
    var hoursSmoothWidth = map(fractionHours, 0, 24, -240, 240);


    //minute color changes between green and pink
    if (H % 2 == 1) { 
    	//pink minute hand
	    push();
	    strokeWeight(2);
	    fill(221, 84, 105);
	    arc(width / 2, height / 2, width * 2, width * 2, - HALF_PI, minutesSmooth);
    	pop();
    } else if (H % 2 == 0) {
    	//green minute hand
 	    push();
	    strokeWeight(2);
	    fill(141, 173, 157);
	    arc(width / 2, height / 2, width * 2, width * 2, - HALF_PI, minutesSmooth);
    	pop();   	
    }

    //seconds circle closes and opens every 60 seconds
    push();
    stroke(58, 90, 120);
    strokeWeight(3);
    line(width / 2, height, width / 2, 0);
    pop();
    push();
    fill(141, 173, 157);
    strokeWeight(3);
    stroke(58, 90, 120);
    if (H % 2 == 1) {
    	fill(141, 173, 157);
    	ellipse(width / 2, height / 2, secondsWidth, 300);
    } else {
    	fill(221, 84, 105);
    	ellipse(width / 2, height / 2, secondsWidth, 300);
    }
    pop();

    //hours circle moves across 
    push();
    noStroke();
    fill(58, 90, 120);
    translate(width / 2, height / 2);
    ellipse(hoursSmoothWidth, 0, 50, 50);
    pop();
}

For this project I wanted to insert some 3D aspect, which is why I added a rotating circle for the seconds hand. I wanted to make the hour circle move across the screen from side to side but I ran out of time.

Initial Sketch

Yingyang Zhou-Project-06-Abstract Clock

Abstract Clock


function setup() {
	createCanvas(400, 400);
	fill(0);
}

function draw() {

	var H = hour();
	var M = minute();
	var S = second();
	var D = day();
	var MO = month();
	if (H>6 & H<18){
		background(243,234,225);
	}
	else{
		background(38, 53, 38);
	}

	for(var i = 10; i <= D*10; i += 10){
		stroke(227, 168, 34);
		line(0, height-i, i, height);
	}

	for(var a = 10; a <= MO*30; a += 30){
		stroke(119, 166, 119);
		line(width, height-a, width-a, height);
	}

	var marginX = 50;
	var marginY = 20;
	var rectH = 50;
	var rectW = 300;
	var space = (width-2*marginY-3*50)/2;
	var mappedH = map(H, 0, 23, 0, 300);
	var mappedM = map(M, 0, 59, 0, 300);
	var mappedS = map(S, 0, 59, 0, 300);

	if(H>6 & H<18){
		fill(243,234,225);
	}
	else{
		fill(38, 53, 38);
	}
	stroke(227,168,82);
	strokeWeight(2);
	rectMode(CORNER);
	rect(marginX, marginY, rectW, rectH, 20);
	stroke(156,111,79);
	rect(marginX, marginY+rectH+space, rectW, rectH, 20);
	stroke(230, 92, 27);
	rect(marginX, marginY+2*rectH+2*space, rectW, rectH, 20);

  noStroke();
	rectMode(CENTER);
	fill(200);
	rect(marginX+mappedH, marginY+rectH/2, 30, 30, 10);
	rect(marginX+mappedM, marginY+3/2*rectH+space, 30, 30, 10);
	rect(marginX+mappedS, marginY+5/2*rectH+2*space, 30, 30, 10);

	print(H);

}

The clock is display time(hour, minute, second) as major information and date(day and month) as background. The background color of day and night is different while it shows a bright color during the day and darker color at night for legibility.

Katherine Hua – Project-06 – Abstract Clock

sketch

/* Katherine Hua
Section A
khua@andrew.cmu.edu
Project-06-Abstract-Clock */

var prevSec;
var millisRolloverTime;

function setup() {
    createCanvas(480, 480);
}

function draw() {
	background(0); //setting background to black

	var h = hour();
	var m = minute();
	var s = second();
	var ms = millis();

	if (prevSec != s) {
		millisRolloverTime = millis();
	}
	prevSec = s;
	var mils = floor(millis() - millisRolloverTime);

	//creating lines marking the center of the circle
	stroke(75);
	strokeWeight(1);
	line(240, 120, 240, 360);
	line(120, 240, 360, 240);

	//text
	fill(255); 
	textAlign(CENTER); //centering text
	text(nf(h, 2, 0) + ' : ' + nf(m, 2, 0) + ' : ' + nf(s, 2, 0), 240, 400); //using nf function to make numbers have two digits at all times

	//creating the grey outlines of circles based on their width
	for (var x = 0; x < 15; x++) { 
		noFill();
		stroke(50);
		strokeWeight(1);
		ellipse(240, 240, x * 16, 240)
	}

	//creating the grey outline of circles based on their height
	for (var y = 0; y < 15; y++) {
		noFill();
		stroke(50);
		strokeWeight(1);
		ellipse(240, 240, 240, y * 16);
	}

//milliseconds - orange circle: height of circle changes with millisecond; hits full circle every second
	var msHeight = map(mils, 0, 1000, -240, 240); 
	push();
	stroke(238, 99, 43, 255);
	strokeWeight(2);
	noFill();
	ellipse(240, 240, 240, msHeight);
	pop();

//seconds - yellow circle: width of circle changes with second; hits full circle every minute
	var sFrac = s + (mils / 1000.0);
	var sWidth = map(sFrac, 0, 60, -240, 240);
	push();
	stroke(243, 205, 70, 255);
	strokeWeight(2);
	noFill();
	ellipse(240, 240, sWidth, 240);
	pop();

//minutes - pink circle: width of circle changes with minute; hits full circle every hour
	var mFrac = m + (s / 60.0);
	var mWidth = map(mFrac, 0, 60, -240, 240);
	push();
	stroke(224, 83, 152, 255);
	strokeWeight(4);
	noFill();
	ellipse(240, 240, mWidth, 240);
	pop();

//hours - purple circle: height of circle changes with every hour; hits full circle every 24 hours
	var hFrac = h + (m / 60.0);
	var hHeight = map(hFrac, 0, 24, -240, 240);
	push();
	stroke(112, 45, 156, 255);
	strokeWeight(5);
	noFill();
	ellipse(240, 240, 240, hHeight);
	pop();


}

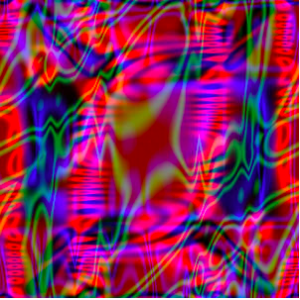
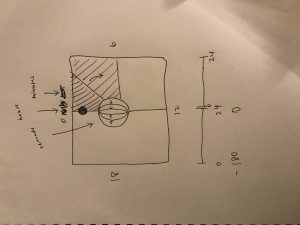
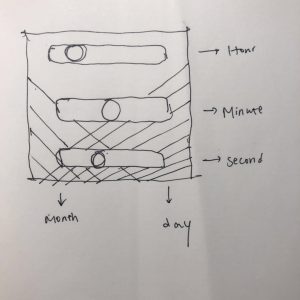
I wanted to create a clock that gives a more spacey-vibe to reflect time’s relationship with the movement of solar systems. I did this by creating the circular grid which can appear like longitude and latitude lines. Each moving element corresponds to its respective time (hour, minute, second, or millisecond). I was inspired by Min Lee’s design with how he used a circle of changing width so my design is based off of what I learned from him. I had a difficult time at first getting the movement of the circle right; it was not moving smoothly or would not complete a full turn. This project helped me familiarize myself more with how time can be utilized in coding.

Jonathan Liang – Project 6 – Abstract Clock

sketch

//Jonathan Liang
//jliang2
//section A


var ballX = 200;
var ballY = 0;
var speedX = 5;
var count = 0;
var xS = [];
var yS = 0;
var xM = [];
var yM = 0;
var xH = [];
var yH = 0;
var ySpeedS = 10;
var ySpeedM = 5;
var ySpeedH = 3;
var radius = 20;

var action = false;
var dayColor = 255;


function setup() {
    createCanvas(400, 400);
    
 //seconds 
    for (var i = 1; i < 60; i++) {
    	xS[i] = random(20, width - 20);
    	
    }
 //minutes   
    for (var i = 1; i < 60; i++) {
    	xM[i] = random(20, width - 20);
    }
 //hours
 	for (var i = 1; i < 12; i++) {
 		xH[i] = random(20, width - 20);
 	}
}

function draw() {

	frameRate(3);	

//fetching current time
	var H = hour();
    var M = minute();
    var S = second();
    dayColor = map(H, 0, 24, 255, 0);
    H = H % 12;

//background color
	background(dayColor);


//hours
	for (var i = 0; i <= H; i++) {
		noStroke();
		fill(128, 212, 255);
		ellipse(xH[i], yH, radius);
		xH[i] += speedX;
		yH += ySpeedH;
		if (yH > height-20 || yH < 0) {
			ySpeedH = -ySpeedH;
			radius += 10;
		}
		if (xH[i] > height-20 || xH[i] < 0) {
			speedX = -speedX;
			radius += 10;
		}


	}

//minutes
	for (var i = 0; i <= M; i++) {
		noStroke();
		fill('yellow');
		ellipse(xM[i], yM, 15, 15);
		xM[i] += speedX;
		yM += ySpeedM;
		if (yM > height-20 || yM < 0) {
			ySpeedM = -ySpeedM;
		}
		if (xM[i] > height-20 || xM[i] < 0) {
			speedX = -speedX;
		}
		
	}

//seconds
	for (var i = 0; i <= S; i++) {
		noStroke();
		fill('orange');
		ellipse(xS[i], yS, 10, 10);
		xM[i] += speedX;
		yS += ySpeedS;
		if (yS > height-20 || yS < 0) {
			ySpeedS = -ySpeedS;
		}
		if (xS[i] > height-20 || xS[i] < 0) {
			speedX = -speedX;
		}
		
	}


}

Uh for this project, I start with, with a concept, of the world. The world is so hectic and fast moving that we have trouble keeping track of time. The minutes and seconds represent the stars in the sky and the gradually expanding blue circles (hours) represent the tide of the ocean. The minutes and the seconds move so fast, which is symbolic of how life moves so quickly, that we don’t have time to look at the stars in the sky. This whole paragraph sounds incredibly corny and I’m so sorry that it does.