//Jina Lee
//jinal2@andrew.cmu.edu
//Section E
//Project 07

var numLines = 30;
var angle = 0;
var angleX;
var circleW;
var r;
var g;
var b;

function setup() {
    createCanvas(480, 480);
}

function draw() {
    background(0);
    //r is a random number between 0 - 255
    r = random(255);
    //g is a random number betwen 0 - 255
    g = random(255);
    //b is a random number between 0 - 255
    b = random(255);
    for(var i = 0; i < numLines; i++){
        noFill();
        push();
        //changing the speed of ellipse
        angleX = map(mouseX, 0, 400, 0, 90);
        //changing the amount of lines drawn
        numLines = map(mouseY, 0, 400, 5, 50);
         //changing the ellipse width
        circleW = map(mouseY, 0, 400, 200, 50);
        //color is random
        stroke(r, g, b);
        strokeWeight(5);
        //move it so it is random
        translate(width / 2, height / 2);
        rotate(radians(angle));
        ellipseMode(CENTER);
        ellipse(0, 0, circleW, 470);
        pop();
        angle += angleX;

    }
}
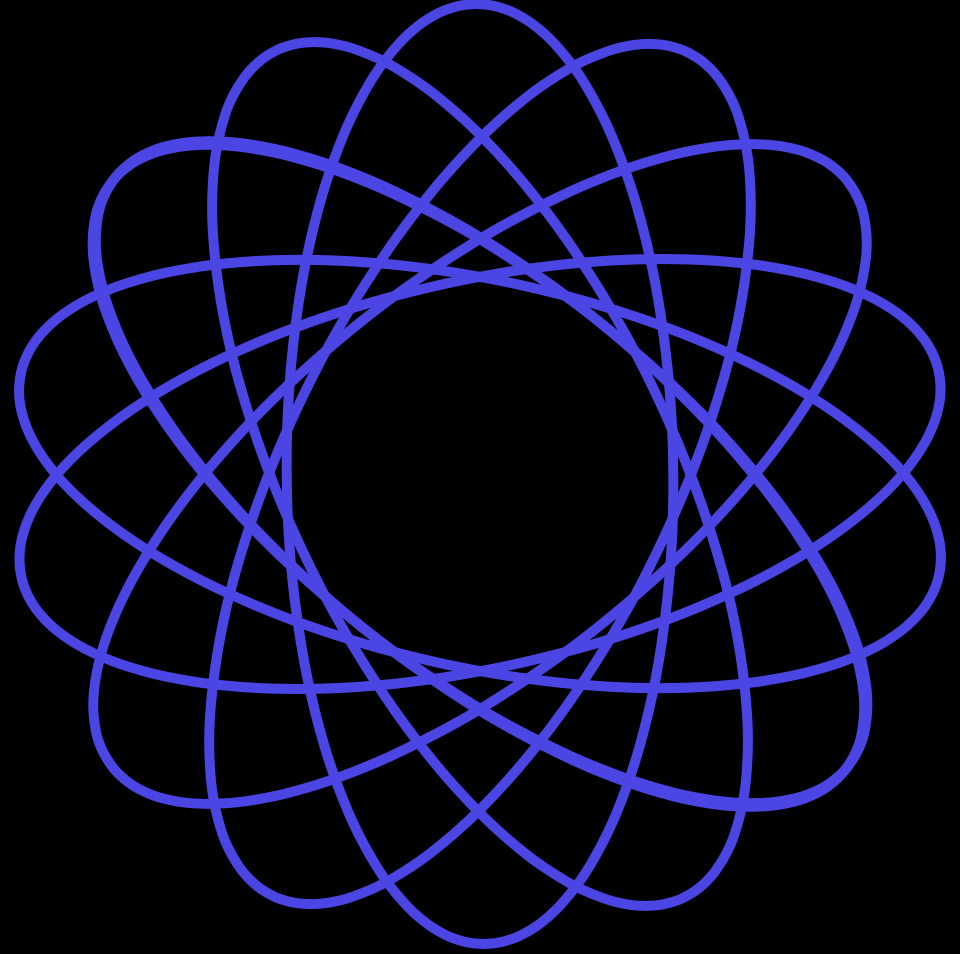
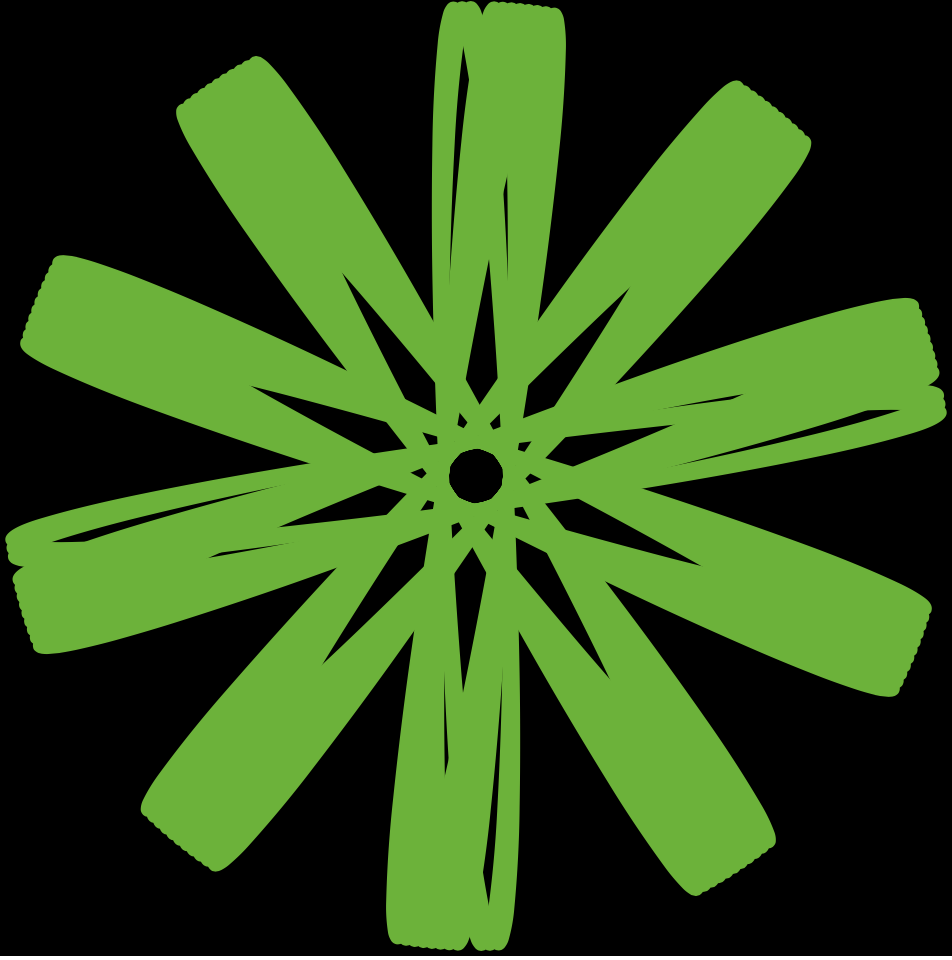
For this project, I was really worried on how to start because the shapes seemed so difficult and complex. As I was working, I realized that it was not as bad as I thought. as long as I defined my variables properly and used a for loop to draw the pattern, it worked. I used the map function to control the to control the speed, number of lines, and width of ellipse.
When the mouse is at the top left corner. When the mouse is at the center. When the mouse is at the bottom corner. When the mouse is at the right side of the canvas. When the mouse is at the bottom right corner. When the mouse is at the bottom left corner. When the mouse is at the top right corner.
Meejin Yoon is an architect, designer, and educator, whose projects and research investigate the intersections between architecture, technology, and the public realm. Prior to joining the faculty at AAP, Yoon was at MIT for 17 years and served as the head of the Department of Architecture from 2014–18.
I admire her work that includes interactive public space projects bridging issues of technology and play in the public sphere. Her works have great variety and social values. Spanning work over the past decade, topics covered will include responsive technologies, smart materials, renewable energy, media based public art, public engagement and the public process. I admire the interactive technologies she uses in the interactive architectures.
She uses relevant data and images effectively to help audience understand. I will incorporate this strategy and present images during my working processes.
In her speech, she backed her data with the studio established in 2001, which she pursues creative works at the intersection of architecture, art and technology. The firm is an international interdisciplinary design practice working across the domains of architecture, urban design, public space, immersive experience, and design strategy.
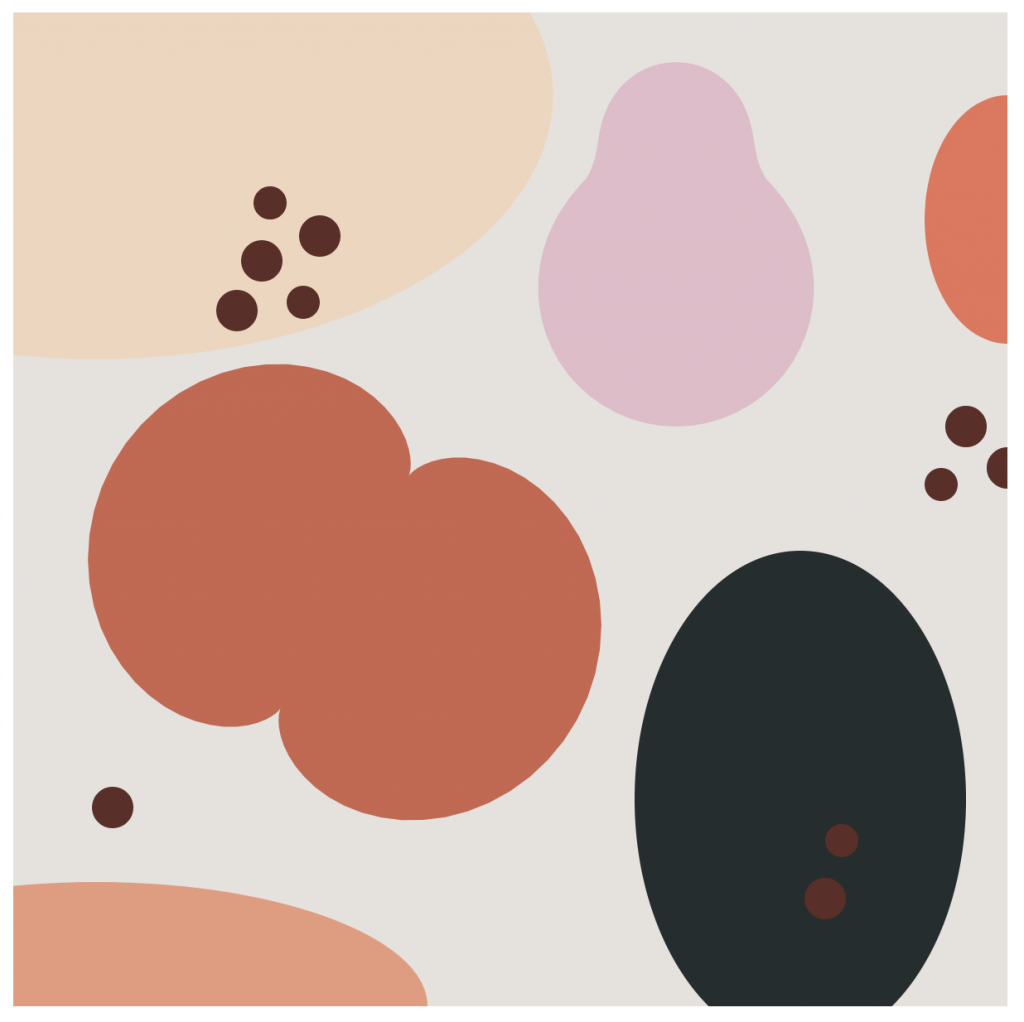
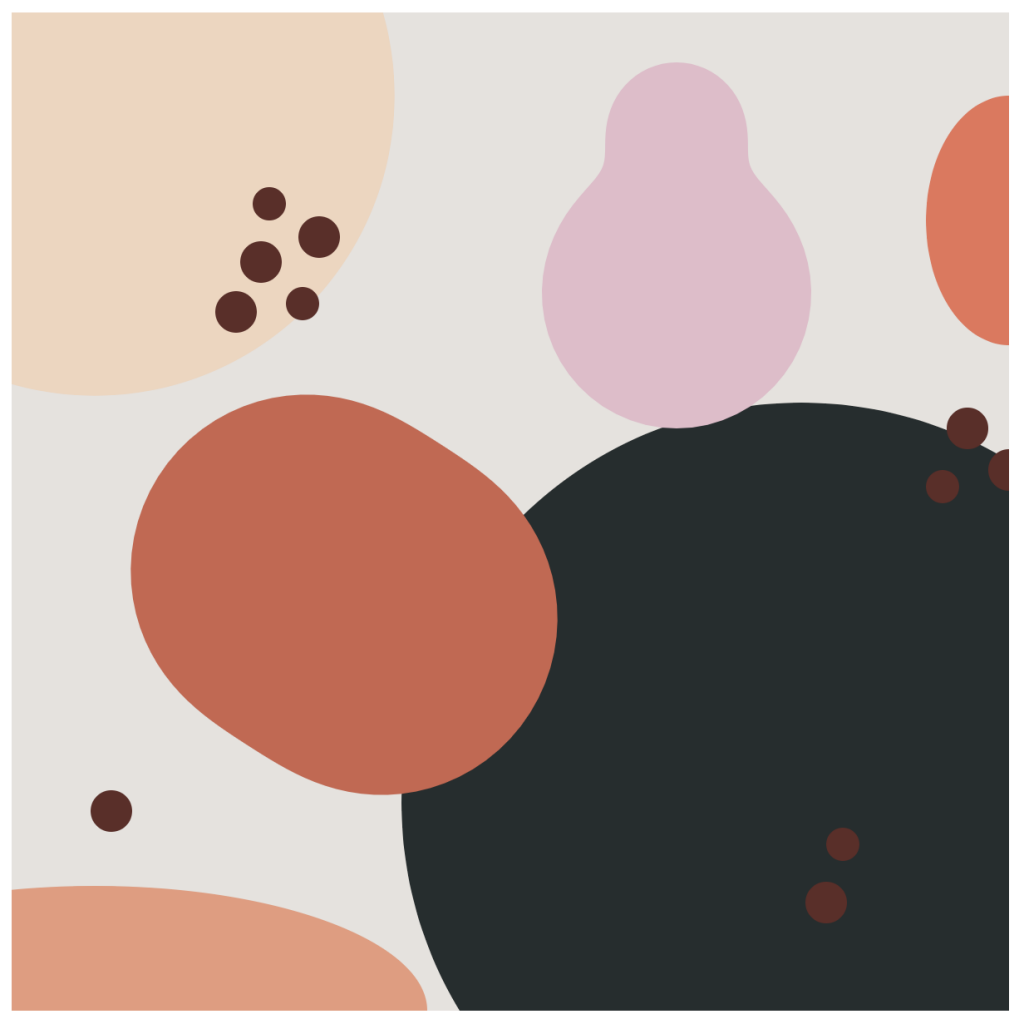
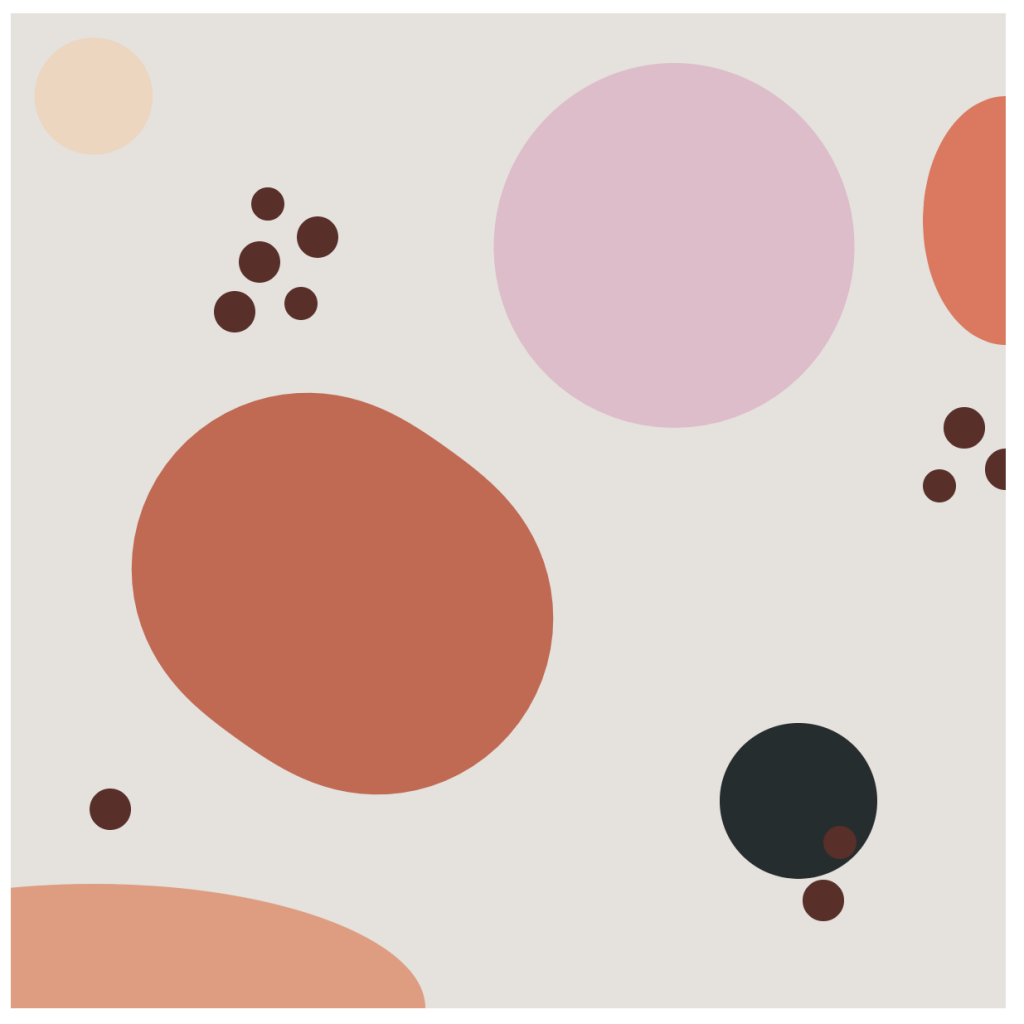
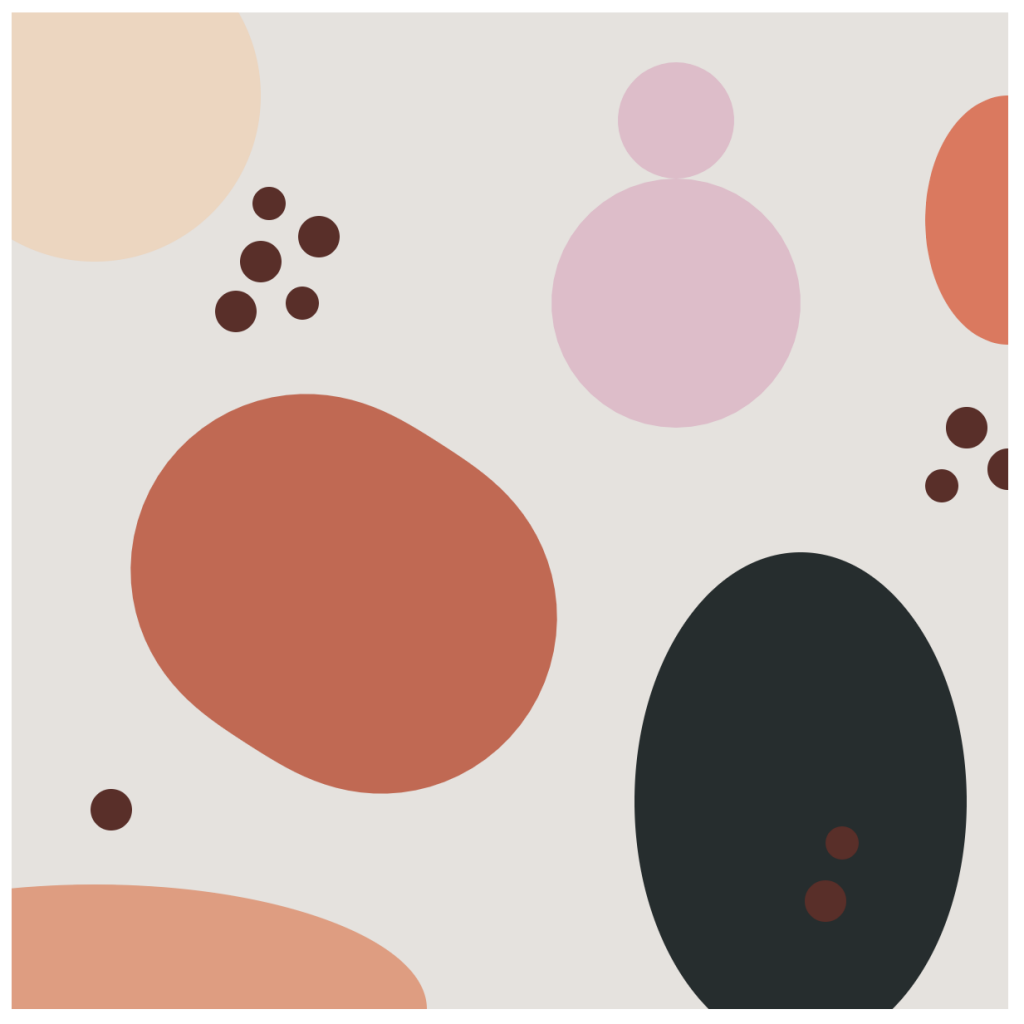
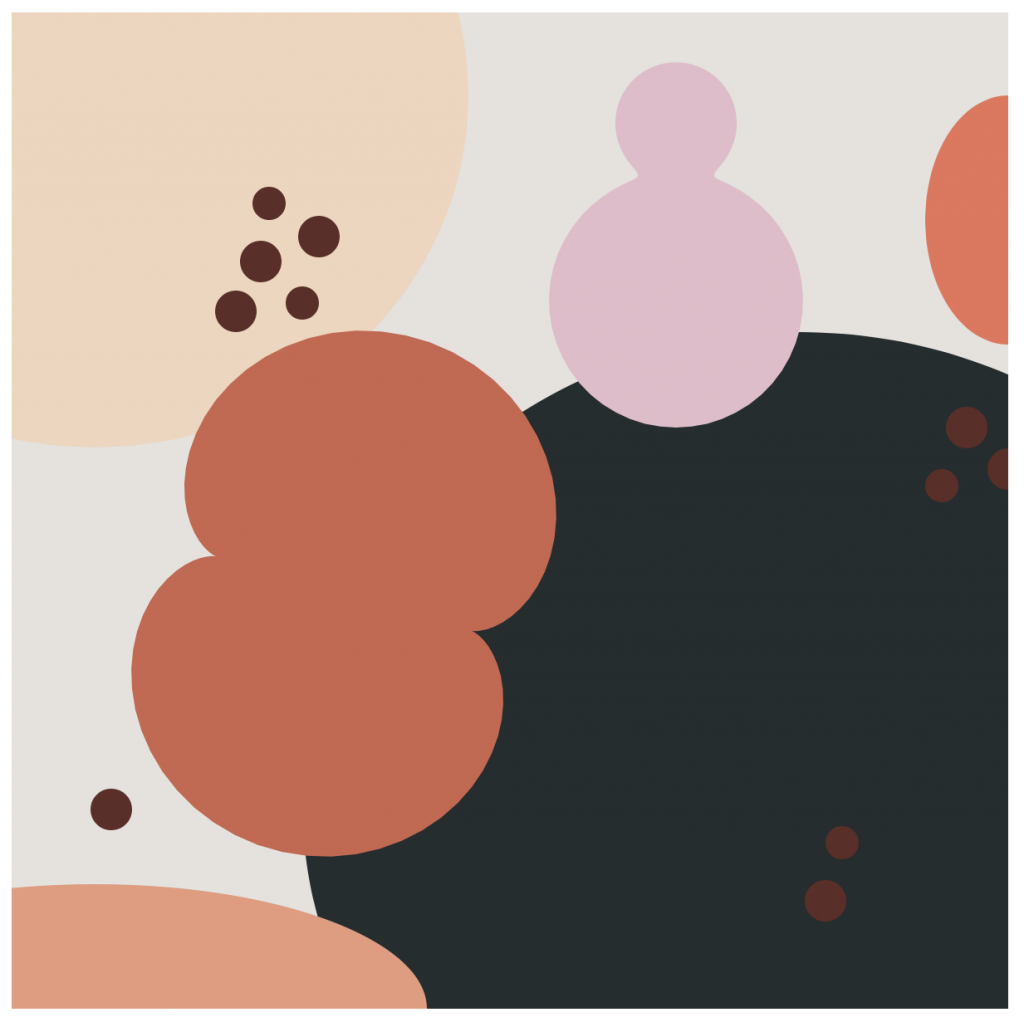
This project I was inspired by some of the shapes shown as examples on the project description. I thought the round shapes were really cute and I could imagine them as a pattern. I made it so that each shape you could manipulate individually by clicking on them. This way there could be more options for what you could create based on the mouse.
/* Youie Cho
   Section E
   minyounc@andrew.cmu.edu
   Project-07-Composition-with-Curves*/

var nPoints = 500;

function setup() {
    createCanvas(480, 480);
}

function draw() {
    //background color changes based on mouse location
    background(mouseX / 2, 50, mouseY / 2);
    Epitrochoid();
}

function Epitrochoid() {
    stroke(255);
    strokeWeight(0.5);
    //fill color changes based on mouse location
    fill(mouseX, mouseX / 2, mouseY);
    push();
    //begin at the center of the canvas
    translate(width / 2, height / 2);
    //constrain through mouseX and mouseY
    var consx = constrain(mouseX, 0, mouseX, 0, width);
    var consy = constrain(mouseY, 0, mouseY, 0, height);
    //define constants that depend on mouse position
    var a = map(consx, 0, width, 0, width / 3);
    var b = map(consy, 0, width, 0, width / 5);
    var h = map(consy, 0, height, 0, 400);
    //draw primary epitrochoid curve
    beginShape();
    for (var i = 0; i < nPoints; i ++) {
        var t = map(i, 0, nPoints, 0, TWO_PI);
        var x = (a + b) * cos(t) - h * cos((a + b) / b * t);
        var y = (a + b) * sin(t) - h * sin((a + b) / b * t);
        vertex(x, y);
        //draw secondary epitrochoid curve rendered with small rectangles
        rect(x * 1.5, y * 1.5, 15, 15);
        //draw terciary epitrochoid curve rendered with large rectangles
        rect(x * 3, y * 3, 30, 30);
    }
    endShape(CLOSE);
    pop();
}
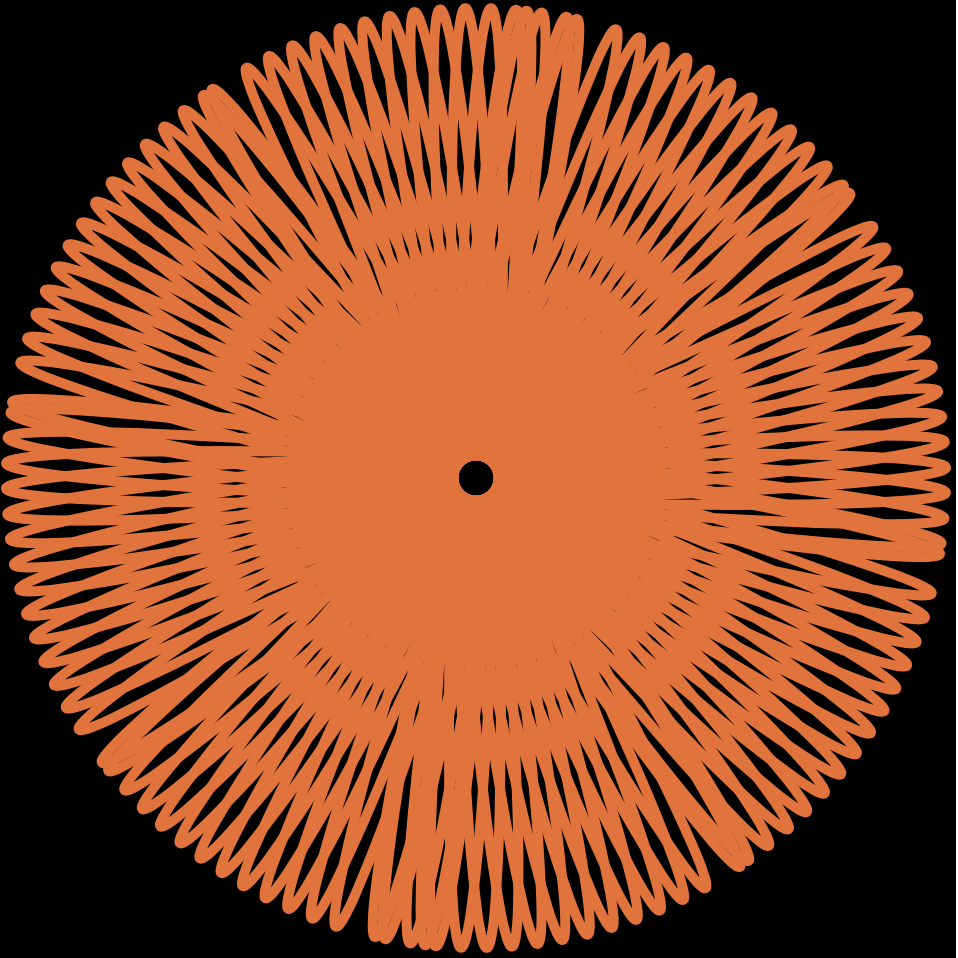
I chose to use the Epitrochoid curve. I chose this curve because first, I wanted to play around with many constants, and second, I thought that the curly movement is interesting. Because of the way the curve draws in a curly and dynamic way, I though it would be more harmonious to use differently rendered curves derived from the primary curve, instead of adding new Epitrochoid curves that would overlap with the primary curve. It was difficult to understand the different values in the equation, and which valuables controlled the curve in what ways, but after studying it for a while, I could make it so that the details that I wanted were being displayed on the canvas at an appropriate scale. It was very fun to be able to create something very complex and dynamic with the help of a mathematical equation.
//Sarah Choi
//Section D
//sychoi@andrew.cmu.edu
//Project-07

var col;

function setup() {
    createCanvas(400, 400);
}

function draw() {
    background(0);

    //randomize color
    col = color(random(255), random(255), random(255));

    x = constrain(mouseX, 0, width);
    y = constrain(mouseY, 0, height);

    // draw the frame
    fill(255);
    noStroke();
    text("The Butterfly", 20, 40);
    stroke(255);
    noFill();
    rect(0, 0, width-1, height-1);

    // draw the curve, rotate on mouseX
    push();
    translate(width / 2, height / 2);
    rotate(map(mouseX, 0, width, 0, 1));
    drawButterfly();
    pop();
}

//--------------------------------------------------
function drawButterfly() {
    // Butterfly Curve:
    // http://mathworld.wolfram.com/ButterflyCurve.html

    //adding variability and movement
    var m = (map(x, 0, mouseY, 0, width));
    var m = (map(y, 0, mouseX, 0, height));

    stroke(255);
    fill(col);

    beginShape();
    for (var i = 0; i < 300; i++) {
        var t = map(i, 0, 300, 0, 2 * TWO_PI);

    //butterfly curve equations
        r = (exp(cos(t))) - (2 * cos(4 * t)) + (sin((1 / 12) * t));

        x = r * sin(t) * m
        y = r * cos(t) * m
        vertex(x, y)
    }
    endShape(CLOSE);
}
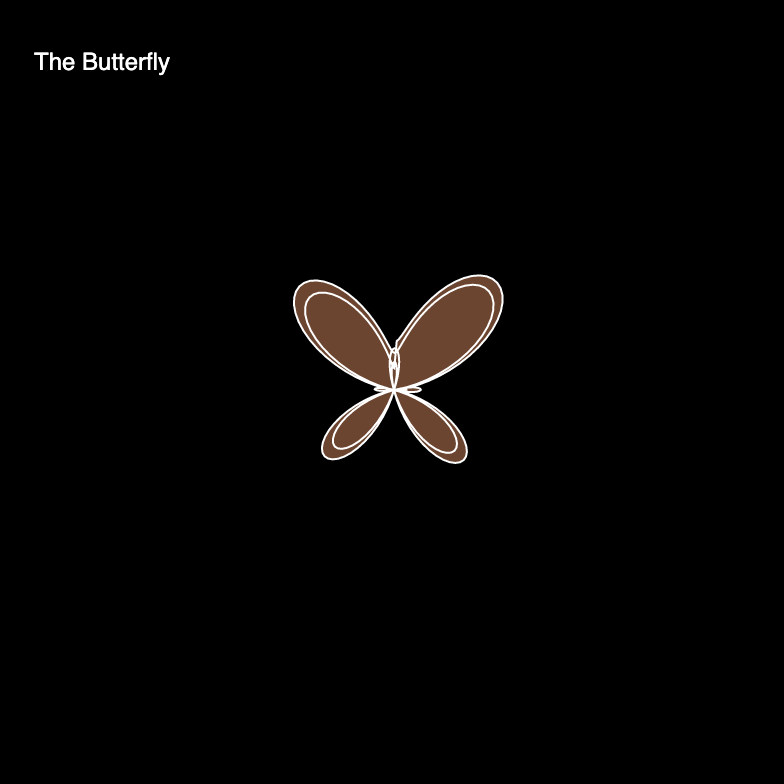
I chose a curve that could turn on an angle. Thinking of fully randomizing and creating something abstract on the basis of mathematics was my main goal for this project. Because we have been focusing and reflecting on computational art, I wanted to be able to portray this with my own work. It was interesting to play around with the variables as they made a big difference in how the curve was portrayed.
Below, I have shown three different aspects of the curve showing the beginning and how it manifests as it follows the x and y coordinates of the mouse. I wanted to show portray nature by showing the beginning of a butterfly as pure blackness. As one moves the mouse, the shapes get bigger with colors constantly changing showing the beauty butterflies bring into our world. As the mouse moves more across the screen, the butterfly gets bigger to depict what the human eye takes in as a butterfly flies closer to him or her.
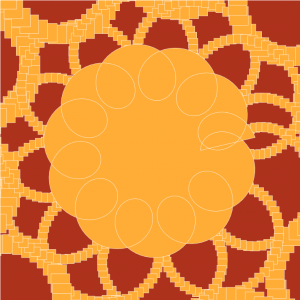
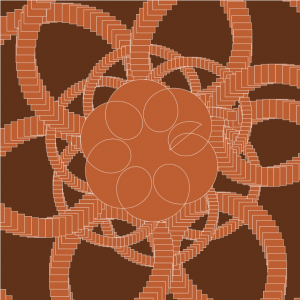
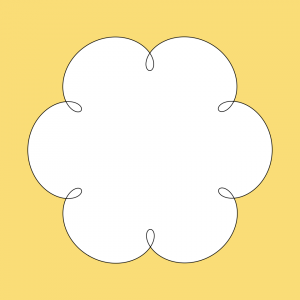
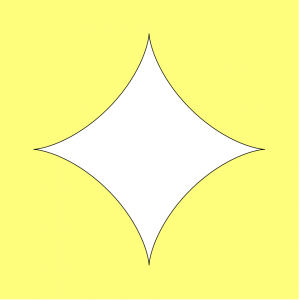
I think this was the hardest project to do so far. I didn’t really understand the assignment so I just started by looking at the curves on MathWorld and I was really interested in the Hypotrochoid and the Hypocycloid Pedal Curves. I decided to use those for this project and layer them to create a flower like effect. I think the hardest part of this project was trying to figure out the formulas and how to manipulate the variables but once I got it, it was fun to play around with the shapes and colors. I used mouseX and mouseY to manipulate the variables and the colors to create pretty flowers.
top left
bottom right
top right
/*
Min Ji Kim Kim
Section A
mkimkim@andrew.cmu.edu
Project-07
*/

function setup() {
    createCanvas(480, 480);
}

function draw () {
    background(0);
    drawHypotrochoid(); //draw the Hypotrochoid
    drawHypocycloidPC(); //draw the Hypocycloid Pedal Curve
}

function drawHypotrochoid() { //http://mathworld.wolfram.com/Hypotrochoid.html
    var a = int(map(mouseX, 0, width, 100, 200)); //radius of Hypotrochoid
    var b = int(map(mouseY, 0, height, 50, 80)); //radius of circle b
    var h = int(map(mouseX, 0, width, 40, 50)); //distance between center and point P of circle with radius b
    //draw Hypotrochoid
    push();
    translate(width / 2, height / 2); //move center to middle of canvas
    fill(150, mouseX, mouseY); //color changes depending on mouseX and mouseY
    beginShape();
    for(var i = 0; i < 100; i++) {
        var tH = map(i, 0, 100, 0, TWO_PI); //map theta angle
        var x = (a - b) * cos(tH) + h * cos((a - b) * tH); //parametric equations
        var y = (a - b) * sin(tH) - h * sin((a - b) * tH);
        vertex(x, y);
    }
    endShape();
    pop();
}

function drawHypocycloidPC() { // http://mathworld.wolfram.com/HypocycloidPedalCurve.html
    var a = int(map(mouseY, 0, height, 30, 80)); //map the radius with mouseX movement
    var n = int(map(mouseX, 0, width, 5, 20)); //map the number of cusps with mouseX movement
    //draw Hypocycloid Pedal Curve
    push();
    translate(width / 2, height / 2); //move center to middle of canvas
    fill(mouseY, 100 , 120); //color changes depending on mouseY
    beginShape();
    for(var i = 0; i < 500; i++) {
        var t = map(i, 0, 500, 0, TWO_PI); //map theta angle
        var x = a * ((n - 1) * cos(t) + cos((n - 1) * t)) / n; //pedal curve equations
        var y = a * ((n - 1) * sin(t) + sin((n - 1) * t)) / n;
        vertex(x, y);
    }
    endShape();
    pop();
}
/*
Hyejo Seo
Section A
hyejos@andrew.cmu.edu
Project 7 - Curves
*/
var nPoints = 200;
var angle = 0;

function setup() {
    createCanvas(480,480);
    frameRate(20);
}

function draw() {
    background(56, 63, 81);
// placing Hypocycloid to be centered in the cavas
    push();
    translate(width/2, height/2);
    drawHypocycloid();
    pop();
// Making two ranunculoids rotate depending on mouseX position
    push();
    translate(width/2, height/2);
    rotate(radians(angle));
    angle += mouseX;
    drawRanunculoid();
    drawRanunculoid2();
    pop();
}

function drawHypocycloid(){
    var xh;
    var yh;
    var ah = map(mouseY, 0, 480, 150, 200);
    var bh = 15;
    var hh = mouseX / 25;

    stroke(255, 200, 200);
    strokeWeight(5);
    noFill();
    beginShape();
// drawing hypocycloid
    for (var i = 0; i < nPoints; i++) {
        var tH = map(i, 0, nPoints, 0, TWO_PI);
        xh = (ah - bh) * cos(tH) + hh * cos((ah - bh) / bh * tH);
        yh = (ah - bh) * sin (tH) - hh * sin((ah - bh) / bh * tH);
        vertex(xh, yh);
    }
    endShape(CLOSE);
}

function drawRanunculoid(){
    var ar = 20;
    stroke(255, 159, 28);
    strokeWeight(5);
    noFill();
    beginShape();
// drawing ranunculoid, for this one, I didn't need small increments with mapping
    for (var i = 0; i < nPoints; i += 0.3){
      var xr = ar * (8 * cos (i) - cos (8 * i));
      var yr = ar * (8 * sin (i) - sin (8 * i));
      vertex(xr, yr);
}
endShape();
}

function drawRanunculoid2(){
    var ar2 = 15;

    fill(215, 252, 212);
    noStroke();
    beginShape();
// drawing second ranunculoid
    for (var i = 0; i < nPoints; i += 0.3){
      var xr2 = ar2 * (6 * cos (i) - cos (6 * i));
      var yr2 = ar2 * (6 * sin (i) - sin (6 * i));
      vertex(xr2, yr2);
}
endShape();
}
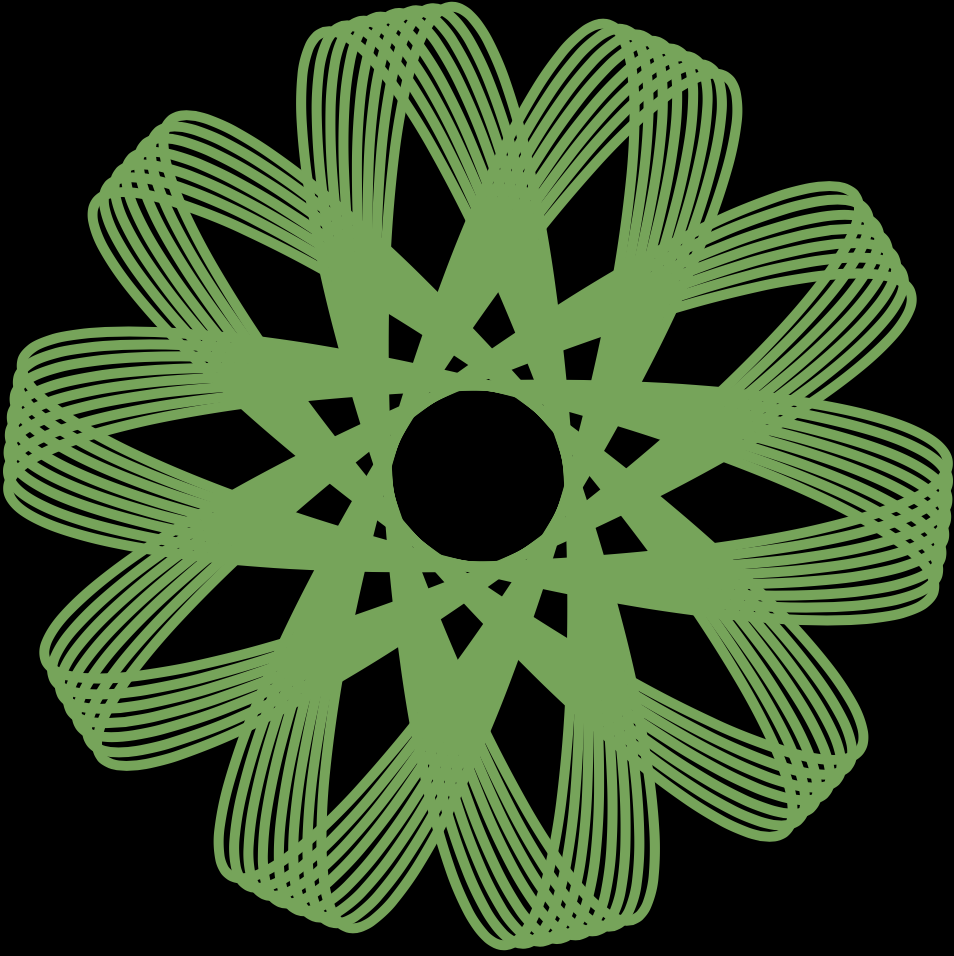
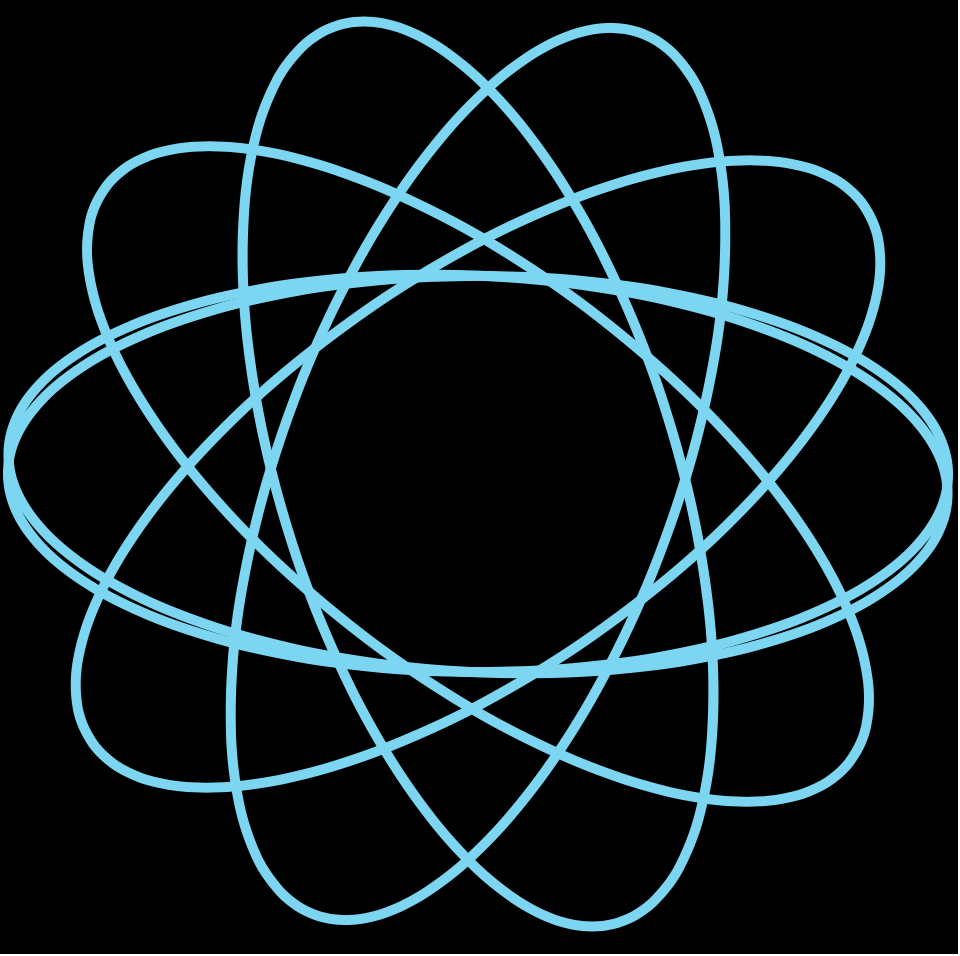
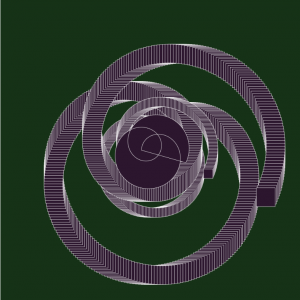
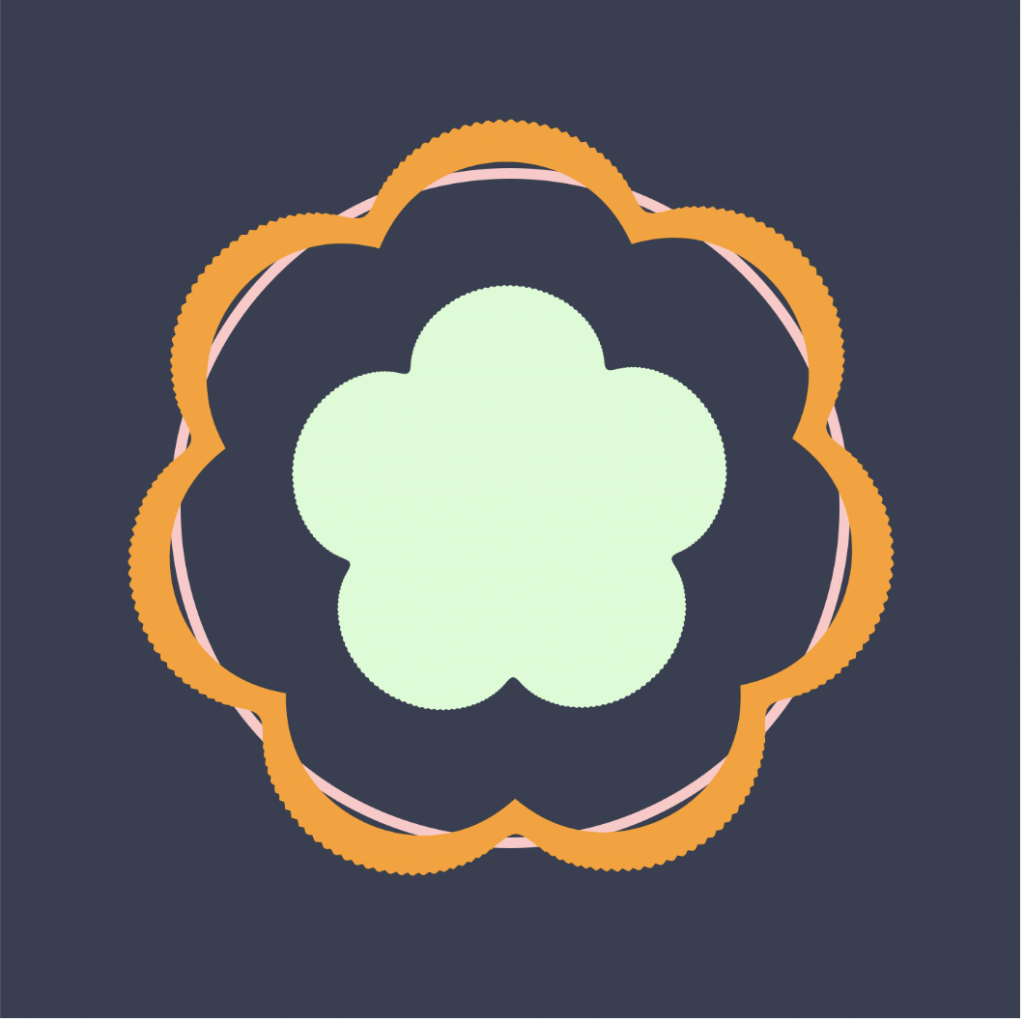
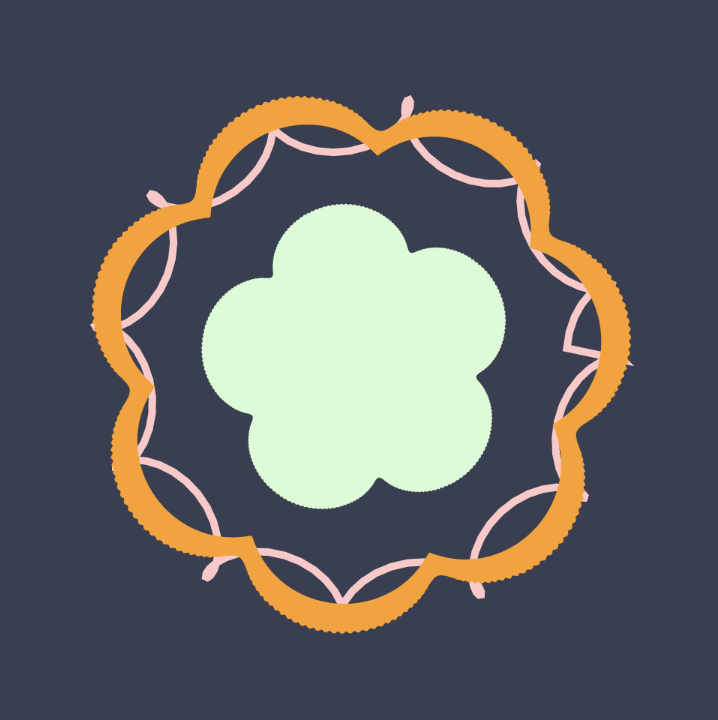
I spent fair amount of time browsing the Mathworld Curves website. How I approached this project was, instead of trying to plan the big picture (unlike the other projects), I chose one curve shape I liked and started there. Then, I slowly added other shapes. Unintentionally, my final work looks like a flower, which I am happy with. As the rotation gets faster and the hypercycloid expands, it almost looks like a blooming flower. Overall, it was interesting to play around with different math equations.
When mouseX is on the left edge of the canvas. Rotation is the slowest, and hypocycloid forms a circle.When mouseX is on the far right of the canvas. Rotation is at its fastest and the hypocycloid forms curls.
In this project, it was fun to explore the different kinds of curves that can be created with math equations, and it intrigues me how interesting patterns can be generated through math. I took a pop art approach to my project by using bright colors and thick outlines.
The Hypotrochoid curve
The Astroid curve
//Charmaine Qiu
//charmaiq@andrew.cmu.edu
//section E
//Project - 07 - Composition Curve

function setup() {
    createCanvas(480, 480);
}

function draw() {
    //set color to change with movement of mouse
    background(mouseX, mouseY, 100);
    drawHypotrochoid();
    drawAstroid();
}

function drawHypotrochoid() {
  //http://mathworld.wolfram.com/Hypotrochoid.html
  //constraining the mouse action to the canvas
  //map the variables in equation to a fit proportion of the curve
    var x = constrain(mouseX, 0, width);
    var y = constrain(mouseY, 0, height);
    var a = map(x, 0, width, 150, 200);
    var b = map(y, 0, height, 0, 50);
    var h = map(x, 0, width, 0, 50);

  //draw the first curve
    push();
    strokeWeight(10);
    beginShape();
    //rotate so that the beginning of curve does not show
    rotate(radians(120));
    //for loop that makes the shape
    for(var i = 0; i < 300; i += .045){
      var t = map(i, 0, 300, 0, TWO_PI);
      //equation of the curve
      x = (a - b) * cos(t) + h * cos(((a - b) / b) * t);
      y = (a - b) * sin(t) + h * sin(((a - b) / b) * t);
      vertex(x, y);
    }
    endShape(CLOSE);
    pop();

  //drawing the sencond curve
    push();
    //place it at the right bottom corner of canvas
    translate(width, height);
    strokeWeight(10);
    beginShape();
    //for loop that makes the shape
    for(var i = 0; i < 300; i += 0.045){
      var t = map(i, 0, 300, 0, TWO_PI);
      //equation of the curve
      x = (a - b) * cos(t) + h * cos(((a - b) / b) * t);
      y = (a - b) * sin(t) + h * sin(((a - b) / b) * t);
      vertex(x, y);
    }
    endShape(CLOSE);
    pop();
}


function drawAstroid(){
  //http://mathworld.wolfram.com/Astroid.html
    //draw first curve
    push();
    //place curve at center of canvas
    translate(width / 2, height / 2);
    strokeWeight(10);
    //constraining the mouse action to the canvas
    //map the variables in equation to a fit proportion of the curve
    var x = constrain(mouseX, 0, width);
    var y = constrain(mouseY, 0, height);
    var a = map(mouseX, 0, width, 150, 200);
    beginShape();
    //for loop that makes the shape
    for(var i = 0; i < 2 * PI; i += 0.045){
      //rotate with the increment of mouseX
      rotate(radians(x));
      //equation of the curve
      y = a * pow(sin(i), 3);
      x = a * pow(cos(i), 3);
      vertex(x, y);
    }
    endShape();
    pop();

    //draw first curve
    push();
    //place curve at center of canvas
    translate(width / 2, height / 2);
    strokeWeight(10);
    //constraining the mouse action to the canvas
    //map the variables in equation to a fit proportion of the curve
    var x = constrain(mouseX, 0, width);
    var y = constrain(mouseY, 0, height);
    var a = map(mouseX, 0, width, 20, 70);
    beginShape();
    //for loop that makes the shape
    for(var i = 0; i < 2 * PI; i += 0.045){
      //rotate with the increment of mouseY
      rotate(radians(y));
      //equation of the curve
      y = a * pow(sin(i), 3);
      x = a * pow(cos(i), 3);
      vertex(x, y);
    }
    endShape();
    pop();

}
/*
Joanne Chui
Section C
Project 6
*/
var nPoints = 200;
function setup(){
createCanvas(400,400);
frameRate(10);
}
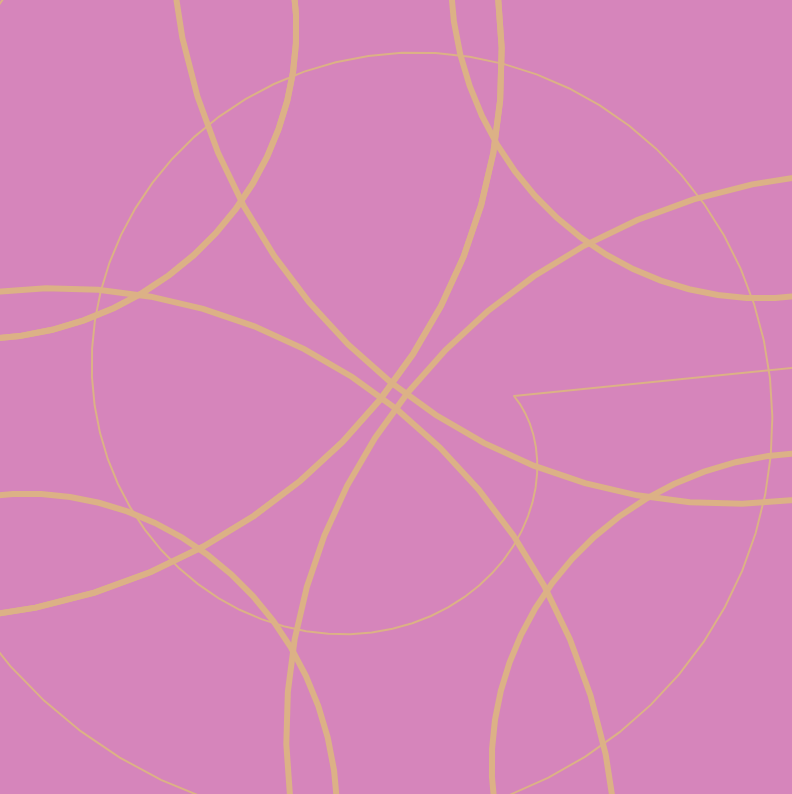
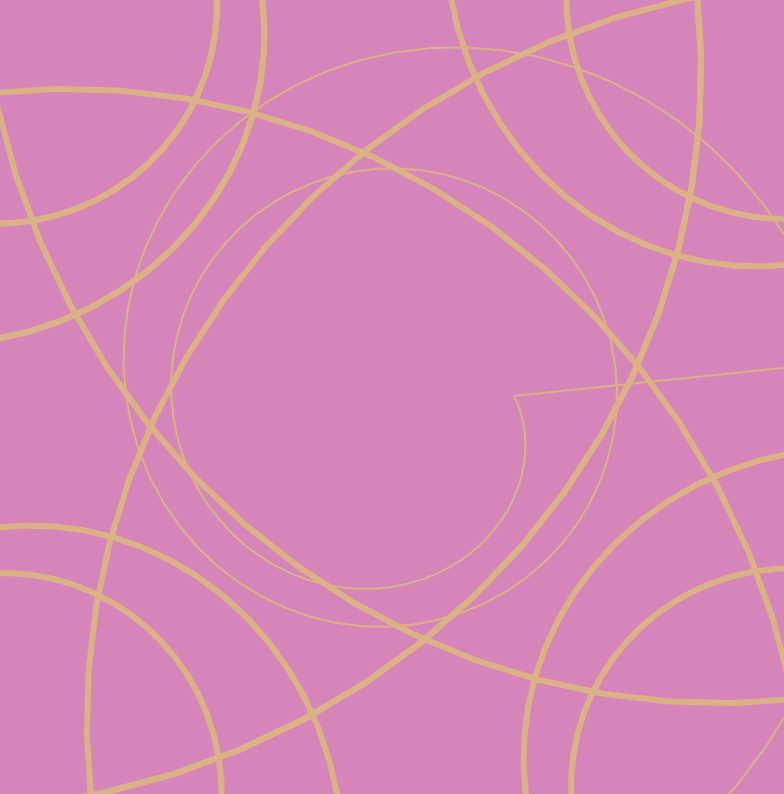
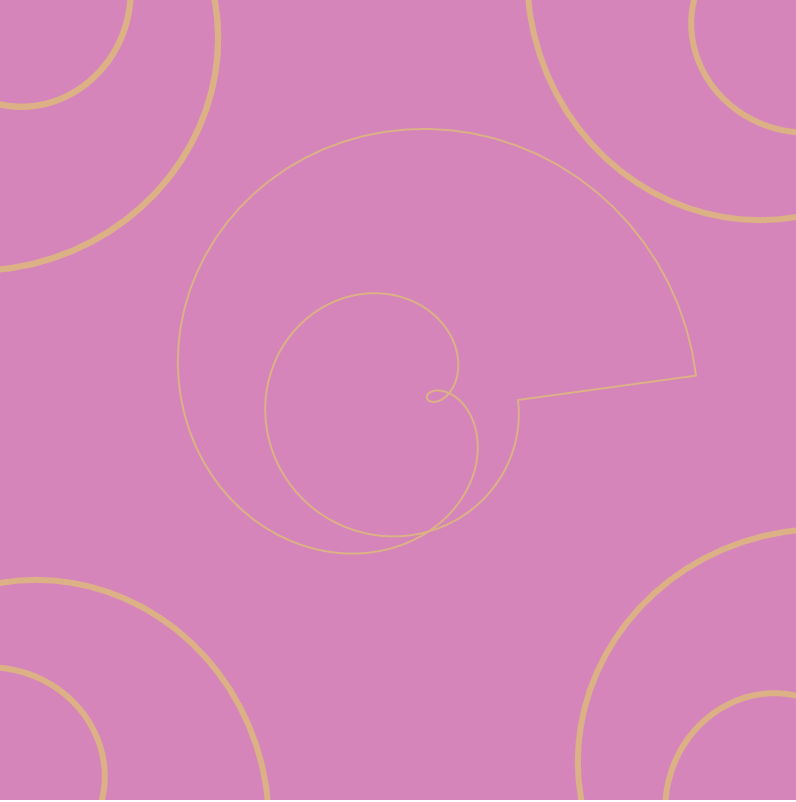
function draw(){
background(227, 127, 190);
stroke(227, 175, 127);
spirograph();
push();
translate(200, 200);
for(var a = 0; a < 5; a++){
rotate(a * PI/2);
strokeWeight(3);
spirograph();
}
pop();
}
function spirograph(){
var x = constrain(mouseX, 0, width);
var y = constrain(mouseY, 0, height);
var r = 40;
var s = 100;
push();
translate(200, 200);
beginShape();
noFill();
for(i = 0; i<nPoints; i++){
var t = map(i, 0, nPoints, 0, 5*TWO_PI);
x = (s - r)*cos(r*t/s) + i*(mouseX/100)*cos((1 - r/s)*t);
y = (s - r)*sin(r*t/s) + i*(mouseX/100)*sin((1 - r/s)*t);
vertex(x, y);
}
endShape(CLOSE);
pop();
}
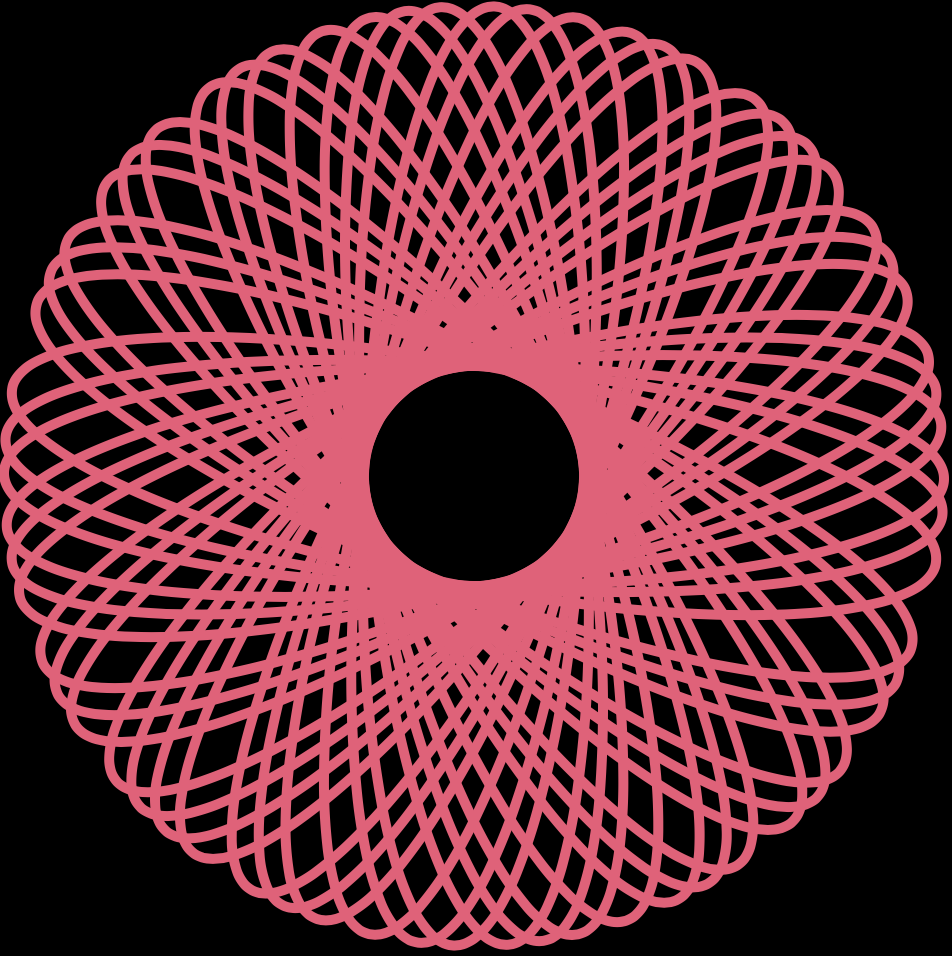
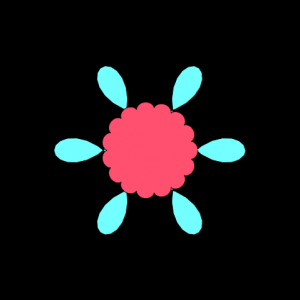
I made the original curve visible so that when a pattern is generated on the screen you can see where the pattern is derived from. I also liked the look of fewer lines so that the pattern seems more abstract.
Nicholas Felton is both a designer and artist who transcribes numbers into something more meaningful whether it is an object or experience. One of the projects that I was interested was his collaboration with MoMa Store and art screen company Framed. They were using a year of data to come up with an app called BikeCycle.
The app visualizes a year of data in New York’s bike sharing program CitiBike focusing mainly into five different aspects. 1) Activity 2) popular routes 3)stations 4)bikes and 5)cyclist demographics.
I was mainly drawn by this project because I was interested in how bike rental apps developed over the course of the year. This project was done and released back in 2015, and obviously there are many more apps like this today. I was surprised to find how this app looks very similar that of today but also perhaps more artistic. It’s hard to know more about the specific algorithm behind the project but I could still read the creator’s artistic sensibilities.
![[OLD FALL 2019] 15-104 • Introduction to Computing for Creative Practice](../../../../wp-content/uploads/2020/08/stop-banner.png)