![[OLD FALL 2019] 15-104 • Introduction to Computing for Creative Practice](../../../../wp-content/uploads/2020/08/stop-banner.png)
//Julia Nishizaki
//Section B
//jnishiza@andrew.cmu.edu
//Project 09 - Computational Portrait

var siblingImage;

function preload() { // load image
    var siblingImageURL = "https://i.imgur.com/oi1ahe3.jpg";
    siblingImage = loadImage(siblingImageURL);
}

function setup() {
    createCanvas(320, 480); // same ratio as photo, 2:3
    background('white'); // white background
    rectMode(CENTER);
    siblingImage.loadPixels();
    frameRate(1000); // beginning frame rate
}

function draw() {
    var px = random(width);
    var py = random(height);
    var ix = constrain(floor(px), 0, width - 1);
    var iy = constrain(floor(py), 0, height - 1);
    var theColorAtLocationXY = siblingImage.get(ix, iy);
    var psize = map(mouseY, 0, height, 1, 7); // size of rectangles based on y coordinate of mouse
    var pcorner = 1; // how curved the corners of the rectangle are
    var pdimenW = map(mouseX, 0, width, 4, 8); // As mouse moves to right, width increases, height decreases
    var pdimenH = map(mouseX, 0, width, 8, 4); // As mouse moves to left, height increases, width decreases

    noStroke();
    push()
    translate(px, py);
    if (mouseIsPressed) { // if mouse is pressed, rectangles are rotated 45 degrees
        rotate(PI / 4);
    }
    scale(psize); // rectangle size increases and decreases as mouse moves vertically
    fill(theColorAtLocationXY);
    rect(0, 0, pdimenW, pdimenH, pcorner, pcorner, pcorner, pcorner); //creates colored squares
    pop();
}
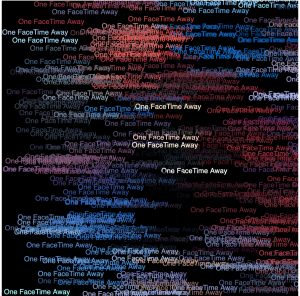
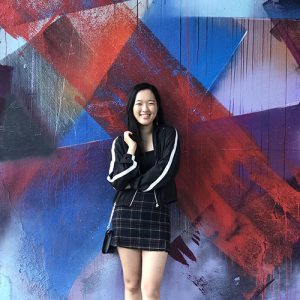
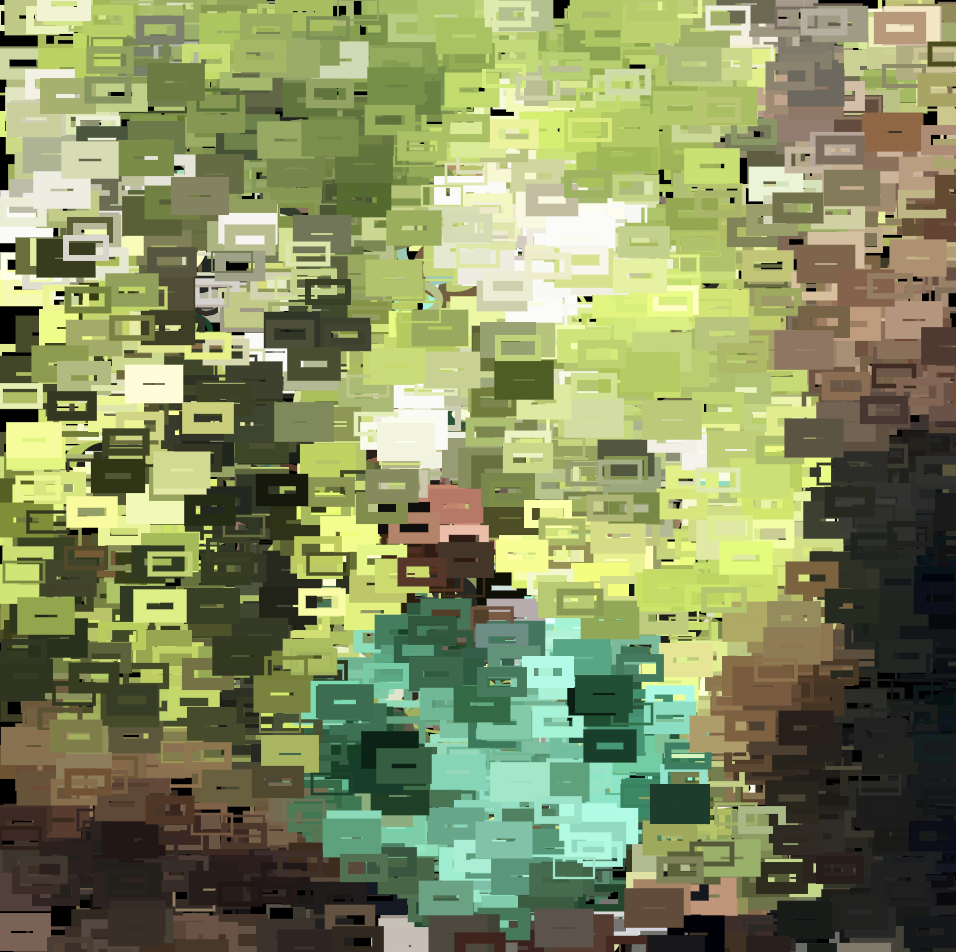
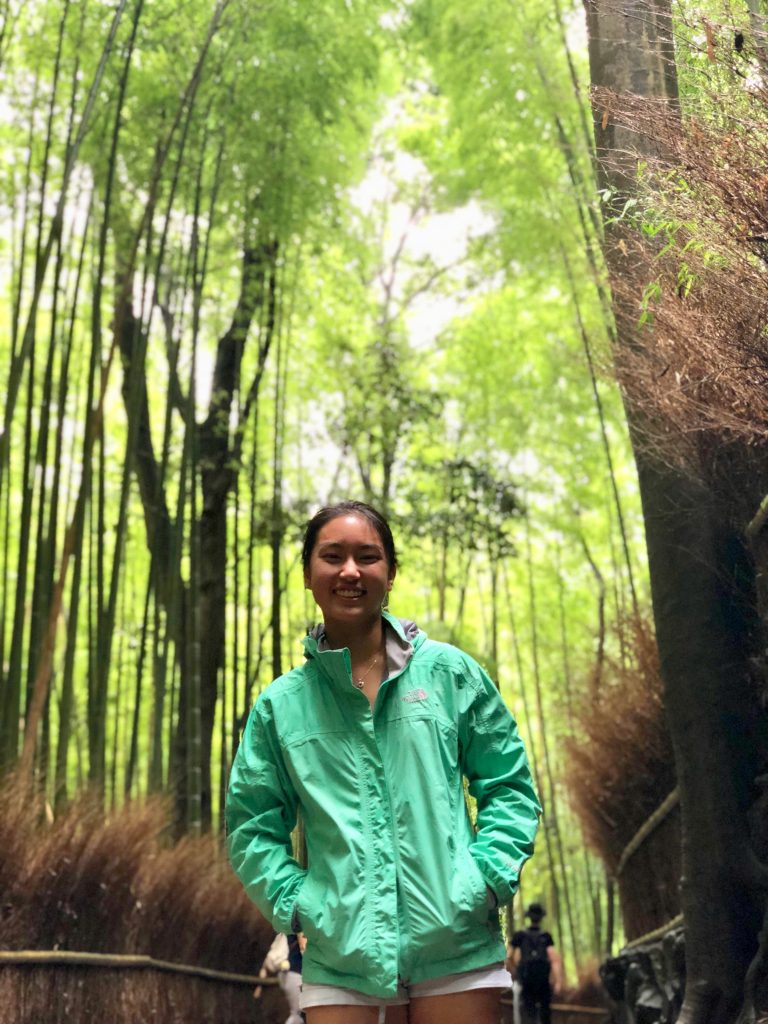
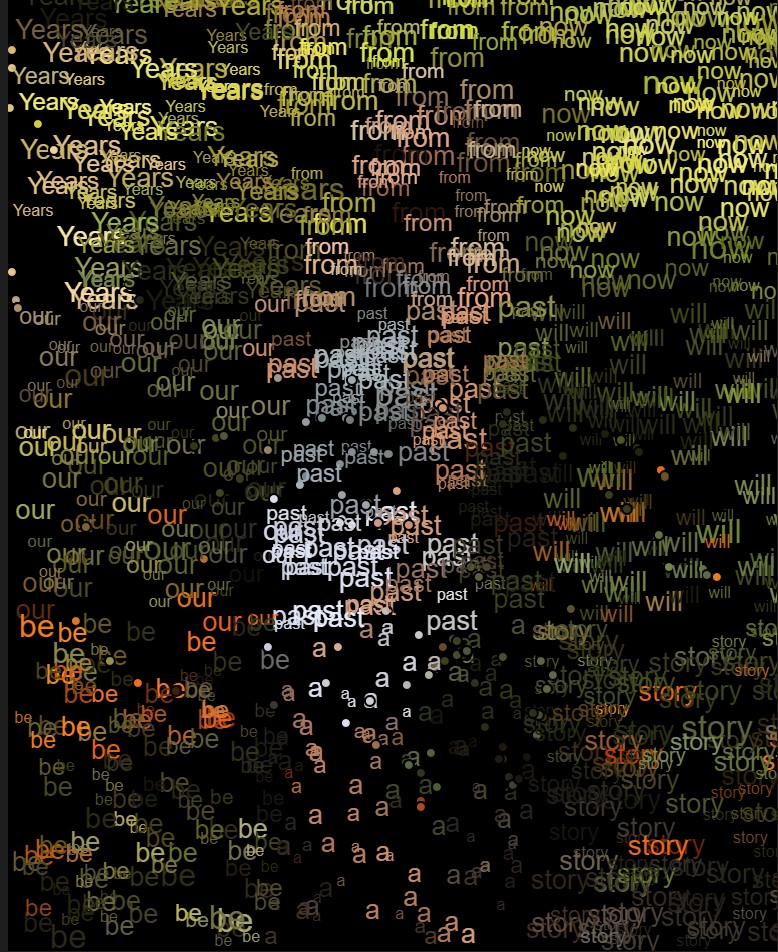
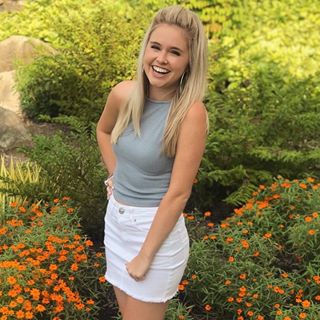
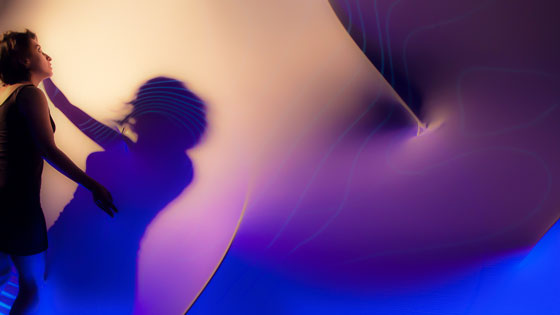
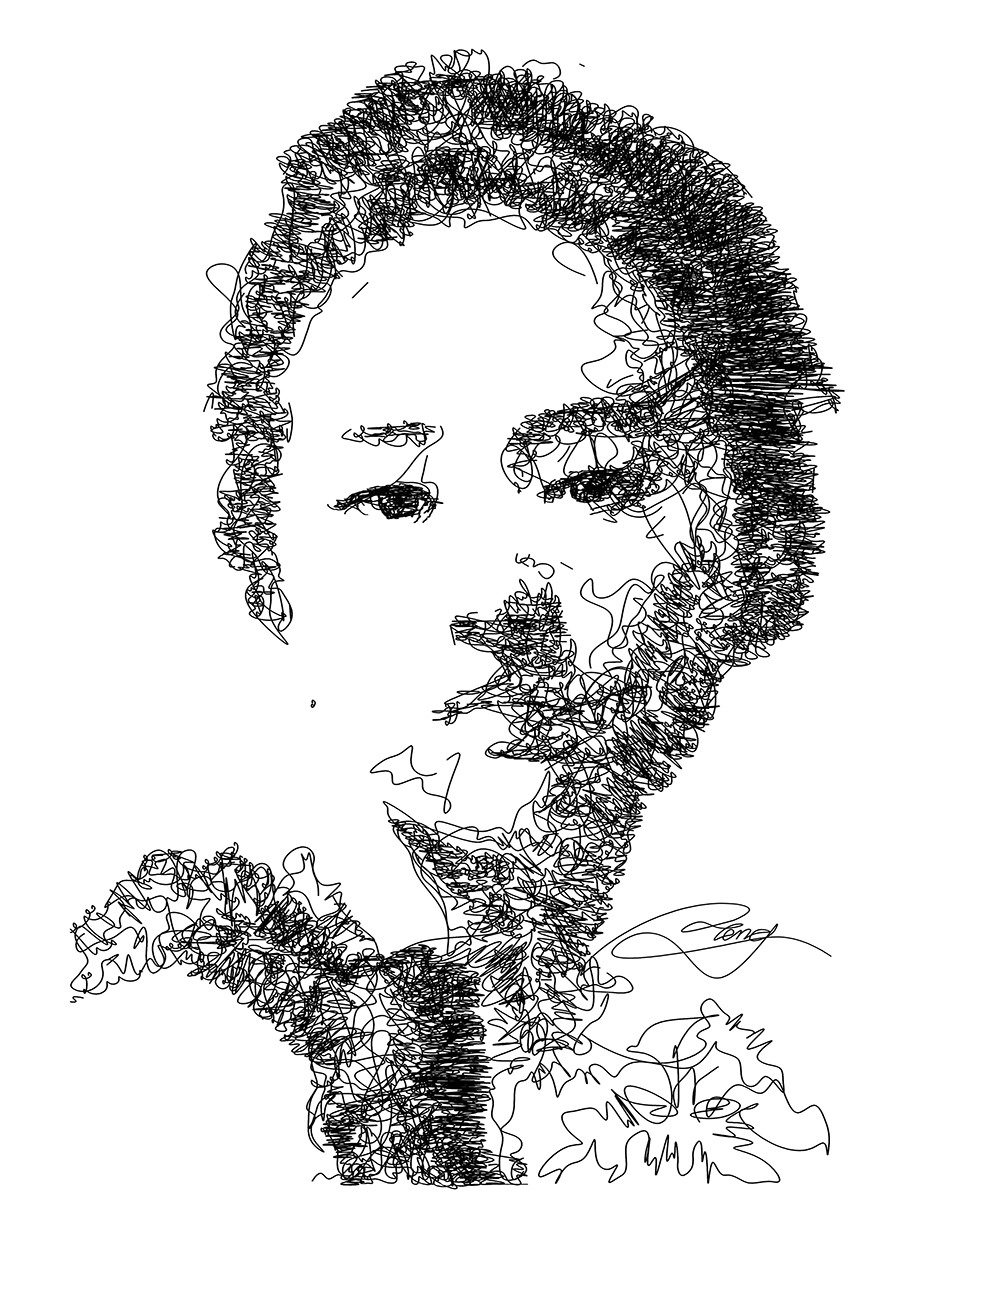
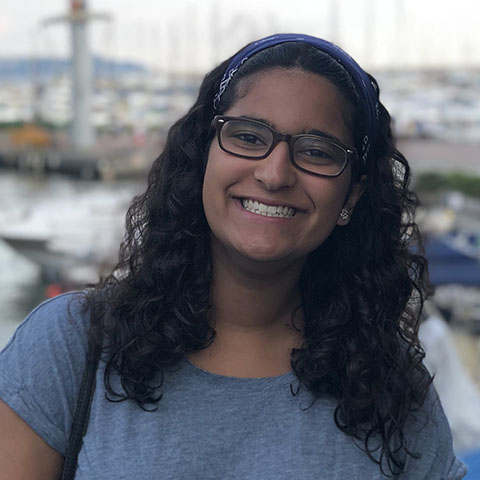
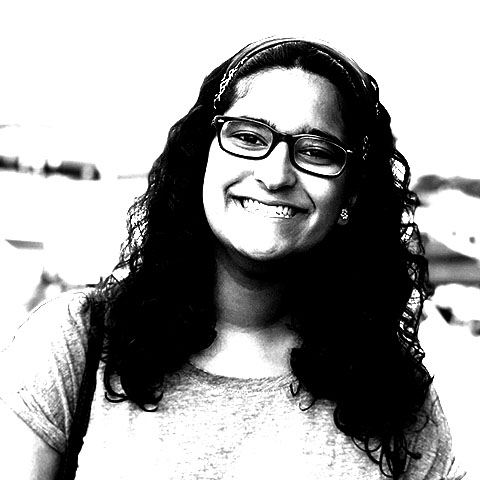
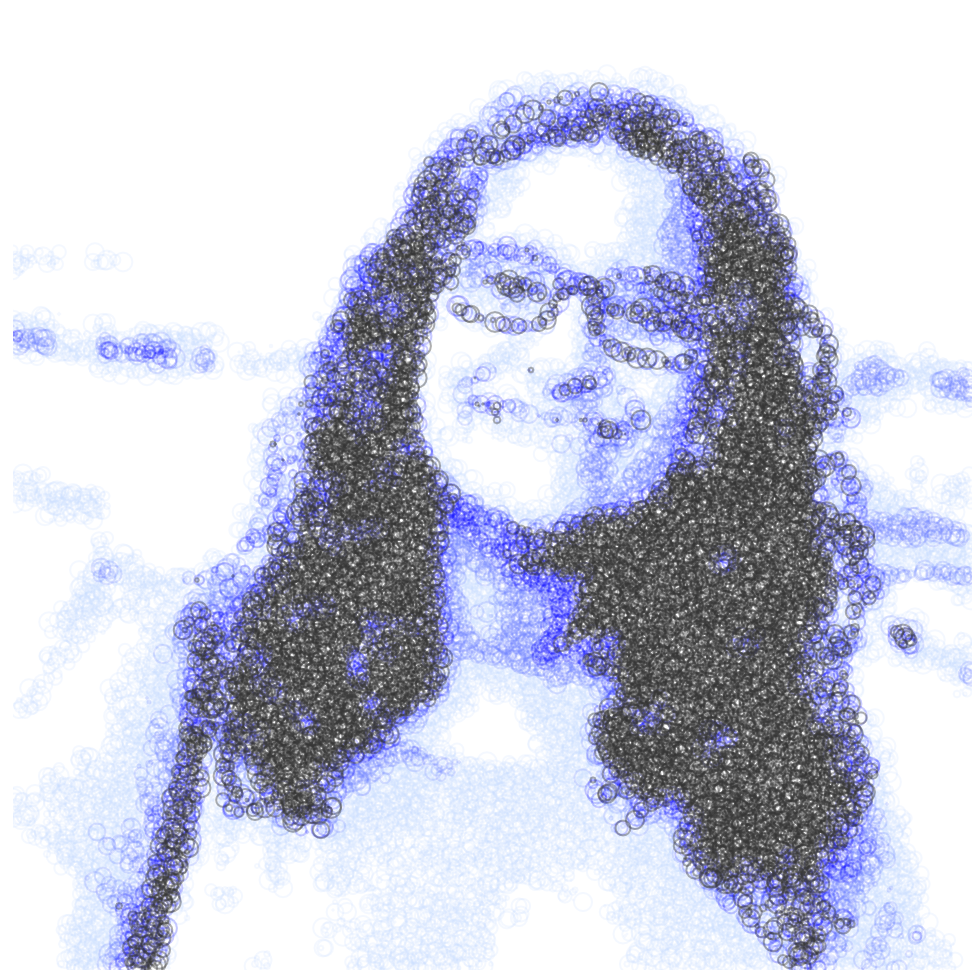
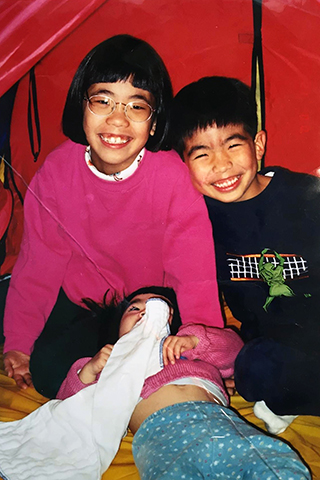
For this project, I chose a photo of my siblings and I when we were younger (I’m the one who’s lying on the floor half covered by a blanket). I wanted to create something that was fun and interactive, while also obscuring the contents of the photo a little, allowing you to view different layers of information, and conveying the emotions and silliness of that memory. The rectangles scale in size, width and height depending on the coordinates of the mouse, and when you click, the rectangles rotate 45 degrees.
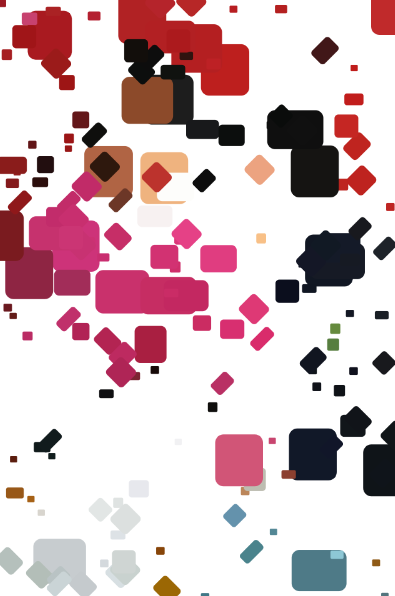
Right after starting 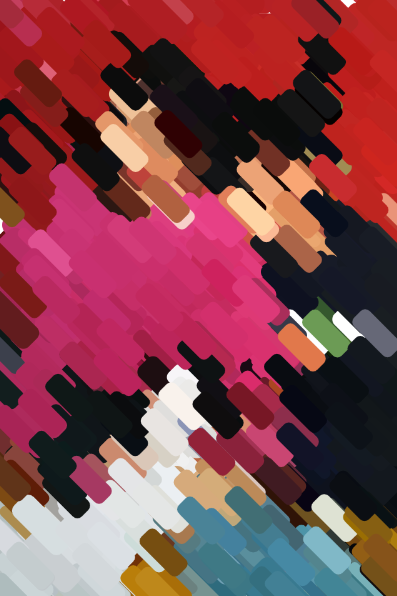
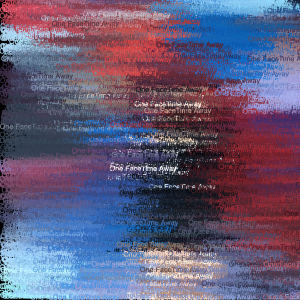
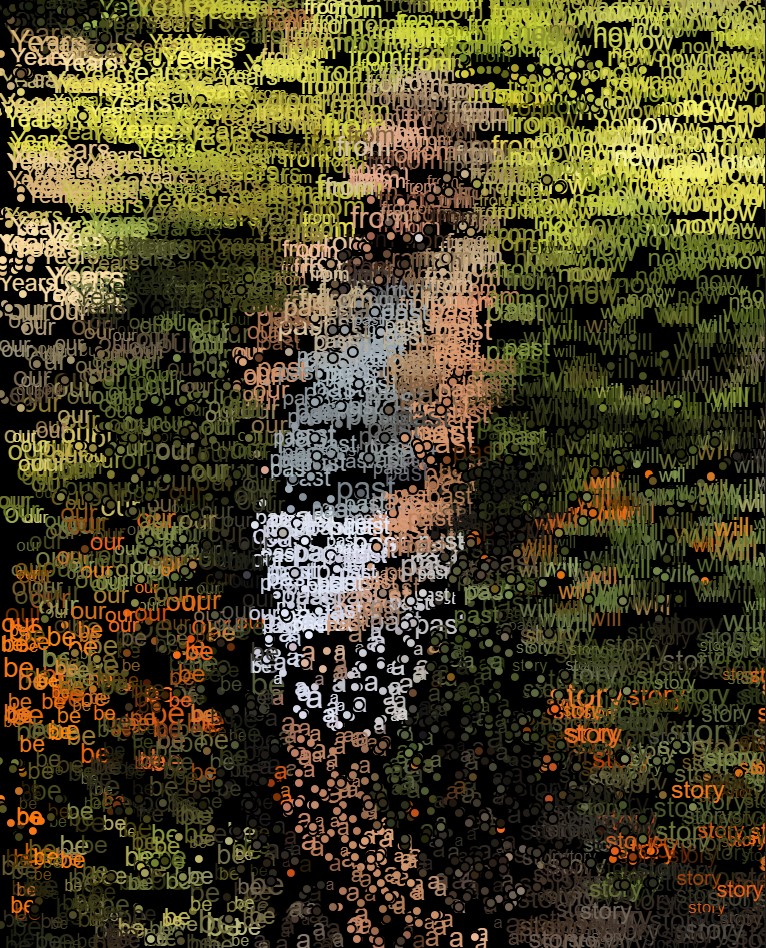
When mouse is held down, rectangles start appearing rotated 45 degrees 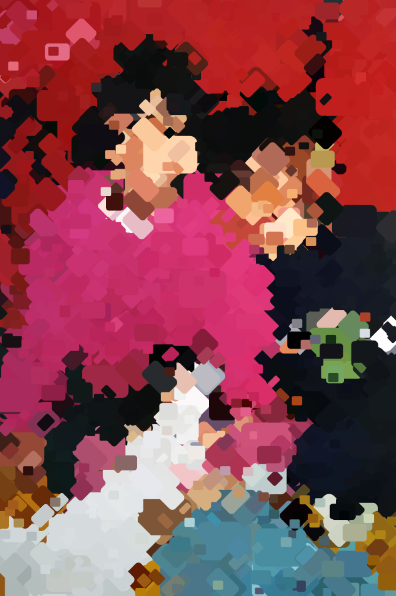
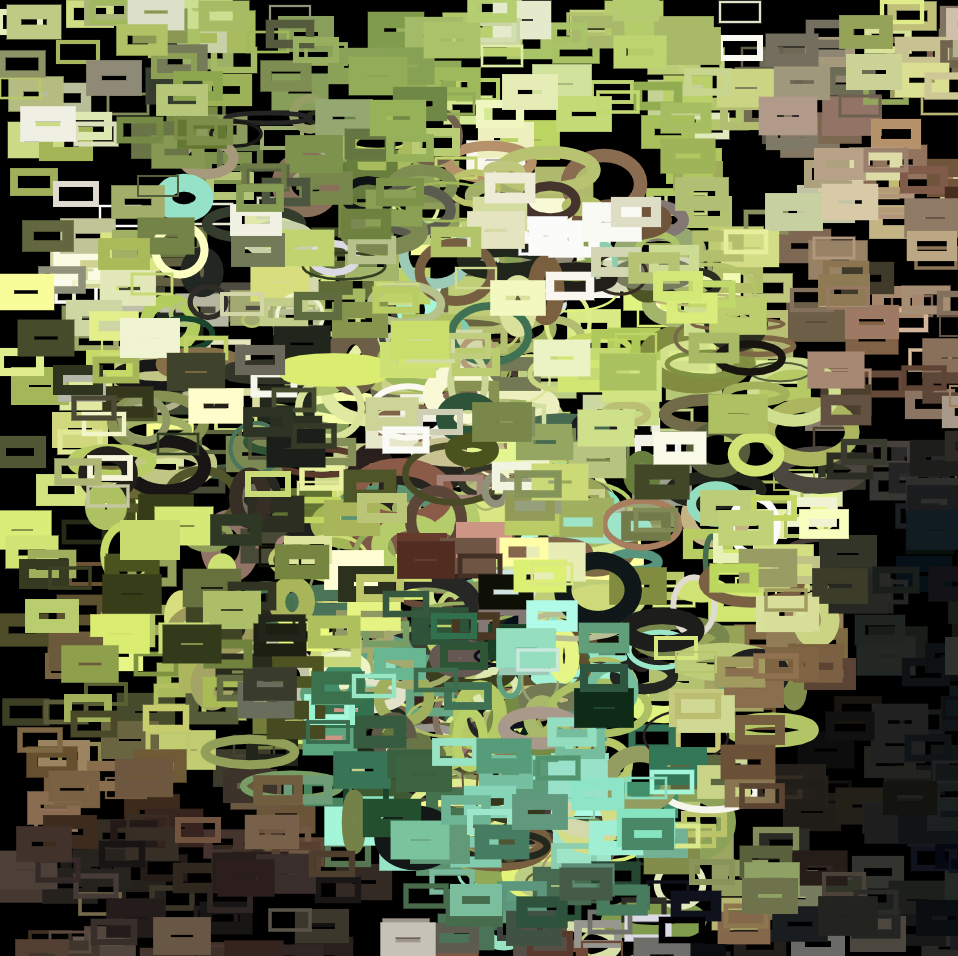
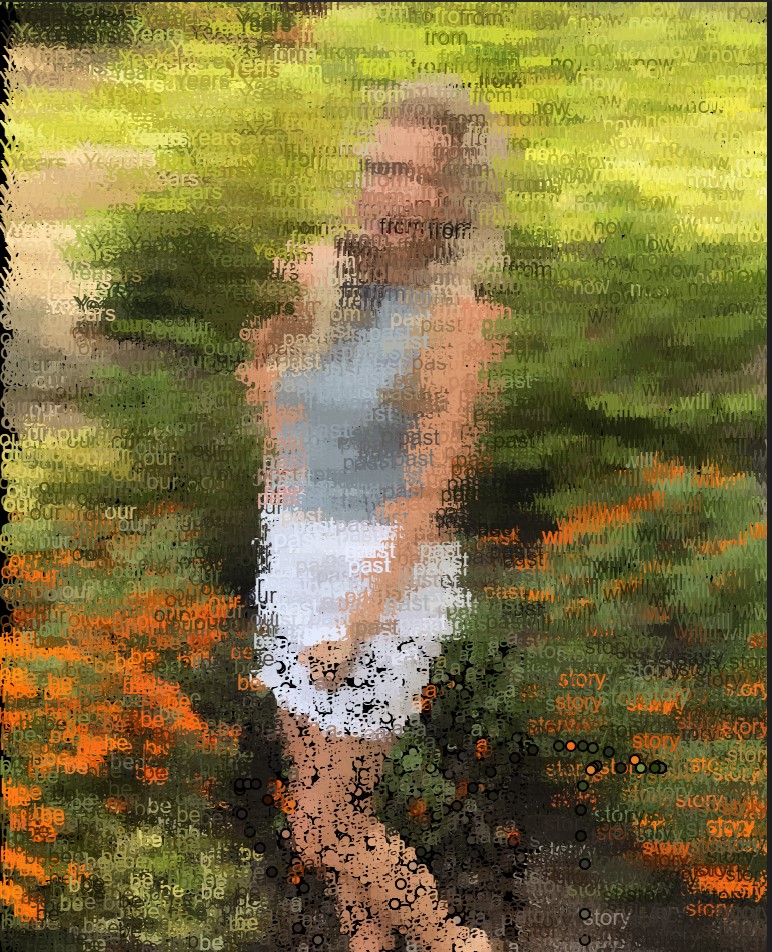
A mixture of rectangles with different dimensions, scales, and orientations