Rachel Shin – Project 04 – String Art

reshin-string art

//Rachel Shin
//reshin
//15-104 Section B
// Project - 04 String Art

var shift = 10; // changing the lines position from one another (increments)
var a = 0;
var b = 0;
var c = 0;
var d = 0;
var e = 0;

function setup() {
    createCanvas(400, 300);
    background(0);
   
}

function draw() {


// left middle to right middle: orange curves that cover canvas based on mouseX and e value
for (var e = 0; e < width; e+= shift){
	strokeWeight(0.5);
	stroke(245, 202, 147);
	line(mouseX, 300-e, e-100, e*0.5);
}


//bottom left to top right: pink rays
for (var c = 0; c < width; c += shift){
	strokeWeight(0.5);
	stroke(84, 77, 84);
	line(0, c-10, width, c*0.5);
}

let leftBound = 100;
let rightBound = 300;
let bound1 = constrain(mouseX, leftBound, rightBound);

//top middle to bottom middle: white rays to form off white rectangle with mouseX movement
for (var d = 0; d < height; d += shift){
	strokeWeight(0.5);
	stroke(225);
	line(bound1, mouseY, height/2, d*0.5);
}

//right top of canvas: green curves
 for (var a = 0; a < height; a += shift){
 	strokeWeight(0.5);
 	stroke(168, 201, 157);
 	line(a, 0, width, a*0.5);
 }

//top left of canvas: blue rays
for (var b = 0; b < width; b += shift){
	strokeWeight(0.5);
	stroke(157, 174, 201);
	line(0, 0, height, b*0.5);
	
}}

For this project, I wanted to implement a variety of strings that would, while visually very different, would produce a cohesive visual. I first arranged the code by creating a light green web-like string art at the top right corner and brought the rest of the art counter-clockwise. I then chose to push the off-white string art to the back to bring more attention to the colored lines. I also wanted to employ mouseX and mouseY and constrain to experiment more. I found it very interesting to layer strings on top of each other to create more dimensional art.

Minjae Jeong-Project-04-StringArt

sketch

//Minjae Jeong
//Section B
//minjaej@andrew.cmu.edu
//Project-04


function setup() {
    createCanvas(400,300);
    background("black");
    strokeWeight(0.1);
}

function draw() {
    stroke(mouseX / 3, mouseY / 2, 255); //diagonal line
    line(0, 300, 400, 0);

    for (i = 0; i < 400; i += 10) { //top left purple curve
        stroke(204, 153, 255);
        line(0, 300 - i, i, 0);
    }

    for (i = 0; i < 400; i += 10) { //bottom right emerald curve
        stroke(0, 255, 255);
        line(i, 300, 400, 300 - i);
    }

    //center
    for (i = 0; i <= 200; i += 20) { //1st quadrant
        stroke(153, 102, 255);
        line(200, i - 50, 200 + i, 150);
    }
    for (i = 0; i <= 200; i += 20){ //3rd quadrant
        stroke(0, 255, 204);
        line(i, 150, 200, 150 + i);
    }
}

First it was very confusing to integrate for loops and line function to create string art. But after understanding the basics, It was a very fun and creative project to work on.

Crystal-Xue-Project-04

sketch-298.js

//Crystal Xue
//15104-section B
//luyaox@andrew.cmu.edu
//project-04

function setup() {
    createCanvas(400, 300);
}

function draw() {
    background(0);
    stroke(255);

    //set constrain to the mouse location
    var x = constrain(mouseX, 0, width);
    var y = constrain(mouseY, 0, height);

    //set up color gradient palette
    let from = color(102, 153, 161);
    let to = color(180, 129, 187);
    let interA = lerpColor(from, to, 0.15);
    let interB = lerpColor(from, to, 0.3);
    let interC = lerpColor(from, to, 0.45);
    let interD = lerpColor(from, to, 0.6);
    let interE = lerpColor(from, to, 0.75);

    //draw string geometries
    for (var i = 0; i <= width; i = i + 5 ) {

        //background dynamic grid change along mouse indicator
        stroke(from);
        strokeWeight(0.7);
        line(i, 3 / 4 * i, i, y);
        stroke(interA);
        line(i, 3 / 4 * i, x, 3 / 4 * i);

        //first pair of curves controlled by mouse location
        stroke(interB);
        line(i, 3 / 4 * i, width - i, y);
        stroke(interC);
        line(i, 3 / 4 * i, x, height - 3 / 4 * i);

        //second pair of curves opposite of the first pair
        stroke(interD);
        line(i, height - 3 / 4 * i, width - i, y);
        stroke(interE);
        line(i, height - 3 / 4 * i, x, 3 / 4 * i);

        //drawing the mouse indicator
        stroke(to);
        strokeWeight(2);
        line(x, y, width - i, y);
        stroke(to);
        strokeWeight(2);
        line(x, y, x, height - 3 / 4 * i);

     }
}

For this project, I was trying to mimic the abstract motion of the weaving process. The mouse indicator is the shuttle of a loom which shows the x and y coordinate positions. The background grid is the unwoven warp yarn showing the parallel lines. And the curves are the woven pieces. I also experimented with the gradient colors in p5js.

Rachel Shin- LO4

Weather Thingy – Real time climate sound controller

In 2018, Adrien Kaeser developed a computation system that linked climate and music to produce a variation of sounds according to the change in climate. Kaeser developed this system with Arduino, Weather Meters, environment sensor, C++ coding, and MIDI, allowing him to configure a connection between climate and sound production.

As someone with a musical background, I admired how Kaeser took the time to configure each component of music and audience experience to a certain climate factor. He altered the panning, delay, and frequency according to the change in wind, UV sensor, and wind speed respectively. I appreciated this project particularly because it allowed Kaeser to encourage listeners to adopt a different musical style in contrary to the conventional pop, lo-fi, and rap styles taken today. I suppose that the algorithms used to generate the work came from creating two platforms of which one was made to visually represent a soundscape while the other produced configured sound variations based off of the visualized soundscape. The two were then linked with coding and sensors to produce this “Weather Thingy.” The creator’s artistic sensibilities manifested in the final form by controlling and modifying music and sound production by a console and interface that translates climate data into a visual representation of sound.


Crystal Xue-LookingOutwards-04

Carsten Nicolai is an artist and musician based in Berlin who is famous for presenting the scientific quality of sound in unique artistic ways. In the contemporary ages, art is not merely 2 dimensional. It can be interpreted and perceived in all different senses. And Carsten is dedicating his life working on visualizing sound in the most minimalistic installations.

This is one of his recent work -Reflektor Distortion, as the video and the photos shown progressively further away, the installation is conceived as a rotating basin filled with water. The contrast of the black and white used here is perfect for showing the distortion nuance of the sound changing in its frequency.

Carsten Nicolai – reflektor distortion

As we gradually stepping outwards, the installation is fairly simple, straightforward and effect-maximized. I really appreciate the aesthetics and simplest medium that Carsten chose here – “water”, as opposed to complex technology devices.

Ghalya Alsanea – Looking Outwards – 04

Making of Off the Staff (link)

By Nicholas Rougeux, September 6, 2016 in ArtData

Seeing music

Each dot represents a note in the score. Pitch is indicated by the distance from the center of the image, while the time at which the note occurs is given by the angle from the 12 o’clock position. The size of the dot indicates the duration of the note, and the color of the dot is different for each instrument.

The Four Seasons by Antonio Vivaldi

How they were made

“I can’t read music but I can parse it. The talent of reading music has always escaped me which is a little ironic considering I grew up in a musical family. However, I’ve always enjoyed how sheet music looks so I took a shot at visualizing the notes from musical scores and the result is this series of posters.”

Nicholas Rougeux (the artist)
Scores for single instruments use a single color.
Scores for multiple instruments use color as an added dimension to differentiate instruments.

The original process was:

  1. Original MethoExport XML from MuseScore
  2. Convert XML to CSV with Luxon
  3. Upload select CSV files to Google Sheets: “Copying and pasting tens of thousands of cells into Google Sheets was a slow process and prone to failing—even with the speediest of browsers.”
  4. Combine CSV files with Google Sheets: “The process of combining CSV files with Google Sheets was the most time-consuming step of the original process and had the risk for inaccuracy.”
  5. Import CSV into NodeBox to generate images

The new process is:

  1. Export MIDI from MuseScore
  2. Generate CSV from MIDI file with midicsv-process
  3. Import CSV into NodeBox to generate images

More details on the process here. This includes early versions and tools used. Earlier process can be found here.

What I admire most about his work is the fact that you’re able to visualize an entire musical score in one image. It was really mind opening for me to see the work of famous musicians and how structured they are, especially the work of Bach. It is like although they were made for the beautiful sounds, they still exist to be beautiful visuals.
More examples of Rougeux ‘s amazing posters.

Julia Nishizaki – Project 04 – String Art


sketch

//Julia Nishizaki
//Section B
//jnishiza@andrew.cmu.edu
//Project-04-String Art

function setup() {
    createCanvas(400, 300);
}

function draw() {
    background(19, 120, 160); //blue background
    //Strings
    for (var i = 0; i < width; i ++) {
        //layer 1, light blue, semi transparent
        stroke(207, 239, 255, 75);
        line(0, i * 5, i * (mouseX / 5), height);
        line(width, height - (i * 5), width - (i * (mouseX / 5)), 0);
        line(width, i * 5, width - (i * (mouseX / 5)), height);
        line(0, height - (i * 5), i * (mouseX / 5), 0);
        //layer 2, dark blue, semi transparent
        stroke(9, 73, 112, 75);
        line(i * 5, 0, width, i * (mouseY / 5));
        line(width - (i * 5), height, 0, height - (i * (mouseY / 5)));
        line(i * 5, height, width, height - (i * (mouseY / 5)));
        line(width - (i * 5), 0, 0, i * (mouseY / 5));
    }
}

For this project, I wanted to make something fairly simple and geometric that you could play with and manipulate with your mouse. While creating the lines, their movement and elegant nature reminded me of lace or weaving, so I decided to go with softer colors.

Alec Albright – Project 04 – String Art

sketch

// Alec Albright
// aalbrigh@andrew.cmu.edu
// Section B
// Project 04


var x1StepSize = 5;
var y1StepSize = 0;
var x2StepSize = 0;
var y2StepSize = -4;
var x1 = 0;
var y1 = 150;
var x2 = 200;
var y2 = 150;


function setup() {
    createCanvas(400, 300);
    background("black");
}
 
function draw() {
    // top left 
    makeCurve("red");

    // top right
    x1 = 400;
    y1 = 150;
    x2 = 200;
    y2 = 150;
    x1StepSize = -5;
    y2StepSize = -4;
    makeCurve("limegreen");

    // bottom left
    x1 = 0;
    y1 = 150;
    x2 = 200;
    y2 = 150;
    x1StepSize = 5;
    y2StepSize = 4;
    makeCurve("yellow");

    // bottom right
    x1 = 400;
    y1 = 150;
    x2 = 200;
    y2 = 150;
    x1StepSize = -5;
    y2StepSize = 4;
    makeCurve("purple");

    // bottom left, top left
    x1 = 0;
    y1 = 225;
    x2 = 100;
    y2 = 225;
    x1StepSize = 2.5;
    y2StepSize = -1.75;
    makeCurve("red");

    // bottom left, bottom left
    x1 = 0;
    y1 = 225;
    x2 = 100;
    y2 = 225;
    x1StepSize = 2.5;
    y2StepSize = 1.75;
    makeCurve("yellow");

    // bottom left, top right
    x1 = 200;
    y1 = 225;
    x2 = 100;
    y2 = 225;
    x1StepSize = -2.5;
    y2StepSize = -1.75;
    makeCurve("limegreen");

    // bottom left, bottom right
    x1 = 200;
    y1 = 225;
    x2 = 100;
    y2 = 225;
    x1StepSize = -2.5;
    y2StepSize = 1.75;
    makeCurve("purple");

    // top left, top left
    x1 = 0;
    y1 = 75;
    x2 = 100;
    y2 = 75;
    x1StepSize = 2.5;
    y2StepSize = -1.75;
    makeCurve("red");

    // top left, bottom left
    x1 = 0;
    y1 = 75;
    x2 = 100;
    y2 = 75;
    x1StepSize = 2.5;
    y2StepSize = 1.75;
    makeCurve("yellow");

    // top left, top right
    x1 = 200;
    y1 = 75;
    x2 = 100;
    y2 = 75;
    x1StepSize = -2.5;
    y2StepSize = -1.75;
    makeCurve("limegreen");

    // top left, bottom right
    x1 = 200;
    y1 = 75;
    x2 = 100;
    y2 = 75;
    x1StepSize = -2.5;
    y2StepSize = 1.75;
    makeCurve("purple");

    // top right, top left
    x1 = 200;
    y1 = 75;
    x2 = 300;
    y2 = 75;
    x1StepSize = 2.5;
    y2StepSize = -1.75;
    makeCurve("red");

    // top right, bottom left
    x1 = 200;
    y1 = 75;
    x2 = 300;
    y2 = 75;
    x1StepSize = 2.5;
    y2StepSize = 1.75;
    makeCurve("yellow");

    // top right, top right
    x1 = 400;
    y1 = 75;
    x2 = 300;
    y2 = 75;
    x1StepSize = -2.5;
    y2StepSize = -1.75;
    makeCurve("limegreen");

    // top right, bottom right
    x1 = 400;
    y1 = 75;
    x2 = 300;
    y2 = 75;
    x1StepSize = -2.5;
    y2StepSize = 1.75;
    makeCurve("purple");

    // bottom right, top left
    x1 = 200;
    y1 = 225;
    x2 = 300;
    y2 = 225;
    x1StepSize = 2.5;
    y2StepSize = -1.75;
    makeCurve("red");

    // bottom right, bottom left
    x1 = 200;
    y1 = 225;
    x2 = 300;
    y2 = 225;
    x1StepSize = 2.5;
    y2StepSize = 1.75;
    makeCurve("yellow");

    // bottom right, top right
    x1 = 400;
    y1 = 225;
    x2 = 300;
    y2 = 225;
    x1StepSize = -2.5;
    y2StepSize = -1.75;
    makeCurve("limegreen");

    // bottom right, bottom right
    x1 = 400;
    y1 = 225;
    x2 = 300;
    y2 = 225;
    x1StepSize = -2.5;
    y2StepSize = 1.75;
    makeCurve("purple");
}

// makes a curve based on any color
// x1, y1, x2, y2, and step sizes must be predefined
function makeCurve(color){
    for (i = 0; i < 41; i ++) {
        stroke(color);
        line(x1, y1, x2, y2);
        x1 += x1StepSize;
        y1 += y1StepSize;
        x2 += x2StepSize;
        y2 += y2StepSize;
        noLoop();
    }
}

Throughout my process of creating this visualization, I had to get more familiar with how exactly the string art is generated in terms of the size of steps in the sequence. Once I got a good feel for that, I was able to utilize my knowledge of the coordinate system to make the same image in a variety of interesting places.

Ankitha Vasudev-Looking Outwards-05

Growth: Mysterious Gallery (1983) is a five-minute long animation sequence that was created by Yoichiro Kawaguchi – an artist who became popular for his unique style of art using computer graphics.

In this project, Kawaguchi created a self-organizing, procedural, modelling algorithm that could make many complex life forms. The inspiration for this project was natural and organic objects that exhibit repetitive patterns, such as shells, claws and spiraling plants. Kawaguchi wanted to create an algorithm to recreate these forms artistically. 

A scene from Growth:Mysterious Gallery

I admire this artist and project because of how realistic it’s 3D animation is. Additionally, this technique was one of the first of its kind. Kawaguchi used two process related to image rendering to create this animation: ray tracing and metaballs. Ray tracing defined the color to be rendered in order to add depth to the 3D image. Metaballs were first used by Kawaguchi to represent organic looking, n-dimensional objects. 

After this project, Kawaguchi continued to produce animated short films using 3D computer graphics. Some of his other notable works include Embryo(1988), Gigalopolis(1995) and Cytolon(2002).

Various clips from Growth: Mysterious Galaxy, 1983
Kawaguchi explaining the idea behind his animations

Emma N-M-Project-04(String Art)


stringArt1

/* 
Emma Nicklas-Morris
Section B
enicklas
Project-04
String Art
*/

var x1StepSize = 4;
var y1StepSize = 1;
var x2StepSize = -2;
var y2StepSize = -20;
var x1;
var x2;
var y1;
var y2;


function setup() {
    createCanvas(400, 300);
    background("black");
    x1 = 0;
    y1 = 0;
    x2 = width/3 + 100;
    y2 = height/3 + 50;


}
 
function draw() {
    
    for (var i = 0; i < 350; i += 5) {
        push();
        translate(width/2, height);
        stroke(23, 233, 250);
        line(x1, y1, x2, y2);
        x1 += x1StepSize;
        y1 += y1StepSize;
        // x2 += x2StepSize;
        // y2 += y2StepSize;
        pop();

        stroke("hotpink");
        push();
        translate(width, height/2);
        rotate(degrees(90));
        line(x1, y1, x2, y2);
        // x1 += x1StepSize;
        // y1 += y1StepSize;
        x2 += x2StepSize;
        y2 += y2StepSize;
        pop();

        push();
        translate(0, 0);
        rotate(degrees(10));
        stroke("yellow");
        line(x1, height, width, y2);
        x1 += x1StepSize;
        pop();

        if (i % 25 === 0) {
            stroke("limegreen");
            line(0, y1, width-x2*2, height);
        }
    

    }

    
}

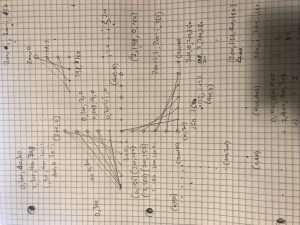
I started with playing around with different x and y positions, but then I didn’t like how static and boring it looked. So I moved to making circles with only lines.

stringArt2

/* 
Emma Nicklas-Morris
Section B
enicklas
Project-04
String Art
*/


var midpoinX;
var midpointY;
var r;
var ai;
var slope;
var b;
var x3;
var y3;
var x4;
var y4;
var k; 
var cosAg;
var sinAg;
var sinAi;
var scaledR;


function setup() {
    createCanvas(400, 300);
    

}
 
function draw() {
    background("black");

    var maxInc = 90; // maximum step increase in the for loop
    var minInc = 3; // minimum step increase in the for loop
    var d = (maxInc - minInc)/width; // value to change mouse position to a smaller value

    // keeps the mouse value inside the canvas
    if (mouseX >= width) {
        mouseX = width;
    }
    else if (mouseX < 0) {
        mouseX = 0;
    }

    if (mouseY > height) {
        mouseY = height;
    }
    else if (mouseY < 0) {
        mouseY = 0;
    }

    var r1 = mouseY/6 + 50; // as mouseY increases, radius increases (max radius = 100, min radius = 50)
    var r2 = 100 - mouseY/6; // as mouseY increases, radius decreases (max radius = 100, min radius = 50)
    var change1 = int(d * mouseX) + minInc; // mouseX changes the amount of lines to make the cirlce (max lines = 120, min lines = 4)
    var change2 = maxInc - int(d * mouseX); // mouseX changes the amount of lines to make the cirlce (max lines = 120, min lines = 4)
    
    // draws pink circle
    push();
    translate(width/3, height/2);
    circles(r2, 8, change1, "hotpink");
    pop();

    // draws light green circle
    push();
    translate(2 * width/3, height/2);
    circles(r1, 8, change2, "lightgreen");
    pop();

    // draws yellow circle
    push();
    translate(width/6, height - change1);
    circles(r1, 8, change1, "yellow");
    pop();

    // draws blue circle
    push();
    translate(width - change2, height/6);
    circles(r2, 8, change2, "aqua");
    pop();

} 


function circles(r, k, inc, hue) {
    for (var ag = 0; ag <= 360; ag += inc) {
        angleMode(DEGREES);
        ai = 90 - ag; // 3rd angle in the triangle created from the tangent line and x axis
        cosAg = cos(ag);
        sinAg = sin(ag);
        sinAi = sin(ai);
        scaledR = k * r; // makes the line longer (or shorter)
        midpointX = r * cosAg; // line's midpoint x position
        midpointY = r * sinAg; // line's midpoint y position

        if ((ag === 0) || (ag === 180)) { // verticle lines
            x3 = r * cosAg;
            y3 = -scaledR;
            x4 = r * cosAg;
            y4 = scaledR;
        }

        else if ((ag === 90) || (ag === 270)) { // horizontal lines
            x3 = -scaledR;
            y3 = r * -sinAg;
            x4 = scaledR;
            y4 = r * -sinAg;
        }

        // not a verticle or horizontal line
        // uses geometry, law of sines, and unit circle to get end points of line
        else {
            slope = ((r * -sinAg) / (r * cosAg - (r / sinAi)));
            b = -slope * (r / sinAi);
            x3 = r * cosAg - scaledR;
            y3 = (slope * x3) + b;
            x4 = r * cosAg + scaledR;
            y4 = (slope * x4) + b;
        }

        stroke(hue);
        line(x3, y3, x4, y4);
    }
}

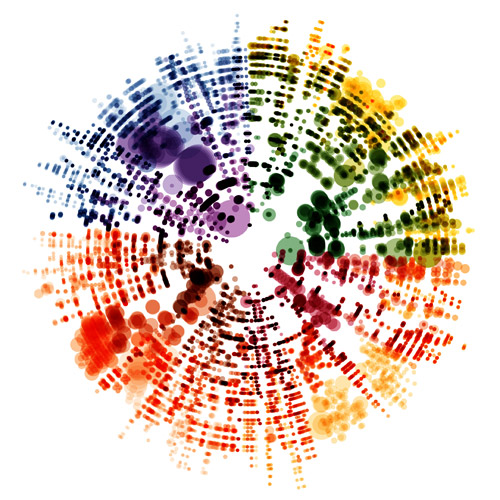
It took a while to get the lines to move around tangential to the circle. There was a lot of math and geometry that I needed a refresher on to get the lines to make a circle. Once the circles were drawn statically, I then used the mouse position to make the circle change in various ways.