Project 07: Mathematical Curves

sketch

//Alana Wu
//ID: alanawu
//Project 07 Mathematical Curves

var nPoints1 = 40;
var nPoints2 = 550;
var nPoints3 = 100;
var whichCurve = 1;


function setup()
{
    createCanvas(480, 480);
    background(0);
    stroke (255);

}

function draw()
{
    translate (width/2, height/2);
    if (whichCurve == 0)
    {
        rotate (radians (constrain (mouseY, 50, height - 50)));
        sinusoidSpiral (); 
    }
    if (whichCurve == 1)
    {
        rotate (radians (mouseX));
        archiSpiral();
    }
    if (whichCurve == 2)
    {
        astroidCurve();
    }

}

//https://mathworld.wolfram.com/SinusoidalSpiral.html
function sinusoidSpiral () //r^n = (a^n)cos(n*theta)
{
    var x;
    var y;
    var a = mouseX/10;
    var b = constrain (mouseX/10, 2, 9);
    var theta = radians (0);

    fill (mouseX - 100, mouseY - 100, mouseY - 100);
    beginShape();
    for (var i = 0; i < nPoints1; i++)
    {
        var theta = map(i, 0, nPoints1, 0, TWO_PI);
        x = a * (b*cos(theta) - cos(b * theta));
        y = a * (b * sin(theta) - sin(b * theta));
        vertex (x, y);
    }
    endShape(CLOSE);
}

//https://mathworld.wolfram.com/ArchimedeanSpiral.html
function archiSpiral ()
{
    var x;
    var y;
    var a = mouseX/10;
    var n = 10;

    push();
    background(0);
    noFill();
    stroke(255);
    strokeWeight(.2);
    beginShape();
    for (var i = 0; i < nPoints2; i++)
    {
        var theta = map (i, 0, nPoints2, 0, TWO_PI*2);
        x = a * cos (theta) * (theta)^(1/n);  //x = rcos(theta)
        y = a * sin(theta)*theta^(1/n) + random(-5, 5); //x = rsin(theta)
        stroke (mouseX, 0, mouseY);
        vertex (x, y);

    }
    endShape(CLOSE);
    pop();
}

//https://mathworld.wolfram.com/AstroidRadialCurve.html
function astroidCurve ()
{
    var x;
    var y;
    var a = 200;

    push();
    background(0);
    stroke(mouseX, mouseX/10, mouseY + 30);
    noFill();
    beginShape();
    for (var i = 0; i < nPoints3; i++)
    {
        var theta = map (i, 0, nPoints3, 0, TWO_PI);
        x = a * (cos (theta))^3 + random (-5, 5);
        y = a * (sin(theta))^3 + random (-5, 5);
        print (x);
        print (y);
        vertex (x, y);
    }
    endShape(CLOSE);
    pop();
}


//which shape is drawn changes when mouse is clicked
function mousePressed ()
{
    whichCurve++;
    if (whichCurve == 3)
    {
        whichCurve = 0;
    }
}


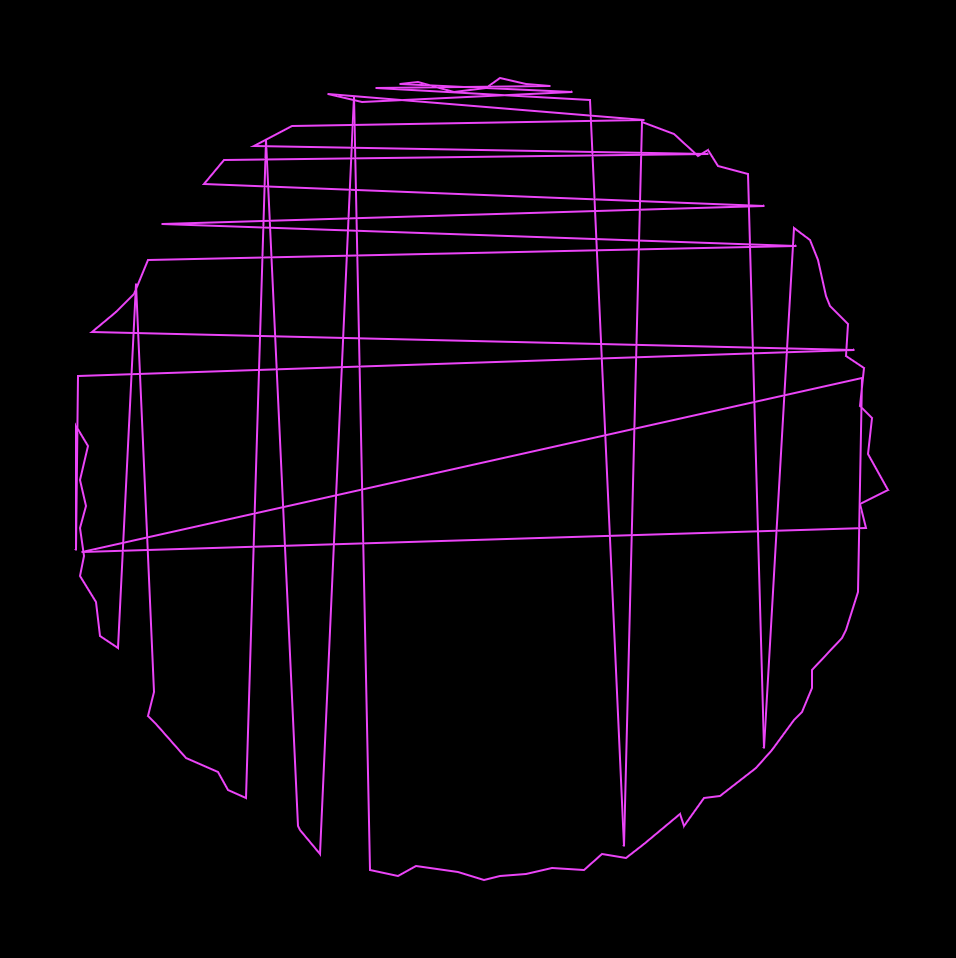
For this project, I chose to use a sinusoidal spiral, an archimedes spiral, and an astroid radial curve. I spent a lot of time altering the parameters to see how they affected the shapes. To add user interaction, I had different aspects of the shapes change with the mouse location, while which curve drawn changed as the mouse was clicked. I particularly liked playing with the colors and rotations of sinusoidal spiral.

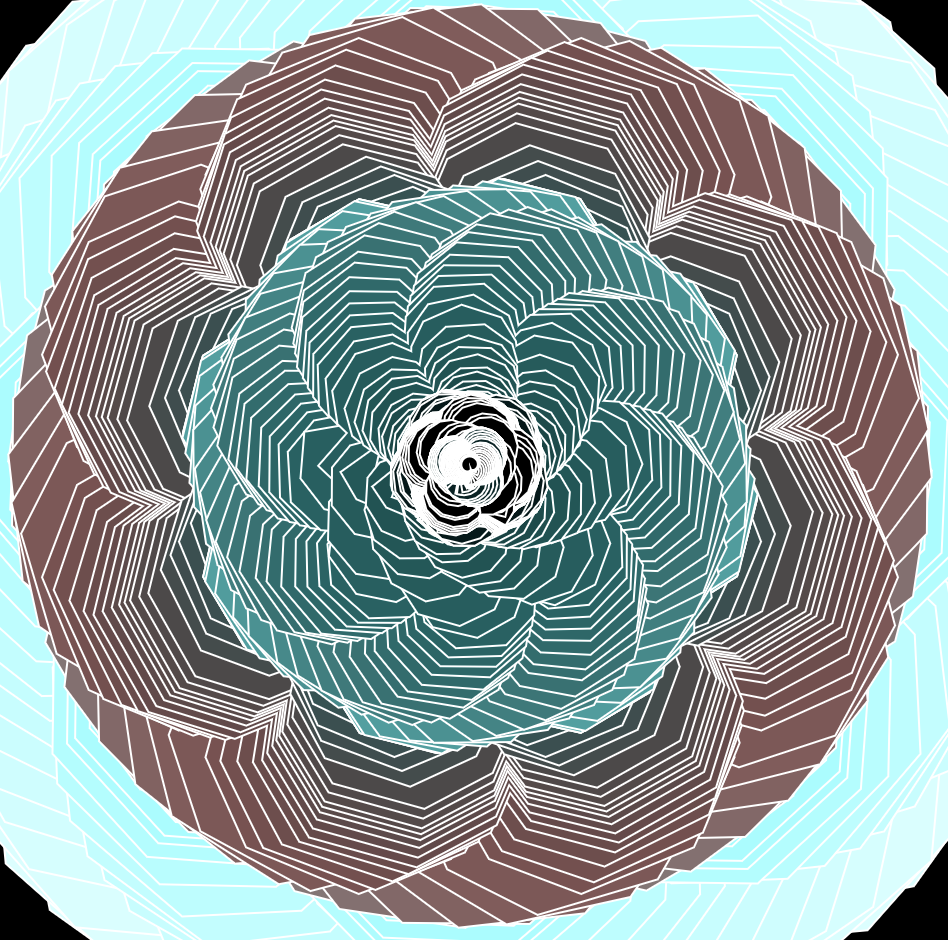
Doing this project also made me wonder how other mathematical concepts can be visualized, and whether or not that could help people understand certain mathematical concepts better.

Information Visualization

Bible-Cross Reference Visualization

https://www.chrisharrison.net/index.php/Visualizations/BibleViz

As someone who is not particularly interested in reading the Bible I was surprised to find Chris Harrison’s work on Bible Cross-References to be both beautiful and thought provoking. I can imagine this work being done on other novels and creating an equally beautiful result. Harrison and Pastor Christoph Romhild worked together to render the data of over 63,000 cross references in the Bible. The cross-references used in the visualization is from bottom page references, concepts, and locations and people found throughout the text. I found the tracking of people throughout the text to be particularly interesting.

Harrison also created a Social network of the people and places mentioned by using a spatial clustering algorithm. I think it is interesting to have a visualization of where people were spending time and how often they are mentioned.

Looking Outwards 7: Information Visualization

“The Rhythm of Food” showing the seasonality of Apricot

The project that I find incredibly intriguing is “The Rhythm of Food” created by teams at the Good News Lab and Truth & Beauty. The goal of the project is to investigate the seasonal patterns in food searches. Using data from 12 years of weekly Google Trends, the creators developed a radial “year clock” chart with various segments indicating the search interests of hundred of dishes and ingredients. The results are featured on a website that highlights the ongoing trends in the current month. The website also allows people to dig into the data themselves and explore the seasonality of various food. The project was built using ES2015, webpack, react, Material UI, and d3 v4. I really enjoy this project because it uses something that we need every day, food, to reveal all sorts of cultural and social phenomena. For instance, the clock shows that searches for “gefilte fish” peak around mid-March because it’s a traditional appetizer for Passover. It’s even more interesting because it explores how the seasonality of food varies across the world. Another aspect that I admire about “The Rhythm of Food” is the visual design. Moritz Stefaner mentioned that he wanted to find “unique, intriguing, expressive and elegant visual devices to bring out the most interesting aspects of the data.” This was accomplished very successfully through the intricate designs of the clock and the cohesive color scheme.

Animation showing how the clock works

LO: Randomness

Blue Literal, Tyler Hobbs

This project, by Tyler Hobbs, is a generative piece that uses a custom algorithm to generate this distinct visual “painting.” I admire it firstly because it’s simply beautiful and mesmerizing to look at. Also, the artists’ website says that he strives to create work that strikes a balance between “the cold, hard structures that computers excel at, and the messy, organizing chaos we observe in the natural world around us.” Likewise, this piece in particular is obviously a digital artwork, but also looks strikingly like waves of an ocean or like some organic surface with hills, valleys, shadows, twists and turns– making it neither completely inorganic or organic, neither completely machine nor natural. I wasn’t able to find much information on the exact random algorithms, but with the specification of the piece having 16 iterations, it seems that the algorithm makes this “Blue Literal” image randomly, just with the bounds and specifications of Hobbs’ code, so that every time, it creates this image of these small, short lines of different shades of blue traveling in different but slowly changing directions, with the shades of blue also changing in relation to the lines around it, creating this gradient/wave effect. Again, the specificity of the aesthetic with the combination of a random generation makes it both distinctly computer-generated and simultaneously distinctly Hobbs’ art.

Project 06: Abstract Clock

sketchDownload
// Jiyeon Chun
// Section C
// jiyeonch@andrew.cmu.edu 
// Project-06-A

var glowsize = 200; //sec
var waxDrip; //min
var candleHeight = 180; //hour

function setup() {
    createCanvas(300, 480);
}

function draw() {
    background(136, 39, 39);

    //get current time
    var H = hour();
    var M = minute();
    var S = second();

//second to glow toggle
    if (S%2 == 0) {
        glowSize = 180;
    } else {
        glowSize = 200;
    }

//hour to candle height
    candleHeight = 180+(H*5);

//minute to wax drip
    waxDrip = candleHeight+30+M;

//glow
    noStroke();
    fill(255, 176, 0,50);
    ellipse(150,candleHeight-40,glowSize);
    
//candle
    noStroke();
    fill(198, 187, 141);
    rect(120,candleHeight,60,220);

//background
    noStroke();
    fill(136, 39, 39);
    rect(0,400,300,220);

//dish
    noStroke();
    fill(151, 127, 33);
    quad(80,390,100,430,200,430,220,390);

//dish handle
    strokeWeight(8);
    stroke(151, 127, 33);
    fill(136, 39, 39);
    ellipse(232,400,40);

//flame
    noStroke();
    fill(255, 176, 0);
    ellipse(150,candleHeight-40,40,50);
    triangle(131,candleHeight-48,150,candleHeight-95,169,candleHeight-48);

//wax
    strokeWeight(8);
    stroke(237, 229, 195);
    line(120,candleHeight,180,candleHeight);
    line(158,candleHeight,158,waxDrip); //longone
    line(170,candleHeight,170,waxDrip-20); //shortone

//bible verse
fill(241, 240, 217);
    noStroke();
    textSize(12);
    textAlign(CENTER);
    text("MATTHEW 25:13",246,470);
}

Project 06 – Abstract Clock

sketchDownload
// this program draws a 24/hour abacus that keeps track of day and time. 
// each row of the abacus represents a different time-telling parameter:
var rowHeight = [-140, -74, -8, 58, 125];	//  [month, day, hr, min, sec]
var rowColor;
var beadw = 7;			// width of beads 
// arrays will be filled with bead objects:
var monthBeads = [];
var dayBeads = [];
var hrBeads = [];
var minBeads = [];
var secBeads = [];
var resetMonth = [];
var resetDay = [];
var resetHr = [];
var resetMin = [];
var resetSec = [];
var allRows = [monthBeads, dayBeads, hrBeads, minBeads, secBeads];


function setup() {
    createCanvas(480, 480);
    background(220);
    rectMode(CENTER);
    
    rowColor = [color(145, 110, 205), 		// [month
				color(200, 140, 205), 		//  day
				color(145, 140, 255), 		//  hour
				color(145, 185, 215), 		//  minute
				color(145, 200, 130)];		//  second]

	// populate monthBeads array with 12 beads:
	for (i=0; i<12; i++) {							
		monthBeads[i] = {x: beadw*i, y: rowHeight[0]}
		arrayCopy(monthBeads, resetMonth);
	}
	// populate dayBeads array with 31 beads:
	for (i=0; i<31; i++) {								
		dayBeads[i] = {x: beadw*i, y: rowHeight[1]}
		arrayCopy(dayBeads, resetDay);
	}
	// populate hrBeads array with 24 beads:
	for (i=0; i<24; i++) {
		hrBeads[i] = {x: beadw*i, y: rowHeight[2]}
		arrayCopy(hrBeads, resetHr);
	}
	// populate minBeads array with 30 beads:
	for (i=0; i<30; i++) {
		minBeads[i] = {x: beadw*i, y: rowHeight[3]}
		arrayCopy(minBeads, resetMin);
	}
	// populate secBeads array with 30 beads:
	for (i=0; i<30; i++) {
		secBeads[i] = {x: beadw*i, y: rowHeight[4]}
		arrayCopy(secBeads, resetSec);
	}
}

function draw() {
	background(220);
	
	//center canvas
    translate(width/2, height/2);

    // draw frame and rows of abacus
	drawAbacus();
	
	// draw all of the beads using the array for their row:
	for (j=0; j<allRows.length; j++) {
		setBeads(allRows[j]);
	}
	
	// check the time and move the beads accordingly:
	moveBeads(monthBeads, month(), 0, resetMonth);
	moveBeads(dayBeads, day(), 1, resetDay);
	moveBeads(hrBeads, hour(), 2, resetHr);
	moveBeads(minBeads, minute(), 3, resetMin);
	moveBeads(secBeads, second(), 4, resetSec);	
	//noLoop();
}

//Draws the frame of the abacus:
function drawAbacus() {
	fill(80, 55, 30);
	//base:
    quad(-195,190, 195,190, 220,215, -220,215);
    quad(-195,190, 195,190, 200,200, -200,200);	
    quad(-200,200, 200,200, 220,220, -220,220);	
	//left post:
    quad(-190,-200, -185,-210, -192,-210, -199,-200);
    quad(-190,200, -185,190, -185,-210, -190,-200);
    rect(-195, 0, 7, 400);
	//right post:
    quad(190,-200, 185,-210, 192,-210, 199,-200);
    quad(190,200, 185,190, 185,-210, 190,-200);
    rect(195, 0, 7, 400);
    //rows for beads:
    for (i=0; i<rowHeight.length; i++) {
        rect(0, rowHeight[i], 375, 5);
    }
	//labels:
	textSize(16);
	textFont('monospace');
	fill(0);
    text('month', -181, rowHeight[0]+28);
    text('day', -181, rowHeight[1]+28);
    text('hour', -181, rowHeight[2]+28);
    text('minute', -181, rowHeight[3]+28);
    text('second', -181, rowHeight[4]+28);
}


// draws all of the beads into their rows
function setBeads(beadArray) {
    fill(rowColor[j]);				// color taken from for loop in draw function
    strokeWeight(1.5);
	for (i=0; i<beadArray.length; i++) {		
		if (beadArray.length == 31) { ellipse(beadArray[i].x-30, beadArray[i].y, beadw, 30) }
	    else if (beadArray.length == 30) { ellipse(beadArray[i].x-23, beadArray[i].y, beadw, 30) }
	    else if (beadArray.length == 24) { ellipse(beadArray[i].x+19, beadArray[i].y, beadw, 30) }
	    else if (beadArray.length == 12) { ellipse(beadArray[i].x+103, beadArray[i].y, beadw, 30) }        
	}
}

// checks time and moves the corresponding beads:
function moveBeads(row, func, ind, rowReset) {
	var dist;
	if (row.length == 12) {dist = 283 }		//different distances based on number of beads in the row
	if (row.length == 31) {dist = 150 }
	if (row.length == 24) {dist = 199 }
	if (row.length == 30) {dist = 157 }
	for (i=0; i<func; i++) {
		// the minutes and seconds beads will move every 2x they are passed bc it looks better like that:
		if (dist == 157) {
			row[i/2] = {x: beadw*i/2-dist, y: rowHeight[ind]}
		} else {						
		    row[i] = {x: beadw*i-dist, y: rowHeight[ind]}
		}
		// february has 28 days:
		if (func == 28 & row.length == 31 && month()==2) { resetBeads(rowReset, monthBeads) }
		// 30 days has september, april, june, and november:
		if (func == 30 && row.length == 31 && month()==9) { resetBeads(rowReset, monthBeads) }
		if (func == 30 && row.length == 31 && month()==4) { resetBeads(rowReset, monthBeads) }
		if (func == 30 && row.length == 31 && month()==6) { resetBeads(rowReset, monthBeads) }
		if (func == 30 && row.length == 31 && month()==11) { resetBeads(rowReset, monthBeads) }

	}
	// once the time parameter resets to 0, so do the beads:
	if (func == 0) { resetBeads(rowReset, row) }
}
			
// sets the beads back to their original position, by row:
function resetBeads(rowReset, row) {
    arrayCopy(rowReset, row);

}

This project took me way longer than I had hoped, but I am so so pleased with the outcome. After thinking about a few ideas, I decided to make an abacus because I think it would be very helpful for me personally to visualize time in that way. I struggled a lot to get the beads where they are supposed to go, but eventually I figured out how to use the arrayCopy function to my advantage.

initial sketch of the project

Looking Outwards 06: Randomness

The piece I have chosen to write about this week is Zauberflöte by Michael Hansmeyer. Hansmeyer is a computational architect, and the series of structures he designed as Zauberflöte were created as the set for the 2018 production of Mozart’s Magic Flute, directed by Romoeo Castellucci. Using generative design, Hansmeyer was able to explore and play around with countless design possibilities as he created the pieces. I love the grander of the designs, especially in contrast with the extremely simple greyscale color theme that covers the entire stage area. As said by the artist, “the design process strikes a balance between the expected and the unexpected” because although the process is deterministic, the outcome is unknown and impossible to imagine. I have no idea how the algorithm for these pieces work, but the visual result is very reminiscent of other types of computed art due to the symmetry, repetition of patterns, and extremely clean lines.

Zauberflöte, 2018
Michael Hansmeyer

Hansmeyer used generative design to help create the grotto set for Mozart’s opera.

Looking Outwards: Information Visualization

World City-to-City connections

Creator: Chris Harrison

Link: https://www.chrisharrison.net/index.php/Visualizations/InternetMap

This map visualizes the city-to-city Internet connections, which play a huge role in our lives nowadays. For those of us in the US, it seems like we would no longer be able to survive without the Internet. Yet looking at this map helped me realize how millions of people have little to no access to the Internet. Being connected online feels like a guarantee for many of us, and at least for me, this map made me realize that I’ve been taking granted how easy it is to access the Internet, when in reality, access to the Internet would be a life changing resource for the millions of people without access. 

World Connection Density

This project also made me wonder about the quantity of communication between high internet usage countries and low internet usage countries. Due to globalization, the choices that more powerful countries make can drastically affect every single other country in the world. It seems to me that as a resource, the Internet has become so fundamental for so many things that lack of Internet access and infrastructure is a huge disadvantage for many countries and people. 

The map was created with data from the DIIMES Project. It displays a total of 89,344 connections.

European City-to-City Connections

Project 6: Abstract Clock

Going into this project, I first started thinking about my favorite ways to physically tell time. How does my body determine what time it is? I eventually settled on the changing daylight. From there, I decided that I both wanted to create a landscape and didn’t want to directly show the sun or the moon (that feels overdone). In the end, I like the effect that I got with all the different elements in my desert landscape. I think the bird could be a little more accurate to a buzzard and I think it would have been cool if the tumbleweed could have rotated, but I just didn’t have time to complete either of those. Perhaps I’ll go back into my code later and fix them to be the best version I can get them.

sketch

//Elise Chapman
//ejchapma
//ejchapma@andrew.cmu.edu
//Section D

function setup() {
    createCanvas(480,300);
    rectMode(CENTER);
}

function draw() {
    background(200); //background is white
    //draws a buzzard that flies across the screen every minute
    noStroke();
    var dx=430/60;
    var xPos=dx*second(); //x position of the buzzard
    var yPos=50; //y position of the buzzard
    fill(75);
    ellipse(xPos,yPos,25,15);
    ellipse(xPos+15,yPos,15);
    triangle(xPos+20,yPos-5,xPos+20,yPos+5,xPos+30,yPos);
    //the buzzard will move its wings every second
    if (second()%2==0) {
        triangle(xPos-10,yPos-3,xPos+10,yPos-3,xPos,yPos-20);
    } else {
        triangle(xPos-10,yPos+3,xPos+10,yPos+3,xPos,yPos+20);
    }
    landscape(0,0);
    tumbleweed(0,0);
    sky(0,0);
}

//draws the tumbleweed, that will eventually move
function weed(x,y) {
    push();
    translate(x,y);
    stroke(241,208,160); //beige
    strokeWeight(5);
    line(-15,-20,25,10);
    line(-15,20,20,-15);
    line(-25,0,25,-10);
    line(0,-25,0,25);
    line(-20,10,20,15);
    line(10,20,15,-20);
    line(-10,20,-15,-20);
    line(-20,-10,5,-15);
    pop();
}

//makes the weed tumble, moving every minute
function tumbleweed(x,y) {
    var xPos=0; //x position of tumbleweed
    var yPos=(height/3)+140; //y position of tumbleweed
    var dx=width/60; //how much the tumbleweed moves by
    weed(xPos+(dx * minute()),yPos);
}

//draws the main background
function landscape(x,y) {
    push();
    translate(width/2,height/2);
    noStroke();
    //background plateau
    fill(249,160,63); //orange sand color
    rect(width/4,height/4,100,height,30,30);
    rect(width/4+50,height/3,50,height,30,30);
    rect(width/4+100,height/2.25,100,height);
    rect(width/4-25,height/2.5,100,height,30,30);
    rect(width/4-75,height/1.75,100,height,30,30);
    //even further background plateu
    fill(255,193,100); //lightened orange sand color
    rect(-width/4-50,height/3,75,height,30,30);
    rect(-width/4-10,height/2.25,75,height,30,30);
    rect(-width/4-100,height/1.75,50,height,30,30);
    //foreground
    fill(212,122,19); //red sand color
    rect(0,height/3,width,height/3);
    //cactus
    fill(122,132,80); //green
    rect(-width/5+10,0,30,200,30,30,30,30);
    rect(-width/5+40,0,80,30,30,30,30,30);
    rect(-width/5+65,-20,30,60,30,30,30,30);
    rect(-width/5-20,-40,50,30,30,30,30,30);
    rect(-width/5-35,-70,30,85,30,30,30,30);
    pop();
}

//changes the color of the sky (and ambiance) every hour
function sky(x,y) {
    noStroke();
    if (hour()==0) {
        fill(18,27,103,150);
    } else if (hour()==1) {
        fill(67, 49, 82,150);
    } else if (hour()==2) {
        fill(107, 66, 65,150);
    } else if (hour()==3) {
        fill(146, 84, 48,150);
    } else if (hour()==4) {
        fill(176, 97, 35,150);
    } else if (hour()==5) {
        fill(216, 115, 18,120);
    } else if (hour()==6) {
        fill(255, 132, 1,120);
    } else if (hour()==7) {
        fill(208, 147, 48,90);
    } else if (hour()==8) {
        fill(170, 159, 86,90);
    } else if (hour()==9) {
        fill(113, 177, 142,60);
    } else if (hour()==10) {
        fill(57, 195, 199,60);
    } else if (hour()==11) {
        fill(0, 212, 255,60);
    } else if (hour()==12) {
        fill(23, 186, 235,60);
    } else if (hour()==13) {
        fill(46, 159, 215,60);
    } else if (hour()==14) {
        fill(92, 106, 175,60);
    } else if (hour()==15) {
        fill(115, 80, 155,60);
    } else if (hour()==16) {
        fill(138, 53, 135,60);
    } else if (hour()==17) {
        fill(161, 27, 115,90);
    } else if (hour()==18) {
        fill(183, 0, 95,120);
    } else if (hour()==19) {
        fill(136, 8, 97,120);
    } else if (hour()==20) {
        fill(113, 12, 98,120);
    } else if (hour()==21) {
        fill(89, 16, 99,150);
    } else if (hour()==22) {
        fill(50, 22, 101,150);
    } else if (hour()==23) {
        fill(8, 17, 94,150);
    }
    rect(width/2,height/2,width,height);
}

LO: Randomness

An example of in-game terrain generation from a forest biome to a mountain biome

As a part of my quarantine boredom, I have picked up the game Minecraft again in a serious way, and a good deal of my time in Minecraft is simply spent wandering around the game’s randomly generated terrain. Minecraft has over 60 different types of terrain, each including their own terms of generation (i.e.: a snowy tundra will look very different from a fringe jungle biome). The only uniform constraint is the height limit, y=256, and bedrock y=0. I admire the sheer variety of terrains in Minecraft, and how much work goes into creating them. They are all instantly recognizable and yet always unique. Before 15-104, I had never considered the effects of randomness on terrain, but now I can see just how deep it goes. The caves underneath are random, as is the surface land, the nether connected to the overworld, the generated structures, the ores, the trees, the mobs… the list goes on. I think that that’s the beauty of Minecraft: it is an entirely different experience every time, due to the randomness deeply embedded in the game.

Minecraft (released Nov.18, 2011)
https://www.minecraft.net/en-us