Project-06: Abstract Clock

sketchDownload

//Catherine Liu
//Section D
//jianingl@andrew.cmu.edu
//Assignment-06-Project

//an abstract clock where the objects move according to seconds, minutes, and hours

var xPos = []; //array for x position of clouds
var yPos = []; //array for y position of clouds

function setup() {
    createCanvas(480, 400);
    //creates random positions for 60 clouds
    for (i = 0; i < 60; i++) {  
        xPos[i] = random(0,480);
        yPos[i] = random(0,150)
    }
}

function draw() {
    background(155,212,255);
    fill(0,0,102);
    rect(0,height/2, width, height/2);
    //draws a number of clouds according to the current second
    for (i = 0; i <= second(); i++) { 
        clouds(xPos[i], yPos[i]);
    }
    push();
    sunMoon(-150, 0); //calls function that draws the rotating sun and moon
    pop();
    //aliens move closer to each other according to minutes
    print(minute().toString())
    rightAlien(480 - 8 * minute(), height/2); //calls function that draws right alien
    leftAlien(0 + 8 * minute(), height/2); //calls function that draws left alien
}

function rightAlien (x, y) { //draws right alien
    stroke(0,102,51);
    strokeWeight(5);
    //arm waves up and down according to seconds using mod 
    if (second() % 2 == 0) {
        line(x-40, y-60, x-13,y-30); //left arm
    } else if (second() % 2 != 0) {
        line(x-45, y-50, x-13,y-30); //left arm
    }
    line(x+13, y-30, x+30, y-15); //right arm
    line(x, y-50, x, y-30); //neck
    stroke(204, 255, 153);
    line(x-10, y, x-10, height); //left leg
    line(x+10, y, x+10, height); // right leg
    stroke(0,102,51);
    line(x-17, y-70, x-7, y-50); //antennae
    line(x+17, y-70, x+7, y-50); //antennae
    noStroke();
    fill(204, 255, 153);
    ellipse(x, y-50, 30,20); //head
    rect(x-15, y-35, 30,120,10); //body
    fill(0,102,51)
    //eyes look back when the aliens pass each other halfway
    if (minute() < 31) {
        circle(x-10, y-51, 5); // left eye
        circle(x-3, y-51, 5); // right eye
    } else if (minute() >= 31) {
        circle(x+10, y-51, 5); // left eye
        circle(x+3, y-51, 5); // right eye
    }
}

function leftAlien(x, y) { //draws left alien
    stroke(0,102,51);
    strokeWeight(5);
    //arm waves up and down according to seconds using mod 
    if (second() % 2 != 0) {
        line(x+40, y-60, x+13,y-30); //left arm
    } else if (second() % 2 == 0) {
        line(x+45, y-50, x+13,y-30); //left arm
    }
    line(x-13, y-30, x-30, y-15); //left arm
    line(x, y-50, x, y-30); //neck
    stroke(204, 255, 153);
    line(x-10, y, x-10, height); //left leg
    line(x+10, y, x+10, height); //right leg
    stroke(0,102,51);
    line(x-17, y-70, x-7, y-50); //left antennae
    line(x+17, y-70, x+7, y-50); //right antennae
    noStroke();
    fill(204, 255, 153);
    ellipse(x, y-50, 30,20); //left man's head
    rect(x-15, y-35, 30,120,10); //left man's body
    fill(0,102,51)
    //eyes look back when the aliens pass each other halfway
    if (minute() < 31) {
        circle(x+10, y-51, 5); // left eye
        circle(x+3, y-51, 5); // right eye
    } else if (minute() >= 31) {
        circle(x-10, y-51, 5); // left eye
        circle(x-3, y-51, 5); // right eye
    }
}

function sunMoon (x, y) { //sun and moon rotates according to hour, from 0-12 it is sun, from 12-23 it is moon
    translate(width/2, height/2);
    var dx = 30 * hour(); 
    rotate (radians(dx));
    if (hour() > 12 & hour() <=23) {
        fill(255, 243, 176);
        arc(x, y, 100, 100, 0, PI + QUARTER_PI, PIE); //moon
        ellipse(x + 30, y - 30, 5, 10);
        ellipse(x - 30, y + 70, 5, 10);
    } else if (hour() >= 0 & hour() <= 12) {
        fill(255, 128, 0);
        ellipse(x, y, 100, 100); //sun
    }
}

function clouds(x, y) { //draws a cloud at position x, y
    fill(233, 254, 255);
    rect(x, y, 20, 10,30); //cloud
}


I started off this project by sketching a rough idea of what I wanted to make, which was two people playing badminton, with the shuttlecock moving from one end to the next in minutes. The sun and moon would then rotate according to the hour.

original sketch

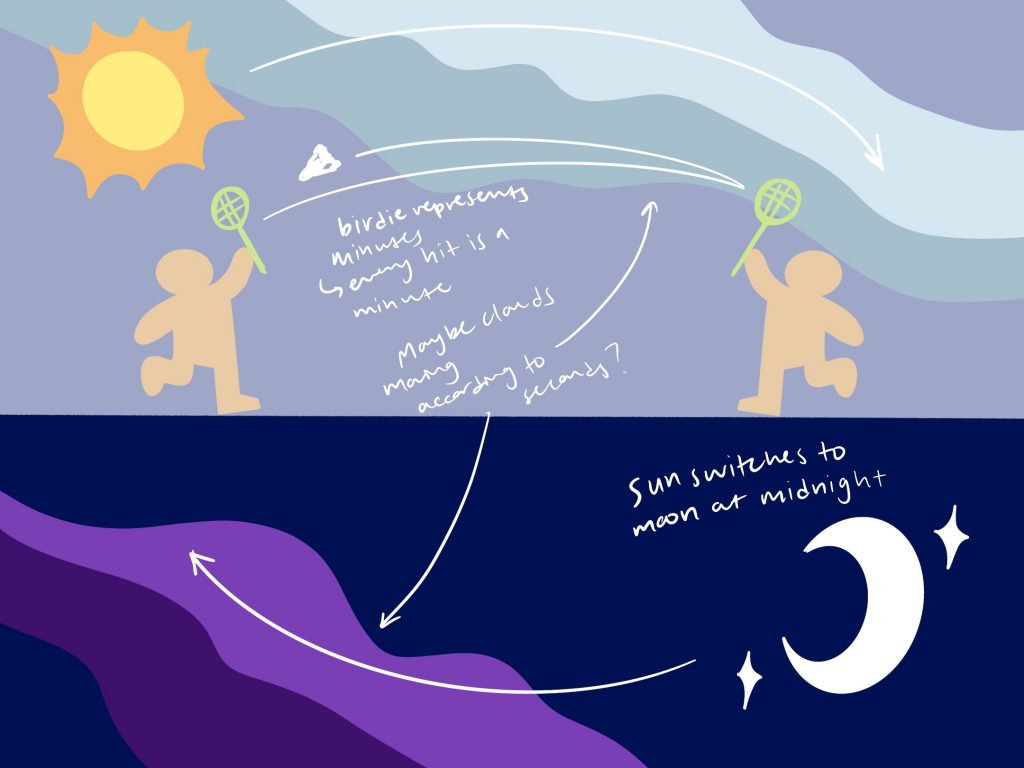
However, I came across some coding problems so I changed my idea slightly. Now, they are aliens that can only move with every minute. As they move closer to each other, they are waving and their eyes follow each other. While I kept the sun and moon concept the same, I changed the background clouds to increase numbers according to seconds.

Project 06 – Abstract Clock

sketch
function setup() {
    createCanvas(400, 400);
    angleMode(DEGREES);
}

function draw() {
    background(0); //black
    translate(200,200);

    let hr = hour();
    let min = minute();
    let sec = second();

    strokeWeight(10);
    stroke(244,195,195); // pink outline
    noFill();

    let end1 = map(sec, 0, 60, 0, 360); //seconds
    arc(0,0,300,300,0,end1); 

    push();
    rotate(end1); //rotate following the seconds
    stroke(255,0,0);
    line(0,0,100,0); //big clock line RED
    pop();

    stroke(137,207,240); // blue outline
    let end2 = map(min, 0, 60, 0, 360); //minutes
    arc(0,0,280,280,0,end2); 

    push();
    rotate(end2); //rotate following the minutes
    stroke(255);
    line(0,0,100,0); //big clock line WHITE
    pop();

    stroke(157,193,131); //green outline
    let end3 = map(hr,0,24,0,360); //hour
    arc(0,0,260,260,0,end3);

    push();
    rotate(end3); //rotate following the hour
    stroke(255);
    line(0,0,50,0); //small clock line WHITE
    pop();


//let end = map(mouseX, 0, width, 0, 360);
//arc(200,200,300,300,0,360); 
//strokeWeight(6);
//stroke(255); // white
//noFill();
//ellipse(200,200,300,300);


    //fill(255);
   // noStroke();
   // text
}

Project 6: Abstract Clock

Download

// Yash Mittal
// Section D

var r1; // road 1
var r2; // road 2
var r3; // road 3
var secondscarwidth;
var minutecarwidth;
var hourcarwidth;

function setup() {
    createCanvas(480, 480);
    background (200);
}

function road1 (r1) {

    noStroke();

    fill (50);

    rect (0, (height / 2 - 30), width, (height / 2 - 160)); // road 1

    fill (250);

    rect (40, (height / 2 + 3), 50, 10);  // white stripe 1

    rect (150, (height / 2 + 3), 50, 10); // white stripe 2

    rect (260, (height / 2 + 3), 50, 10); // white stripe 3

    rect (370, (height / 2 + 3), 50, 10); // white stripe 4

    fill ("yellow");

    rect (0, (height / 2 - 30), width, 5); // yellow stripe 1

    rect (0, (height / 2 + 45), width, 5); // yellow stripe 2

}
    
function road2 (r2) {

    fill (50);

    rect (0, (height / 2 + 140), width, (height / 2 - 160)); // road 1

    fill (250);

    rect (40, (height / 2 + 173), 50, 10);  // white stripe 1

    rect (150, (height / 2 + 173), 50, 10); // white stripe 2

    rect (260, (height / 2 + 173), 50, 10); // white stripe 3

    rect (370, (height / 2 + 173), 50, 10); // white stripe 4

    fill ("yellow");

    rect (0, (height / 2 + 140), width, 5); // yellow stripe 1

    rect (0, (height / 2 + 215), width, 5); // yellow stripe 2

}

function road3 (r3) {

    fill (50);

    rect (0, (height / 2 - 200), width, (height / 2 - 160)); // road 1

    fill (250);

    rect (40, (height / 2 - 167), 50, 10);  // white stripe 1

    rect (150, (height / 2 - 167), 50, 10); // white stripe 2

    rect (260, (height / 2 - 167), 50, 10); // white stripe 3

    rect (370, (height / 2 - 167), 50, 10); // white stripe 4

    fill ("yellow");

    rect (0, (height / 2 - 200), width, 5); // yellow stripe 1

    rect (0, (height / 2 - 125), width, 5); // yellow stripe 2
}

function draw() { 

    background (10);

    var sc = second(); // seconds
    var mt = minute(); // minutes
    var hr = hour(); // hours

    road1 (r1);
    road2 (r2);
    road3 (r3);

    var secondscarwidth = map (sc, 0, 59, -5, width - 3); // variable for seconds
    var minutecarwidth = map (mt, 0, 59, -5, width - 3); // variable for minutes
    var hourcarwidth = map (hr, 0, 23, -5, width - 3); // variable for hours


    // car 1 - seconds car

    fill (150, 0, 0);
    rect (secondscarwidth, 60, 70, 40); // base of car
    fill (100, 0, 0);
    triangle (secondscarwidth + 35, 80, secondscarwidth + 70, 60, secondscarwidth + 70, 100); // window highlight
    fill (250, 0, 0);
    rect (secondscarwidth + 18, 70, 35, 20); // roof of car
    fill (255, 255, 0);
    rect (secondscarwidth + 70, 65, 2, 10); // headlight 1
    rect (secondscarwidth + 70, 85, 2, 10); // headlight 2
    fill (200, 0, 0);
    rect (secondscarwidth + 50, 57, 10, 3); // side mirror 1 
    rect (secondscarwidth + 50, 100, 10, 3); // side mirror 2
    

    // car 2 - minutes car

    fill (173, 216, 230);
    rect (minutecarwidth, 230, 70, 40); // base of car
    fill (30, 144, 255);
    triangle (minutecarwidth + 35, 250, minutecarwidth + 70, 230, minutecarwidth + 70, 270); // window highlight 
    fill (70, 130, 180);
    rect (minutecarwidth + 18, 240, 35, 20); // roof of car
    fill (255, 255, 0);
    rect (minutecarwidth + 70, 235, 2, 10); // headlight 1
    rect (minutecarwidth + 70, 255, 2, 10); // headlight 2 
    fill (135, 206, 255);
    rect (minutecarwidth + 50, 227, 10, 3); // side mirror 1
    rect (minutecarwidth + 50, 270, 10, 3); // side mirror 2

    // car 3 - hours car

    fill (0, 255, 127);
    rect (hourcarwidth, 400, 70, 40); // base of car
    fill (150, 205, 50); 
    triangle (hourcarwidth + 35, 420, hourcarwidth + 70, 400, hourcarwidth + 70, 440); // window highlight
    fill (0, 165, 0);
    rect (hourcarwidth + 18, 410, 35, 20); // roof of car
    fill (255, 255, 0);
    rect (hourcarwidth + 70, 405, 2, 10); // headlight 1
    rect (hourcarwidth + 70, 425, 2, 10); // headlight 2 
    fill (152, 251, 152);
    rect (hourcarwidth + 50, 397, 10, 3); // side mirror 1
    rect (hourcarwidth + 50, 440, 10, 3); // side mirror 2

    }

I wanted to keep my idea simple yet creative so I decided to make three roads with each car assigned to seconds, minutes, and hours respectively. The concept is very basic but I am happy with how the execution turned out because I was afraid that the car wouldn’t actually represent a car but I think it turned out well.

LO-6

Hello! For this weeks looking outward I wrote on John Cage’s Fontana Mix. Fontana Mix is a musical composition Cage composed based on dictation from randomly generated drawings. The sheet music is a combination of traditional sheet music and transparencies with randomly generated points, grids, and lines. Stacking these transparencies allows the player to create an image that can be algorithmically turned into a piece of playable music. This is done by noting the intersections between the lines and the grid, and connecting points in and out of the grid. These intersections are associated with instructions telling the player how to play the piece. The outcome is note only an uneasy and fascinating piece of music, but a beautiful image associated with the music. The viewer will have a hard time relating the image to what they hear, but both share the property of being seemingly random while simultaneously beautiful and reasonable.

Abstract Clock

sketch
var time = 0;
var pupil = 400;

function setup() {
    createCanvas(600, 600);
    background(182, 217, 214);
}

function draw() {
    fill(200, 200, 0);
    ellipse(300, 300, 600, 400);
    fill(0, 0, 0);
    if(time <= 720) pupil -= 0.4;
    else pupil += 0.4;
    ellipse(300, 300, pupil, 400);
    time++;
    time%=1440;

}

This clock is inspired by this image, which claims that a cat’s eyes will change during the day. Although not all that practical, I think it’s a super cool idea.

Aren't Ordinary People Adorable? — My heart is crying so hard at this pls i  need a...

LO: Randomness

For this weeks blog, I chose to analyze Bogdan Soban’s artwork, which is generated through random generative processes. Each art pieces, although follows a similar workflow, look very unique and different compared to each other. His overall art style can be seen as a common theme in all his work but the way he depicts this theme is differed by elements like color palette and level of abstraction. Soban uses complex mathematical formulas to develop these highly abstract and complicated pieces. He also uses a programming language called Visual Basic for most of his abstract work and then uses a random number generator to calculate the seed start time for the generative process. On his website, you can see some of the programs he has used to create these art pieces.

Link to his website – http://www.soban-art.com/index-ang.asp

Example of Soban’s generative art

Randomness

This map of the US was created by Jasper Johns, and my grandmother has a version of it on her wall. Since I see it whenever I come to visit, I immediately thought of it for this week’s LO assignment. The randomness of the work comes from how the states’ borders are not clearly defined and paint is all over the place. Johns found a way to use 3 different colors together by blending them but also contrasting them. I admire the chaos of this piece, and wonder if there is any underlying message about the US. Although not particularly useful as a map, this is an incredibly cool painting.

Jasper Johns – Map – 1961

https://www.moma.org/collection/works/79372

Project 6 – Clock

This work is inspired by “A Million Times”, though it tells time in a very different way. I created an array of small, one-arm clocks to tell seconds, minutes, and hours, based on their columns and rows. This effectively creates a vector field that tells time with its coefficients. While each time in the day looks distinct and often disjointed, the array becomes spontaneously synchronized every now and again and blurs the viewer’s ability to tell the time. I understand if you don’t want to put this on your wrist but I hope you enjoy it on your computer screen for a little bit 🙂

sketch
var d = 18;

function setup() {
    createCanvas(480, 240);
    background(240);
}

function drawClock(x,y,theta) {
    push();
    translate(x,y);
    stroke(220);
    strokeWeight(1);
    circle(0, 0, 40);
    stroke(0);
    strokeWeight(2);
    line(0, 0, d*cos(radians(theta)), d*sin(radians(theta)));
    pop();
}

function draw() {
    for (var j = 0; j < 6; j++) {
        for (var i = 0; i < 4; i++) {
            sMap = map(second(), 0, 59, 0, 360);
            drawClock(40*i+20, 40*j+20, sMap+10*i-10*j);
        }
        for (var i = 0; i < 4; i++) {
            push();
            translate(160,0);
            mMap = map(minute(), 0, 59, 0, 360);
            drawClock(40*i+20, 40*j+20, mMap+10*i-10*j);
            pop();
        }
        for (var i = 0; i < 4; i++) {
            push();
            translate(320,0);
            hMap = map(hour(), 0, 59, 0, 360);
            drawClock(40*i+20, 40*j+20, hMap+10*i-10*j);
            pop();
        }
    }

}

LO 06: Random Computational Art

While looking for examples of random art on google, something that came up was “Scott Pakin’s Random Art Generator.” In this webpage, the user is able to toggle a few settings in order to create a randomly generated image. They have the ability to adjust the canvas size, the complexity, the color model, and whether they equalize color or not. By adjusting these, the computer then generates a unique image of random color, lines, and shapes. The outcome of the graphics mostly stick to being a similar style, as seen below, but they do change with the inputs you give them. I admire that the engineer of this website is able to create an algorithm that can produce these unique images. I think the algorithm they use is similar to the one that we use in class where colors are generated within a specific random set and so are graphics/canvas size.

Name: Scott Pakin’s Random Art Generator
Link: https://www.pakin.org/random-art/

Project 06: Abstract Clock

sketch

I found this project a little challenging, but I do like what I was able to make in the end! There were elements that I was really hoping to add, like an inverted color for the background and lines between the morning and afternoon, but my hours function was not working so I wasn’t able to include that aspect. But I mainly wanted to create a clock that created a full picture with the end of a day. The circles on the right count the minutes and sections and the lines on the right create a grid that has lines added each hour.

//Jacky Lococo
//jlococo
//Section C
function setup() {
    createCanvas(370, 600);
}

function draw() {
    background(0);
    var sec = second() // variable ofr the seconds
    var min = minute() // variable for minutes
    var h = hour()
    var strokeLine = 255 // varible for stroke (ended up not working)

    //white lines that divide seconds, minutes, hours
    strokeWeight(1)
    stroke(strokeLine)
    line(330, 0, 330, 600)

    strokeWeight(1)
    stroke(strokeLine)
    line(290, 0, 290, 600)

    //y value for the seconds cirlces
    for (var y = 10; y <= 10*(sec); y += 10) {
        strokeWeight(0)
        fill(255, 204, 204)
        ellipse(350, y, 10, 10);
    }
    //y value for the minutes since x is the same for each added cirlce
    for(var ym = 10; ym <= 10*(min); ym +=10){
        strokeWeight(0)
        fill(255, 102, 102)
        ellipse(310, ym, 10, 10)
    }

    //hour-horizontal and verticle lines will be drawn with each hour to create a grid
    //y value change for the hours - horizontal visualization
    for(var yh = 25; yh <= 25*(h); yh += 25){
        strokeWeight(1)
        stroke(strokeLine)
        line(0, yh, 290, yh)
    } 
    //x valye for the change in hour - verticle depiction 
    for(var xh = 290/24; xh <= (290/24)*(h); xh += 290/24){
        strokeWeight(1)
        stroke(strokeLine)
        line(xh, 0, xh, 600)
    }

    //red cirlces that follow the hour lines
    strokeWeight(0)
    fill(255, 51, 51)
    ellipse(275, yh - 25, 10, 10)

    strokeWeight(0)
    fill(255, 51, 51)
    ellipse(xh-290/24, 580, 10, 10)


}