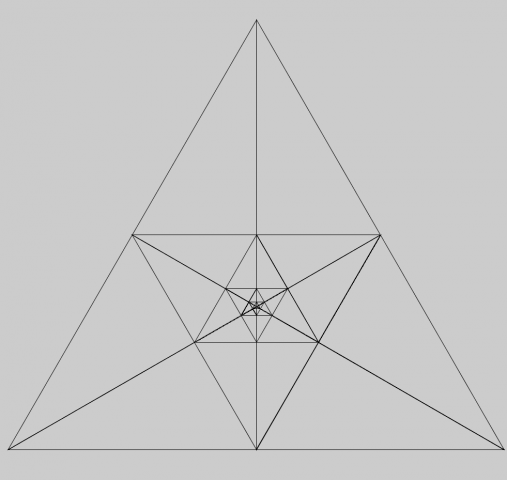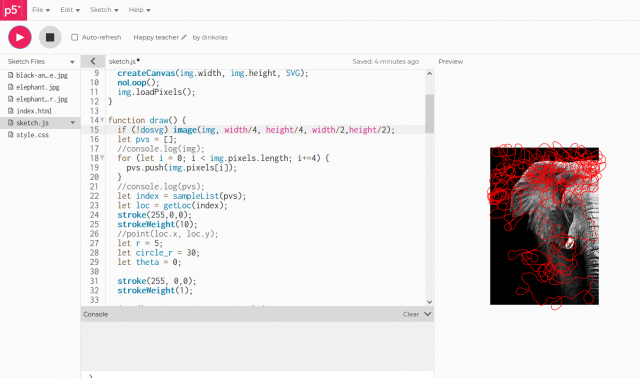
I wanted to try to do a random walk weighted to walk through an image. The line mostly retains its velocity from step to step, but slightly steers towards bright areas. To be honest, it’s not much different from a pure random walk, and I had hoped to have the walks resemble to images much more. I intend to work more on it to improve the results…
const dosvg = false;
let img;

function preload() {
  img = loadImage('elephant.jpg');
}

function setup() {
  createCanvas(img.width, img.height, SVG);
  noLoop();
  img.loadPixels();
}

function draw() {
  if (!dosvg) image(img, width/4, height/4, width/2,height/2);
  let pvs = [];
  //console.log(img);
  for (let i = 0; i < img.pixels.length; i+=4) {
    pvs.push(img.pixels[i]);
  }
  //console.log(pvs);
  let index = sampleList(pvs);
  let loc = getLoc(index);
  stroke(255,0,0);
  strokeWeight(10);
  //point(loc.x, loc.y);
  let r = 5;
  let circle_r = 30;
  let theta = 0;

  stroke(255, 0,0);
  strokeWeight(1);

  for (let i = 0; i < 5000; i++) { let circle = getCircle(loc, theta, circle_r); let weighted = weightList(circle, t => t /*4*(t-0.5)**2*/);
    let circleIndex = sampleList(weighted);
    //let circleIndex = maxIndex(weighted);
    let targetTheta = theta + map(circleIndex, 0, circle.length, 0, 2*PI);


    let diff = ((targetTheta - theta) % TWO_PI + TWO_PI) % TWO_PI;
    if (diff > PI) diff -= TWO_PI;
    theta = (theta + 0.2*diff) % TWO_PI;
    let newLoc = {x: loc.x + r * Math.cos(theta), y: loc.y + r * Math.sin(theta)};
    line(map(loc.x, 0, width, width*0.25, width*0.75),
         map(loc.y, 0, height, height*0.25, height*0.75),
         map(newLoc.x, 0, width, width*0.25, width*0.75),
         map(newLoc.y, 0, height, height*0.25, height*0.75));
    loc = newLoc;
  }
}

function maxIndex(l) {
  let m = -Infinity;
  let id = 0;
  for (let i = 0; i < l.length; i++) { if (l[i] > m) {
      m = l[i];
      id = i;
    }
  }
  return id;
}

function weightList(l, f) {
  let w = [];
  for (let i = 0; i < l.length; i++) {
    let t = map(i, 0, l.length - 1, 0, 1);
    w.push(l[i] * f(t));
  }
  return w;
}

function getCircle(loc, theta, r) {
  let vs = [];
  for (let i = 0; i < 32; i++) { let angle = theta + map(i, 0, 32, 0, 2*PI); let l = {x: loc.x + r * Math.cos(angle), y: loc.y + r * Math.sin(angle)}; let index = getIndex(l); if (index === -1) { vs.push(0); } else { vs.push(1 - (img.pixels[index] / 255.0)); } } return vs; } function getLoc(i) { return {x: i % img.width, y: Math.floor(i / img.width)}; } function getIndex(loc) { if (loc.x >= img.width || loc.y >= img.height ||
     loc.x < 0 || loc.y < 0) return -1;
  return Math.floor(loc.x) + img.width * Math.floor(loc.y);
}

function keyPressed() {
  saveSVG("dingus.svg");
}

function sampleList(l) {
  let v = l[0];
  if (v < 0) console.log('negative!!!');
  let cumsum = [v];
  let sum = v;
  for (let i = 1; i < l.length; i++) {
    let v = l[i];
    if (v < 0) console.log('negative!!!');
    sum += v;
    cumsum.push(sum);
  }
  let t = sum * Math.random();
  //TODO: binary search
  for (let i = 0; i < cumsum.length; i++) { if (cumsum[i] >= t) return i;
  }
  console.log('shouldnt hapen');
  return cumsum.length - 1;
}
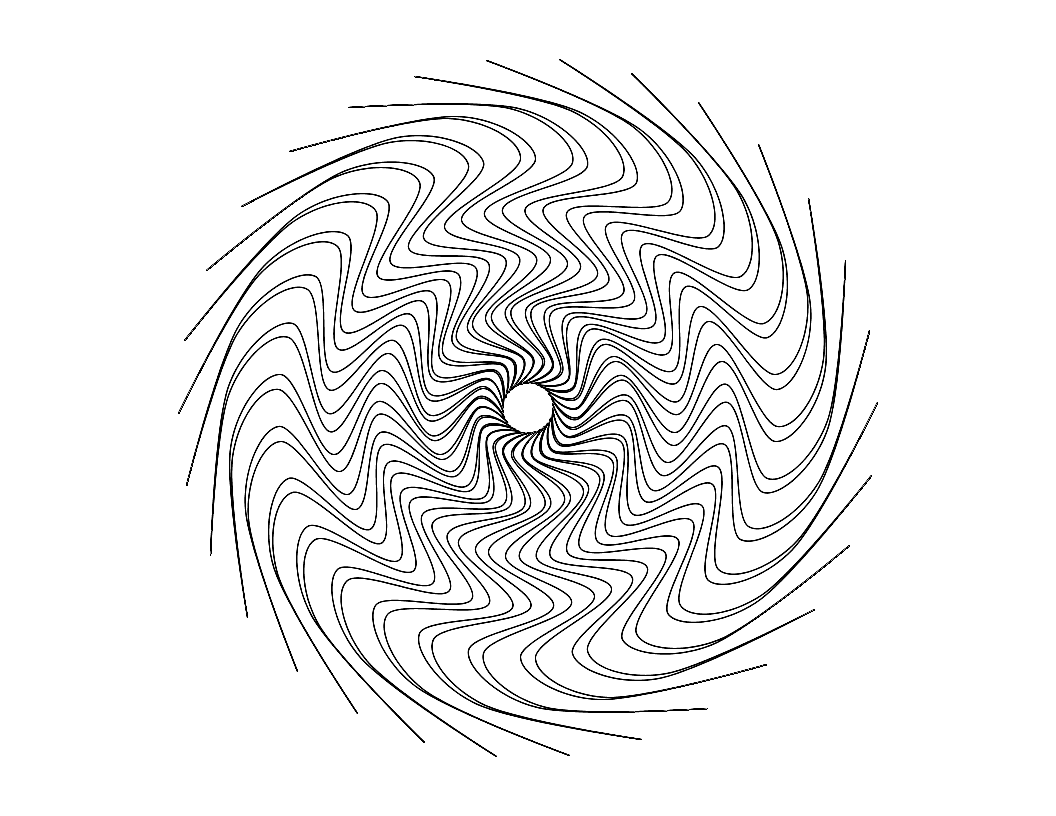
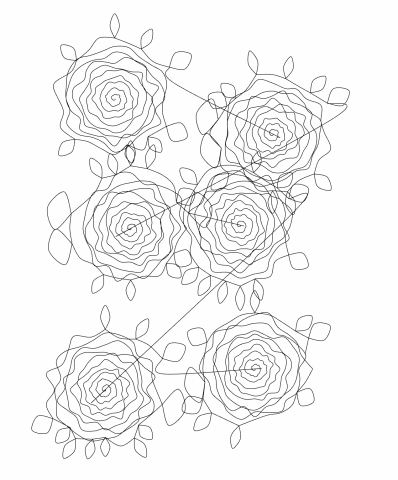
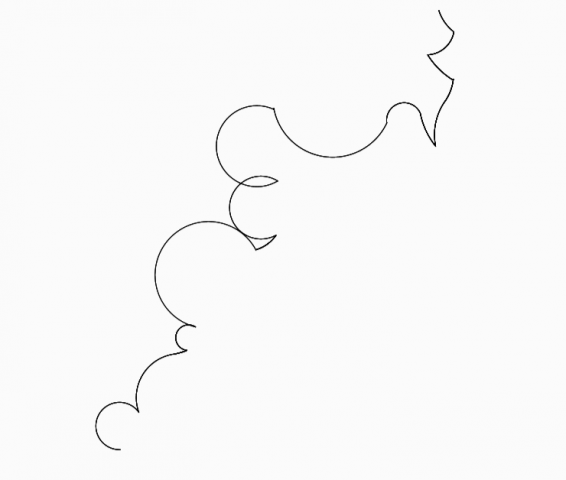
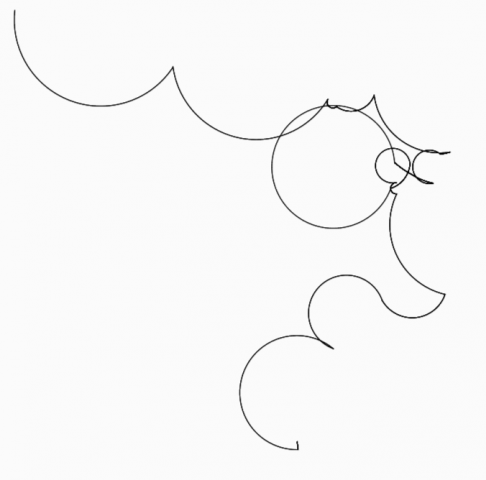
I was interested in creating a line that expresses a human-like scribble that has the stroke appearance of a 0.5mm ball point pen. I messed around with sine and cosine functions that ended up creating anelliptical, vortex-like, scribble that has a direction that varies with noise, where a new drawing is constantly generated (hitting the spacebar starts and stops the generating of new drawings)