String Art Week 4

sketch

function setup() {
	createCanvas(640,480);
}
var endPoint = 304;
function draw() {
  background(0);
  for (var i = -100; i <= 300; i += 3){
      if (mouseIsPressed){
        stroke(76);
        // left inner curves displayed on mouse press
        line(i, height/2, width/2.1, height/2.5 + i);
        line(i, height/2, width/2.1, height/1.55 - i);
      }
      stroke(76);
      //left outer lines
      line(i, height/2, endPoint, height);
      stroke(220);
      line(i, height/2, endPoint, 0);
  }
  for (var i = 700; i >= 300; i -= 3){
      stroke(232);
      //right inner curves
      line(i, height/2, width/2.1, -height/1.55+i);
      line(i, height/2, width/2.1, height*1.65-i);
      stroke(13);
      //right outer lines
      line(i, height/2, endPoint, height);
      line(i, height/2, endPoint, 0);
  }
}
//fun function
function mouseIsPressed() {
    console.log(5);
    for (var i = -100; i <= 300; i += 3){

    }

}

I drew 4 curves first to represent the inner diamond shaped figure. I then encased it with other iterated lines and added a fun function to change the shape on mouse click.

edit: The picture wasn’t meant to fit within the dimensions given

Janet Lee- Looking Outwards – 04

The project that I got inspired this week was the Mesa Musical Shadows at Daily tous les jours studio. I was admired by this because just by using your own shadow you could make a sound and depending on the length of the shadow can determine the dynamics of the sound. The algorithm that they used were 6 control nodes that could run 47 sensors and also comprised of an Arduino Mega, ethernet shields and custom connector shields.They also managed to install a speaker underground which was weatherproof. Their artistic sensibility is that they used shadows, light, and technology to create music.

Playin’ the Pavement – Daily tous les jours’ Mesa Musical Shadows


Jiyoung Ahn_04_Looking Outwards

Ryoji Ikeda/ Data Matrix / 2010

Ryoji Ikeda is one of my favorite artists, and he is a really well-known micro sound musician, and currently lives in New york. Because of his installations, he is now also well-known as an artist.

Micro sound fields were commonly referred as ‘white noise’ and they are used as a therapy. Ikeda uses sine wave in order to present mathmatical patterns and pure electronic sounds.

His album [+/-] is one of the most famous albums, and it was sensational because he got rid off melody, and expressed music using low frequency sound.

He made his installation work very interactively, so that people actually feel like that they are merged with the art piece, and screens with motion attracts and collaborates with the mysterious sound really well.

Data Matrix w/o motion graphic

Janet Lee- Project 04- String Art

sketch

function setup() {
    createCanvas(640,480);

}

function draw() {
    background ("#EDE4E3");
    //lightblue curve
    for (var i = 1; i <640; i+=10){
        stroke ("#A0E0E3");
        strokeWeight (2);
        line (i,70,width-70,i);
      }
      //red curve
    for (var a = 1; a<640; a+=7){
        stroke("#FD7950");
        strokeWeight(1);
        line(a,height-60,50,a);
      }
      //yellow curve
    for (var b = 1; b <640; b+=9) {
        stroke("#FCE6A9");
        strokeWeight(3);
        line(b,height-20,30,b);
    }
    //turquoise curve
    for (var c = 1; c <640; c +=3) {
      stroke("#41909E");
      strokeWeight(1);
      line (c,20,width-10,c);
    }
    //flower spinning
    push();
    translate(width/2,height/2);
    rotate(millis()/1000);
    push();
    fill("#215A6D");
    noStroke();
    rotate (radians(30));
    ellipse (0,0,20,100);
    noStroke();
    rotate (radians(30));
    ellipse (0,0,20,100);
    noStroke();
    rotate (radians(30));
    ellipse (0,0,20,100);
    noStroke();
    rotate (radians(30));
    ellipse (0,0,20,100);
    noStroke();
    rotate (radians(30));
    ellipse (0,0,20,100);
    noStroke();
    rotate (radians(30));
    ellipse (0,0,20,100);
    pop();
    pop();
}

Jess Medenbach-Looking Outwards 4

Earthworks is a multimedia installation by the artists Ruth Jarman and Joe Gerhardt, using the natural sounds of the earth to create computer generated visuals to go along with it.

For the festival Sonarplanta, the artists put the 5 channel video installation inside of a huge round vaulted space that encompasses the viewer.

The artists take seismic data from the earth’s tectonic movements and then use that data to create sounds. It becomes an almost timelapse of the earth moving. They then use those sounds to generate psychedelic visuals that encompass the viewer.

What I think is inspiring about this piece is that they took something they were interested in, the tectonic movements of the earth and then turned that into numbers, they then took the numbers and turned that into moving data that then influenced sounds that then trigger visuals…or create a whole new slew of data. I think this kind of process is really inspiring, and the breakdown and buildup of information to create a piece of art is really interesting! It puts visuals to something that you know about but you don’t necessarily get to see or hear and brings your awareness to this whole other process that is constantly happening around you.

aee2dec2ca66954c910d5aaaad443667

Christine Kim – Project-04

sketch

//Christine Kim
//Section A (9:00)
//haewannk@andrew.cmu.edu
//Project-04

var x;
var y;

function setup() {
    createCanvas(640, 480);
    strokeWeight(1);
    x=0;
    y=0;
}

function draw()  {
    background('lightblue');
    for (var i = 0; i < 240; i +=10) {

    	//pink color lines
    	stroke('hotpink');
        line (width/2,y+i,width/2+i,height/2); //upper right
        line(width/2,y+i,width/2-i,height/2); //upper left
        line(width/2,height-i,width/2-i,height/2); //lower left
        line(width/2,height-i,width/2+i,height/2); //lower right
        line(0,height/2,width,height/2); //horizontal line
    
        //lavender color lines
    	stroke('lavender');
    	push();
    	translate(264,-156);
    	rotate(radians(45));
    	line (width/2,y+i,width/2+i,height/2); //right
        line(width/2,y+i,width/2-i,height/2); //top
        line(width/2,height-i,width/2-i,height/2); //left
        line(width/2,height-i,width/2+i,height/2); //bottom
        pop();
        line(80,0,560,height); //negative slope
        line(80,height,560,0); //positive slope 

        //outer lines
        stroke('lightyellow');
        line(x,y+i,x+i,height); //left from top
        line(x+i,height,width,height-i); //bottom from left
        line(width,height-i,width-i,y); //right from bottom
        line(width-i,y,x,y+i); //top from right
        line(x,height-i,x+i,y); //left from bottom
        line(x+i,y,width,y+i); //top from left
        line(width,y+i,width-i,height); //right from top
        line(width-i,height,x,height-i); //bottom from right
        }
}

My process was to get midpoints of canvas and connect the line to different points. And then I added more lines to the edges of the canvas.

photo-on-9-23-16-at-5-50-pm

Jiyoung Ahn _ String Art

sketch


var num = 250;
var aS;//angle of the shape 
var increment; //increase of spacing
var radi; //radius
var radS; //spiral shape
var xI; //x increment
var yI; //y increment
var col1; //first color
var col2; //second color
var moX; //mouse
var moY; //mouse


function setup() {
    createCanvas(640, 480);
    radi = (width/2)-40;
    increment = 5;
    background('lightgreen');
    col1 = color('yellow');
    col2 = color('lightpink');
    
}

function draw() {
	noStroke();
	ellipse(0,400,260,260);
	fill('white');

	ellipse(560,0,220,220);
	fill('white');

	ellipse(210,120,180,180);
	fill('white');

	ellipse(490,500,320,320);
	fill('white');
	
   if(mouseX != moX) {
      var xI = width/2
       var yI = height /2
       for (var i = 1; i < num; i++){
          aS = i * increment;
          mult = i/num;
          radS = mult * radi;

          x = width/2 + cos(aS) * radS;
          y = height/2 + sin(aS) *radS;

          stroke(lerpColor(col2, col1, mult));
          strokeWeight(0.5);
          line(xI, yI, x,y);
          xI = x;
          yI = y;
       }   
      
       for (var i = 1; i < num; i++){
          aS = i * increment;
          mult = i/num;
          radS = mult * radi;

          x = width/2 + cos(aS) * radS;
          y = height/2 + sin(aS) *radS;

          stroke(lerpColor(col2, col1, mult));
          strokeWeight(0.03);
          line(xI+80, yI+80, x+80,y+80);
          xI = x;
          yI = y;
		 }
		for (var i = 1; i < num; i++){
          aS = i * increment;
          mult = i/num;
          radS = mult * radi;

          x = width/2 + cos(aS) * radS;
          y = height/2 + sin(aS) *radS;

          stroke(lerpColor(col2, col1, mult));
          strokeWeight(0.03);
          line(xI-80, yI-80, x-80,y-80);
          xI = x;
          yI = y;
		 }

   } 
}


I tried to create string art based on a pentagon shape, and I added white ellipse shapes as a background pattern.

James Katungyi-Project 04

6 petal flower

james-stringart

//James Katungyi
//Section A 0900
//jkatungy@andrew.cmu.edu
//Assignment-Project-04

//variables for first set of lines for 6 different petals
//first point x&y values are the same for all 6 petals
var x1=y1=x11=y11=x21=y21=x31=y31=x41=y41=x51=y51=0;
//second point x values are the same for all 6 petals
var x2=x12=x22=x32=x42=x52=180;
//second point y values are the same for all 6 petals
var y2=y12=y22=y32=y42=y52=54;
//variables for second set of lines
//first point x&y values are the same for all 6 petals
var x3=y3=x13=y13=x23=y23=x33=y33=x43=y43=x53=y53=0;
//second point x values are the same for all 6 petals
var x4=x14=x24=x34=x44=x54=54;
//second point y values are the same for all 6 petals
var y4=y14=y24=y34=y44=y54=180;
//spacing
var spacing=18;

function setup() {
  createCanvas(480, 640);
  background(0);
  strokeWeight(1);
  r = color(255,0,0);
  g = color(0,255,0);
  b = color(0,0,255);
  rg = lerpColor(r,g,0.5);
  gb = lerpColor(g,b,0.5);
  br = lerpColor(b,r,0.5);
  push();
  translate(width/2,height/2);//locate lower tip of petal in canvas center
  //first petal
  rotate(radians(45));
  stroke(r);
  for (i=0;i<8;i++){
    line(x1,y1,x2,y2);//set of lines defines first half of petal
    x1=x1+spacing;
    y2=y2+spacing;
    line(x3,y3,x4,y4);//second set of lines defines second half of petal
    y3=y3+spacing;
    x4=x4+spacing;
    line(0,0,180,180);//middle line
  }
  //second petal
  rotate(radians(60));
  stroke(rg);
  for (i=0;i<8;i++){
    line(x11,y11,x12,y12);//first half of petal
    x11=x11+spacing;
    y12=y12+spacing;
    line(x13,y13,x14,y14);//second half of petal
    y13=y13+spacing;
    x14=x14+spacing;
    line(0,0,180,180);//middle line
  }
  //third petal
  rotate(radians(60));
  stroke(g);
  for (i=0;i<8;i++){
    line(x21,y21,x22,y22);//first half of petal
    x21=x21+spacing;
    y22=y22+spacing;
    line(x23,y23,x24,y24);//second half of petal
    y23=y23+spacing;
    x24=x24+spacing;
    line(0,0,180,180);//middle line
  }
  //fourth petal
  rotate(radians(60));
  stroke(gb);
  for (i=0;i<8;i++){
    line(x31,y31,x32,y32);//first half of petal
    x31=x31+spacing;
    y32=y32+spacing;
    line(x33,y33,x34,y34);//second half of petal
    y33=y33+spacing;
    x34=x34+spacing;
    line(0,0,180,180);//middle line
  }
  //fifth petal
  rotate(radians(60));
  stroke(b);
  for (i=0;i<8;i++){
    line(x41,y41,x42,y42);//first half of petal
    x41=x41+spacing;
    y42=y42+spacing;
    line(x43,y43,x44,y44);//second half of petal
    y43=y43+spacing;
    x44=x44+spacing;
    line(0,0,180,180);//middle line
  }
  //sixth petal
  rotate(radians(60));
  stroke(br);
  for (i=0;i<8;i++){
    line(x51,y51,x52,y52);//first half of petal
    x51=x51+spacing;
    y52=y52+spacing;
    line(x53,y53,x54,y54);//second half of petal
    y53=y53+spacing;
    x54=x54+spacing;
    line(0,0,180,180);//middle line
  }
  pop();
}

A 6 petal flower recreated from online string art patterns.
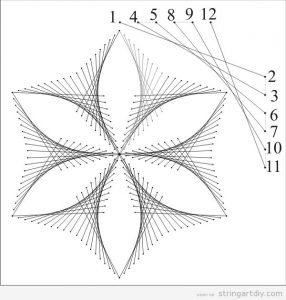
stringartdiy


Jess Medenbach – String Drawing

assignment-05

//Jessica Medenbach
//jmmedenb@andrew.cmu.edu
//Section C (1:30PM)


function setup() {
    createCanvas(640,480);
}

function draw() {
  background(240,0,0);
  for (var i = 20; i < 480; i += 5){

  //curve1
  stroke(255);
  strokeWeight(1);
  line( i + 100, 400, i / 20,QUARTER_PI*i);
  //curve2
  stroke(240,240,0);
  line( i - 150, 150, i ,QUARTER_PI*i);
  //curve3
  stroke(240,0,220);
  strokeWeight(3);
  //curve4
  line( i+150, i, i ,QUARTER_PI);
  stroke(100,200,220);
  //curve5
  line(height-i+200, i, i ,QUARTER_PI*i);
  stroke(50,50,150);
  //horn
  fill(255,240,0);
  ellipse(i+100, height/2, i/20, QUARTER_PI*i);

  }
}


Experimenting with different curves and colors, using both lines and ellipse with quarter_pi.

Simin Li- Looking Outwards 4

Fantasy-Impromptu, by Frederic Chopin, accompanied by a graphical score by Stephen Malinowski

The animated graphical score project known as the Music Animation Machine was created by Stephen Malinowski in 1974 and is still an ongoing project. The composer and programmer was overwhelmed by reading the score of a Brandenburg concerto and wanted to display complex music in a way that listeners of all levels could easily follow. He decided to use animation to visualize musical pieces by writing a program on an Atari using BASIC. The result was a video that synchronized with music using movement, shape and color. He explains that the notes we hear most recently are most vivid and the notes we hear a while ago seem to fade away, so he uses solid shapes to represent present notes and hallow shapes to represent faded notes. He also uses different shapes for different types of instruments that interact together. In 2012, his software could generate animation in a live performance. He now uses frame-rendering software that inputs a MIDI file (software unknown). A music appreciation teacher has used his work to teach students to grasp convoluted pieces and the results have been significant. What I admire most about this project is that it conveys music visually through one program. The animation Malinowski makes reminds me of dance. The programming that he does is actually choreography: he pays attention to the position and movement of different elements while following a certain rhythm and theme. This makes me wonder whether a single algorithm can be used to generate dance and other visual art.

Links

THE DAILY BEAST This Amazing Machine Lets You ‘Paint’ Mozart’s Music by Nick Romeo

Dazed and Confused, full interview with Stephen Malinowski

Stephen Malinowski and the Music Animation Machine

Stephen Malinowski on youtube

Check out his performance at TEDxZurich.