Project 7 Lydia Jin

sketch

//Lydia Jin
//Section B
// jialuj@andrew.cmu.edu
// Project 7
var nPoints = 100;
function setup() {
    createCanvas(600, 600);
}

function draw() {
	background('black');

	//print title
	fill('white');
	text("Astroid", 20, 20);

	//color changes over mouse interactions
	var r = map(mouseX, 0, 600, 0, 255);
	var rr = map(mouseY, 0, 600, 0, 255);

	push();
	stroke(r, rr, r);
	strokeWeight(4);
	translate(width/2, height/2);
	var x;
	var y;
	//get b from mouse X coodinate
	var b = map(mouseX, 0, width, 5, 35);
	var ph = mouseY/45;
	fill(rr, rr, r);
	beginShape();

	//draw the Astroid
	for (var i =0; i < nPoints; i++){
		var t = map(i, 0, nPoints, 0, TWO_PI);
		x = 3 * b * cos(t) + b * cos(3 * t);
		y = 3 * b * sin(t) - b * sin(ph + 3 * t);
		vertex(x, y);
	}
	endShape(CLOSE);

	pop();
}

capture1

capture2

capture3

astroid

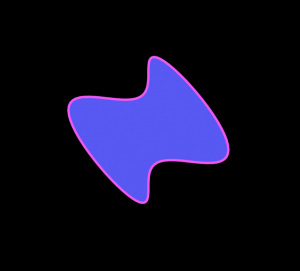
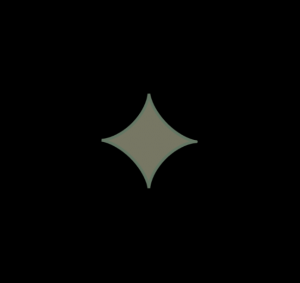
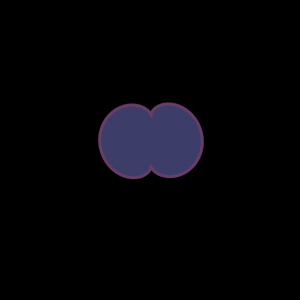
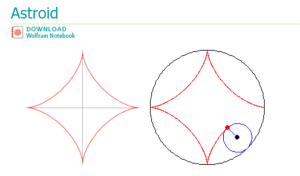
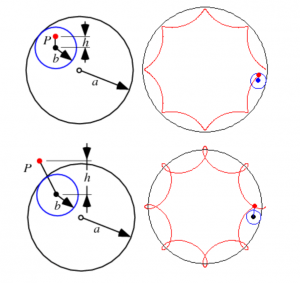
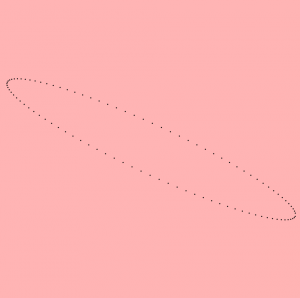
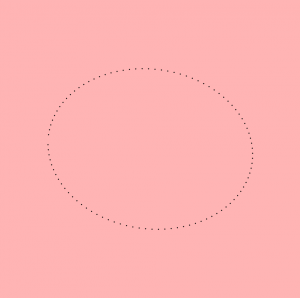
I came up with this idea by looking at the list of curves on the math website. I really like the looks of the astroid as it looks like a star. Then I did some changes to it so sometimes it looks round and other times pointy. I also wanted the colors to change and now the design sort of looks like changing microorganisms. The shapes are also enclosed by different colored strokes to make the images appear more visually appealing.The user can move the mouse to see the changing shapes.

mreyes-project 07

sketch

//Mercedes Reys

//Section C 

//mreyes@andrew.cmu.edu

//project-06-a

var nPoints = 3000; // points in outer cricel drawing curve 

function setup() {
    frameRate(.0001)
    createCanvas(600, 600);
    frameRate(10);// slow down fram rate 
}


function draw() {
    background(255,200,200);

    drawEpitrochoid();//top curve
    push();
    translate(width / 2, height / 2);
    drawEpitrochoid();//middle curve 
    translate(width / 2, height / 2);// bottom cuve 
    drawEpitrochoid();
    pop();
}


function drawEpitrochoid() {
    noStroke()

    //variables 
    var x;
    var y;

    //noise
    var randomness = (mouseX/40)+1; // level of noise is depenant on mouseX
    var randomShift = random(0, randomness); 
     
    var a = 200.0; // diamater of original cirlce
    var b = a /3.0 + randomness/nPoints;// diamater of circles added to original circle
    var h = constrain(randomShift/ .3, 0, b);// grow when mouse is moved to the right
    var ph = randomShift/30.0; // devide by random to reduce jerky-ness of movement

    fill(200, 255, 200,150);
    beginShape();
    for (var i = 0; i < nPoints; i++) {
        var t = map(i, 0, nPoints*random(-randomness, randomness), 0, TWO_PI);// map out nPoints to cirlce and a
        
        //calculate vertex 
        x = (a + b) * cos(t) - h * cos(ph + t * (a + b) / b);
        y = (a + b) * sin(t) - h * sin(ph + t * (a + b) / b);
        vertex(x, y);
    }
    endShape(CLOSE);

    push();
    
}

The epitrochoid curve was the only curve I could manage to understand how to make, so I started off by recreating the curve made in the example. I then wanted to make the curve grow in an more organic way. So I created a noise variable and applied that to the constraint. It wasn’t vary dynamic at that point so I experimented with adding the noise to diffrent variables and this was the result.


Liu Xiangqi-Project-07

The project I tried to create is made up of eight curves and parabola. The parameter a (the scale of the eight curves) and b (the scale of the parabolas) is controlled by the x coordinates of the mouse. The number and the rotation degree is controlled by the y coordinates of the mouse. When a user moves the mouse, he/she can expect a procedure of flower blossom or a comet with its long tail. I was intended to create a kaleidoscope through the intertwine and changes of different curves.
sketch


function  setup() {
  createCanvas(600, 600);
}
 
function draw(){
  background(200, 200, 255);
  //keep the size of the eight curve in a reasonable size
  var x = min(mouseX, width);
  //like the parameter to mouseX
  var a = map(x, 0, width, 0, 200);
  var b = map(mouseX, 0, width, 0, 400);
  //link the rotation to mouseY
  var deg = map(mouseY, 0, height, 0, 360);
  noFill();
  stroke(255);
  push();
  translate(width/2, height/2);
  for (var j = 0; j < deg; j += 3600/deg){
    rotate(720/deg);
    beginShape();
    curveVertex(0, 0);
    //draw the complete eight curve
    for (var i = -10; i < 10; i += 0.1){
         var x = a*sin(i);
         var y = a*sin(i)*cos(i);
         curveVertex(x, y);
    }
    curveVertex(0, 0);
    endShape();
    
    beginShape();
    curveVertex(0, 0);
    //draw the complate parabola curve
    for (var i = -10; i < 10; i += 0.1){
         var x = b*sq(i);
         var y = 2*b*i;
         curveVertex(x, y);
    }
    curveVertex(0, 0);
    endShape();
  }
  pop();
  

}

Sofia Syjuco – Project-07

sketch

// Sofia Syjuco
// Section A
// smsyjuco@andrew.cmu.edu
// assignment-07-c

var nPoints = 100; // number of vertices

function setup(){
  createCanvas(400,400); // create a canvas of 400 x 400
  
}

function draw(){
  background(230); // fill background with off-white
  noStroke(); // don't draw the stroke lines

  push();// keep translate info within here
  translate(width/2, height/2); // move to the middle of the screen
  drawCardioid(); // draw the shape
  pop(); // end of translate information section
}

function drawCardioid(){
  //http://mathworld.wolfram.com/Cardioid.html

  var x; // create a variable for x coord
  var y; // create a varaiable for y coord

  // fill with colors dependant on mouse position
  fill(abs(mouseX) % 256, abs(mouseY) % 256, abs(mouseX + mouseY) % 256, 100);

  var a = 80; // size of the shape 

  var mX = constrain(mouseX, 0, width) / 100.0; // variable for using mouseX position
  var mY = constrain(mouseY, 0, height) / 100.0; // variable for using mouseY position

  beginShape(); // begin drawing the shape
  for (var i = 0; i < nPoints; i++){ // draw as many vertices as nPoints states
    var t = map(i, 0, nPoints, 0, TWO_PI); // parameter for function that varies with i

    x = a * (cos(t + mX) * (1-(cos(t + mX)))); // finding the x for the vertex
    y = a * (sin(t + mY) * (1-(cos(t + mY)))); // finding the y for the vertex

    vertex(x,y);// draw a vertex at these points
  }
  endShape(CLOSE); // close the shape
}

To create this shape, I looked through the curve website for an interesting curve, and used it in my code. I played around with seeing what I could effect with mouseX and mouseY, placing them in different areas to experiment and seeing exactly how the shape would change each time. I found this project a really interesting challenge, as we haven’t worked with equations like this before. It was difficult to try and understand just how to implement this in our code, and I found the examples particularly helpful to establish the base of the code- before playing around with different values to make it unique.

Shannon Case Project 07 – Curves

sketch

//Shannon Case
//Section D
//scase@andrew.cmu.edu
//assignment 07-A

var nPoints = 100;
//var valE = 2.718; // This is the value of # 'e'

function setup() {
    createCanvas(400, 400);
    frameRate(10);
}


function draw() {
   
    
    // draw the frame
    fill((mouseY/height)*100,(mouseY/height)*200,(mouseY/height)*255);
    rect(0, 0, width-1, height-1); 
    
    // draw the curve
    push();
    translate(width / 2, height / 2);
        drawEllipseEvoluteCurve();

    pop();

}

function drawEllipseEvoluteCurve() {
    // Ellipse Evolute
    // http://mathworld.wolfram.com/EllipseEvolute.html
    
    var x;
    var y;

    var a = constrain((mouseX / width), 0.1, 0.5);
    var b = constrain((mouseY / height), 0.1, 0.5);
    
    fill((mouseX/width)*255,(mouseX/width)*100,(mouseX/width)*255);
    strokeWeight(5);
    stroke((mouseX/width)*200,(mouseX/width)*55,(mouseX/width)*255);
    beginShape();
    for(var i = 0; i < nPoints; i++) {
        var t = map(i, 0, nPoints, 0, TWO_PI);

        x = ((Math.pow(a+(mouseX/45), 2) - Math.pow(b, 2)) / a * (Math.pow(cos(t), 3)));
        y = ((Math.pow(b+(mouseY/48), 2) - Math.pow(a, 2)) / b * (Math.pow(sin(t), 3)));
        vertex(x, y);

    }
            endShape(CLOSE);

}


For this project I really struggled with choosing a curve that worked. I chose a bunch that weren’t really able to move well with both the x and y values, but eventually decided on the Ellipse Evolute because it was more easily able to stretch and shrink with my mouseX and mouseY. I chose to have the background color evolve with the mouseY values and the color of the shape change with the mouseX values.

Alison Hoffman – Project 7

Project 7-ach

//Alison Hoffman
//Section D
//achoffma@andrew.cmu.edu
//Project 7 - Curves 

var points = 1000; // number of points 
function setup() {
    createCanvas(420,420);
}

function draw() {
    background(7,26,85);
    push();   // medium curve
    translate(75,75);
    rotate(radians(230));
    drawCurve(85,4,200);
    pop();
    push();
    translate(width/6*5,height/3*2); // lightest
    rotate(radians(90));
    drawCurve(100,2,100);
    pop();
    push();
    translate(width/2,height/2-15); //thicker curve
    rotate(radians(65));
    drawCurve(30,8,60);
    drawCurve(45,8,60);
    pop();
}


function drawCurve(h,w,c) { //takes parameters, h (height variant), w(stroke Weight), and c (value of Green)
    var a = constrain(mouseY/5,0,height); // constrains a to mouseY
    var b = constrain(mouseX/15,0,width); // constrains mouseX to b
    var h = h; // variant degree of curve
    var x;
    var y;
    stroke(mouseX,c,mouseY); // color of stroke depends on input and mouse postions
    strokeWeight(w);
    //
    beginShape();
    noFill();
    for(var i = 0; i < points; i++){
        var t = map(i,0,points,0,TWO_PI); // maps theta to the size of the circle
        x = ((a+b)*cos(t))-(h*cos(((a+b)/b)*t)); // I reversed the signs of the orginal formula in order to invert the curve
        y = ((a+b)*sin(t))-(h*sin(((a+b)/b)*t)); // reversed signs to invert the curve
        curveVertex(-x,-y);
    }
    endShape();
}

This project was really intimidating at first, but once I found a curve that I thought I could replicate it became easier to understand the math behind it. I chose to create a Epicycloid (pictured below). However, I didn’t really like how it created a flower like curve, so I inverted the signs of the formula (- to + and + to -) in order to have the ‘petals’ point inward. I also made the color of the curve depend on the position of the mouse and an input parameter. I chose to do multiple curves to show how the shape changed with varying stroke weight. Overall, once I got started and playing around, I actually ended up really enjoying this project.

screen-shot-2016-10-14-at-9-01-50-pm

sihand – Project Week 07 – Crystallize

Crystallize

I really enjoyed playing around with the equations and variables. During the course of my experimentation, I discovered a few cool effects combining different curves, but they all looked too chaotic. In the end, I chose this one, which is more simple and resembles an interesting crystallizing effect. It consists of an array of spiky shapes, which are modifications of a deltoid equation, that accumulate as the mouse moves across the canvas.

Sihan – crystallize

//Sihan Dong
//sihand@andrew.cmu.edu
//Section B
//Project Week 07: curves

var nPoints = 30;

function setup() {
    createCanvas(600, 400);
}

function draw() {
	background(255, map(mouseX, 0, width, 0, 200), map(mouseY, 0, height, 0, 200));
	stroke(255);
    noFill();
    drawDA();
}

function drawDA() {
	translate(width/2, height/2);
	var x = [];//array of spiky curves
	var y = [];
	var xa;//variables of circular curve
	var ya;
	
//only draw curves when mouse is within canvas
	if (mouseX < width & mouseY < height) {

    beginShape();
    for (var i = 0; i < nPoints; i++) {
        var t = map(i, 0, nPoints, 0, TWO_PI);
        for(var j = 0; j < min(mouseX/50, width); j++) {
        	var a = map(mouseX, 0, width, 0, 150);
			var d = map(mouseY, 0, width, 5, 8*j);
		//spiky curve
        	x[j] = j*d*cos(t) + j*cos(j*t);
        	y[j] = j*d*sin(t) - j*sin(j*t);
    	//circular curve    
        	xa = a*cos(t);
        	ya = a*sin(t);

        	vertex(xa, ya);
        	vertex(x[j], y[j]);
    	}
    }
    endShape();
    print(d);
    print(mouseY);
	}
}


Sarita Chen – Project 7 – Curves

sketch

var nPoints = 100; //Points in the ellipses

function setup() {
    createCanvas(500, 500);
    frameRate(10);
    
}

function draw() {

	background(0);
	push();
	translate(width/2,height/2);
	rotate(radians(mouseX));
	myCircle();
	pop();
}	

function myCircle() {

	var a = 300; // radius
	var b = a/2; // half of radius 1
	var c = 125; // radius 2
	var d = c/2; // half of radius 2
	var h = constrain(mouseX /10,0,a); // distance
	var w = constrain(mouseY/10,0,b);
	var x; //Hypotrochoid
	var y; //Hypotrochoid
	var u; // Hypotrochoid 2
	var v; //Hypotrochoid 2
	

	beginShape();
	

	for (var i = 0; i < nPoints; i++) {  
		var theta = map(i,0,nPoints,0, TWO_PI); // Makes the outline of the shape small circles
		ellipse(x, y, 1,1);
		x = (a - b ) * cos(theta) + h * cos( (a - b)/ b * theta); // Formula for hypotrochoid
		y = (a - b) * sin(theta) - h * sin( (a - b)/ b * theta); // Formula for hypotrochoid

		fill(255);
		noStroke();
		ellipse(u, v, 2,2);
		u = (c - d ) * cos(theta) + w * cos( (c - d)/ d * theta); // Formula for hypotrochoid
		v = (c - d) * sin(theta) - w * sin( (c - d)/ d * theta); // Formula for hypotrochoid
		
		
	}
	endShape(CLOSE);	

}

I had some trouble figuring out just exactly what I was supposed to do with the equations at first. I really hate math, so just looking at it in the beginning was throwing me off. It’s based very, very loosely off of this video (the white on black, not the actual mathematical stuff) and this image.

screen-shot-2016-10-14-at-7-02-25-pm   screen-shot-2016-10-14-at-7-02-41-pm

It started off pink and with only one ring, but I decided to change all those aspects.

Project 07 – JamesKatungyi

Project 07 – Composition with curves

jkatungy-project07-curves

//James Katungyi
//Section A 0900
//jkatungy@andrew.cmu.edu
//Assignment-Project-07


var n = 27;
var h = 24;
var a = 120;
var Rad = 500;
var t = 0;

//undulating ground
function Topo(){
    fill(200, 100, 0);
    beginShape();
    vertex(width, height - 60); //first vertex on right canvas edge
    for (var i = 0; i < 100; i++){
        t = map(i, 0, 100, 0, PI);
        var x = 300 + cos (t) * Rad;
        var y = sin (t) * Rad - 200;
        vertex(x,y); //vertices defined by curve
        //println(t);
        //println(i);
    }
    vertex(0, height - 60); //vertex on left canvas edge
    vertex(0, height); // lower left vertex
    vertex(width, height); // lower right vertex
    endShape(CLOSE)
    //println(t);
    //println(i);
}
function Hypocycloid(){
    var b = a / n;
    fill(250, 240, 240); //pink
    beginShape();
    for (var i = 0; i < 4000; i++){
        var t = map(i, 0, 4000, 0, TWO_PI*n);
        var x = (a - b) * cos (t) + h * cos ((a - b) * t / b);
        var y = (a - b) * sin (t) - h * sin ((a - b) * t / b);
        vertex(x, y);
    }
    endShape(CLOSE);
}

function setup(){
    createCanvas(600, 400);
}
function draw(){
    background(200, 225, 250);//blue background
    Topo();//undulating ground function
    //mouseX as for canvas translation position
    var locX = map(mouseX, 0, width, 120, 480);
    //relate y value to x along the circle
    var y = sqrt((Rad * Rad) - (locX - 300) * (locX - 300)) - 200;
    //Angle R for canvas rotation as function of mouseX
    var AngleR = map(mouseX, 0, width, 0, PI);
    push();
    //translate canvas to mouseX position and topo y position
    translate (locX, y - 140);
    //rotate canvas relative to mouseX position
    rotate(AngleR);
    //call wheel - hypocycloid
    Hypocycloid();
    pop();
}

Using a hypocycloid, I made a wheel that rolls across the screen following the mouse but along a path defined by an arc. Working out the control parameters to follow the curved path proved difficult but was eventually resolved using the formula for cartesian coordinates of the points of the circle.

Project-07-CompositionWithCurves

sketch-70

//Victor Tavarez
//Section D
//vtavarez@andrew.cmu.edu
//Project-07-CompositionWithCurves


function setup() {
    createCanvas(500,500);
}

function draw() {
    background(60);
    push();
    translate(width/2, height/2);
    plotMiceProblem();
    pop()

}

function plotMiceProblem(){
    var nPoints = map(mouseY, 0, height, 0 ,1000);
    var x;
    var y;
    var n = map(mouseX, 0, width,0,10); // will be used to draw more itterations

    beginShape();
    //nPoint influenced by y value to give "drawing" effect
    for (var i=0; i < nPoints; i++){ 
        var t = map(i,0,nPoints,0,TWO_PI*n);
        noFill();
        var clrR = map(mouseX, 0, width,100,255); 
        var clrG = map(mouseX, 0, width,200,230);
        var clrB = map(mouseX,0,width,230,255);
        strokeWeight(4);
        stroke(clrR,clrG,clrB); // 
        //equations as listed on mathworld.wolfram.com/ButterflyCurve.html
        x = Math.sin(t) * (Math.pow(Math.E,Math.cos(t))
                        - 2*Math.cos(4*t) 
                        + Math.pow(Math.sin(t/12),5));

        y = Math.cos(t) * (Math.pow(Math.E,Math.cos(t))
                        - 2*Math.cos(4*t) 
                        + Math.pow(Math.sin(t/12),5));

        vertex(x*70,y*50); //wider than tall
    }
    endShape(CLOSE);  
}

For this project, I decided to represent the drawing of a Butterfly curve. To do so, I decided to link the draw function to a the mouseX value to give it the appearance of it ‘drawing’. The most difficult part of this was writing down the x and y equations because it involved Math operators I was unfamiliar with. Once I got the curve to draw, I implemented the changes that the mousex and mouseY would do. MouseX draws and colors the curve. MouseY also draws but smoothens the curve.