Project 07 Curves

This project was a lot of fun to experiment with. I originally planned to make something different, but as I experimented I developed this idea. I used the Scarabaeus Curve and realized it resembled a club from a deck of cards, which differed from my original idea to make it a flower. I had trouble with modifying the curve at first, but it got easier as I worked on it.

sketch

//Rebecca Enright
//Section A
//renright@andrew.cmu.edu
//Curve Composition

function setup() {
    createCanvas(640, 480);   
}

function draw() {
    background(255, 0, 0);    
    //draw club
    push();
    translate(width/2, height/2);
    CreateClub();
    pop();
    
}

function CreateClub() {
    //create variables for a, b, and nPoints
    var a = 50;
    var b = 100;
    var nPoints = 100;
    var pw = constrain((mouseX/50), 0, 10);
    var ph = constrain((mouseY/50), 0, 10);
    //create Scarabaeus curve
    fill(0);
    beginShape();
    for (var i = 0; i < nPoints; i++) {
        var t = map(i, 0, nPoints, 0, TWO_PI);  
        //function for curve      
        var r = b * cos(2 * t) - a * cos(t); 
        
        //create x and y for vertex
        var x = r * cos(pw + t);
        var y = r * sin(ph + t);
        
        vertex(x,y);  
    }
    endShape(CLOSE);
} 


jihoonp_project_07

sketch

//Jihoon Park
//section A
//jihoonp@andrew.cmu.edu
//project-07

var nPoints = 100;
var divider;					//number of points in hypotrochoid

function setup() {
	createCanvas(600,600);
	frameRate(10);
}

function draw() {
	background(0);

	for(var i=0; i<10; i++) {		//loops the Hypotrochoid with 30 pixel space
		var col = map(i, 0, 10, 0, 255); //color map
		stroke(col);
		noFill();				//inner geometry fades
		Hypo(i*30, mouseX/50);		//changes the number of points according to mouse X
	}
}

function Hypo(a, divider) {
	var x;
	var y; 

	var a;									//radius of circumscribed circle
	var b=a/divider;						//radius of inscribed circle
	var h = constrain(mouseY/10, 0, a);		//length of rotating point generator
	var ph = mouseX/50;						//rotation of hypotrochoid
	push();									//moves the origin of hypotrochoid to center
	translate(width/2, height/2);
	beginShape();
	for(var i=0; i<nPoints; i++) {
		var t = map(i, 0, nPoints, 0, TWO_PI);
		x=(a-b)*cos(t) + h*cos(ph+t*(a-b)/b);
		y=(a-b)*sin(t) - h*sin(ph+t*(a-b)/b);
		vertex(x, y);	
	}
	endShape(CLOSE);
	pop();
}

In this project I made a function called Hypo, which is a short term I gave for hypotrochoid. This geometry has 3 variables which are the radius of circumscribed circle, inner orbiting circle and the length of the line which is rotated from the center of orbiting circle. I made all of the variables modifiable according to the x and y position of the mouse, then looped the geometry to form an overlap.
hypotrochoid

Christine Kim – Project-07

sketch

//Christine Kim
//Section A (9:00)
//haewannk@andrew.cmu.edu
//Project-07

var angle;
var X;
var a =300;
var nPoints = 10000;
var g;
var s;

function setup() {
    createCanvas(800,800);
    frameRate(10);
    
}

function draw() {
	background(91,g,221); //background color mapped to give gradient effect as mouse is moved in X directoin
	X=constrain(mouseX,0,width);
	Y=constrain(mouseY,0,height);
	angle = map(X,0,width,0,2*TWO_PI); //remapping the angle to make it move as mouse moves in X direction
	g = map(X,0,width,84,238); //color g mapped for gradient color
	s = map(Y,0,height,1,2); //scale variable mapped to change scale of the curves as mouse is moved in Y direction


	//first Eight Curve
	stroke(255); //color white
	strokeWeight(2);
	push();
	translate(width/2, height/2);
	rotate(angle); //rotating by the mapped angle
	beginShape(LINES); //creating the Eight Curve
	for (var i=0;i<=nPoints; i++) {
		var t= map(i,0,nPoints,0,TWO_PI);
		//Eight Curve formula
		var x2= a*sin(t);
		var y2= a*sin(t)*cos(t);
			vertex(x2,y2);
		}
		endShape(CLOSE);
	pop();

	//second Eight Curve 
	stroke("#ec96a4"); //color light pink
	strokeWeight(2);
	push();
	translate(width/2, height/2);
	scale(s); //scaling by the mapped scale
	rotate(angle+QUARTER_PI);
	beginShape(LINES);
	for (var i=0;i<=nPoints; i++) {
		var t= map(i,0,nPoints,0,TWO_PI);
		var x2= a*sin(t);
		var y2= a*sin(t)*cos(t);
			vertex(x2,y2);
		}
		endShape(CLOSE);
	pop();

	//third Eight Curve
	stroke("#e6df44"); //color mustatd
	push();
	translate(width/2, height/2);
	scale(s);
	rotate(-angle+HALF_PI);
	beginShape(LINES);
	for (var i=0;i<=nPoints; i++) {
		var t= map(i,0,nPoints,0,TWO_PI);
		var x2= a*sin(t);
		var y2= a*sin(t)*cos(t);
			vertex(x2,y2);
		}
		endShape(CLOSE);
	pop();

	//fourth Eight Curve
	stroke("#283655"); //color indigo 
	strokeWeight(2);
	push();
	translate(width/2, height/2);
	rotate(-angle*2);
	beginShape(LINES);
	for (var i=0;i<=nPoints; i++) {
		var t= map(i,0,nPoints,0,TWO_PI);
		var x2= a*sin(t);
		var y2= a*sin(t)*cos(t);
			vertex(x2,y2);
		}
		endShape(CLOSE);
	pop();

	
}

screen-shot-2016-10-14-at-5-22-10-pm

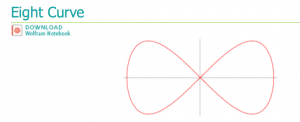
I based my whole project on the Eight Curve and played with color gradient and rotation of the curves.

Grace Cha – Project 07- Curves

myshapes

For this project I worked with the Astroid Radial Curve.  I was really surprised that this function created so many varied curves, and while playing around with it, I had a lot of fun adding values and switching up the boundaries for the equation.

note:  Hover & Click mouse over the Canvas to start *

sketch

//Grace Cha
//Section C
//heajinc
//Project 07: Composition with Curves


var nPoints = 500;// the amount of lines
var boxConstrain = 150; //constrains the small box within an area initially


function setup() {
  createCanvas(500, 500);
  frameRate(15); //make it slow enough to view changes 
  
}

function draw() {
  background(0);

  //call my shape twice
  myShape();

  push();//rotate myShape()
  translate(-30,-350);
  rotate(radians(40));
  myShape();
  pop();
}

function myShape() {
  translate(width/2, height/2);
  stroke(255);
  strokeWeight(.3);//make it thin to visualize the lines better
  noFill();
  //Manipulated to react to mouseX and mouseY location
  var h = constrain(mouseY/10, 0, boxConstrain); //constrain shape 
  var w = constrain(mouseX/10, 0, boxConstrain);//constrain shape 
  
  push();
  beginShape();
  for (var i = 0; i < nPoints; i++) {
    var t = map(i, 0, nPoints, 0,  TWO_PI); 
    
    //Astroid Radial Curve
    //http://mathworld.wolfram.com/AstroidRadialCurve.html
    var x = boxConstrain * pow(cos(t * w),3);
    var y = boxConstrain * pow(sin(t * h),3);
    //stroke(242,183,5)
    stroke("#EEE1EE");
    point(x, y, 10 *i , 10 *i); //adds point at each vertex 
    curveVertex(x , y); //to add curves rather than jagged edges
  }
  endShape();
}
function mousePressed(){
	nPoints = random(5, 360); //number of lines/points 
	boxConstrain = random( 100, 500); //constrains
}

Assignment-07-C Epicycloid Evolute-sehenry

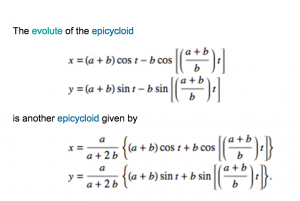
Working on this was a bit tricky, but once I understood the concepts and structure behind making these shapes, it became easier. The hardest part for me was using the equations from the website and implementing it into my code. I had to browse through a few posts of other students to get a rough idea of what to do. From the start I wanted to do an epicycloid evolute because it looked really appealing and looked similar to a flower.

epicycloid-evolute-screenshot

sketch

//Seth Henry

//Tuesdays at 10:30

//sehenry@andrew.cmu.edu

//Assignment: Project 7 Composition with Curves (Epicycloid Evolute)


//Global Variables
var nPoints = 400;
var conX;
var scale;
var n=10


function setup() {
    createCanvas(400, 400);
    }


function draw() {
    background(100,50,mouseX); //changes background color based on the mouse position
    fill(mouseX,100,mouseY); //changes the epicycloid color based on the mouse position
    var a = 150.0 //radius a
    var b = 50.0 //radius b
    var angle = map(conX,0,width,0,6*TWO_PI); //rotate around the constraint (conX)
    conX = constrain(mouseX, 0, width); //constrain around mouseX and mouseY
    scaleA = map(conX,0,width,0,3);
    

    push();
    translate(width/2,height/2);
    rotate(angle); //rotate clockwise
    scale(scaleA,scaleA); //change the size of the epicycloid outer portion
    beginShape();

    //Epicycloid Outer
    for (var i=0; i<200; i++){ 
        var theta = map(i,0,nPoints,0, 4*TWO_PI);
        x=(a/(a+2*b))*(a+b)*cos(theta)+b*cos(((a+b)/b)*theta); //xpetal of epicycloid
        y=(a/(a+2*b))*(a+b)*sin(theta)+b*sin(((a+b)/b)*theta); //ypetal of epicycloid
        rect(x-5,y-5,30,30);
    }
    endShape();
    pop();


    push();
    translate(width/2,height/2);
    rotate(-angle); //rotate the opposite way of the outer epicycloid
    beginShape();
    //No Rotate
    //Epicycloid Inner
    for (var i=0; i<200; i++){
        var theta = map(i,0,nPoints,0, 4*TWO_PI); 
        x=(a/(a+2*b))*(a+b)*cos(theta)+b*cos(((a+b)/b)*theta); //xpetal of epicycloid
        y=(a/(a+2*b))*(a+b)*sin(theta)+b*sin(((a+b)/b)*theta); //ypetal of epicycloid
        rect(x-5,y-5,30,30);
    }
    endShape();
    pop();

    push();
    translate(width/2,height/2);
    rotate(angle); //rotate same direction of epicycloid
   
    beginShape(); //The evolute portion of the flower

        for (var i=0; i<200; i++){
        a=100;
        var theta = map(i,0,nPoints,0, 5*TWO_PI);
        var petalX = a * (((n-1)*cos(theta)+cos((n-1)*theta))/n) //Xpetal of evolute
        var petalY = a * (((n-1)*sin(theta)+sin((n-1)*theta))/n) //ypetal of evolute
       rect(petalX-5,petalY-5,30,30); //draws the inside petals  
}
    endShape();
    pop();


}


Jess Medenbach – Curves

playing with curves and minimalist shapes and colors

jmmedenb-07c

var points = 600;

function setup() {
  createCanvas(600, 400);
  frameRate(30);
  
}

function draw() {
    background(250);

    push();
    translate(width/2, 0);
    drawCurve();
    pop();
}

function drawCurve(){
  //http://mathworld.wolfram.com/Bicorn.html
    var g = map(mouseX, 0, width, 0, width/2);
    var y;
    var a = map(sq(mouseY), 0, height, 0, 1);

    beginShape();
    for (var i = 0; i < points; i++) {
        var t = map(i, 0, points, 0, radians(360))
        x = g * sin(t);
        y = (a * cos(t) * cos(t) * (5 + cos(t))) / (5 + sin(t) * sin(t));

        fill(255);
        ellipse(x,y,mouseY, mouseY);

        fill(255,0,0);
        triangle(x,y,x/300,mouseY,x/2,mouseY*2);

    }
    endShape(CLOSE);
}


Project 7: Curves

sketch

/*Emma Shi
Section B
eyshi@andrew.cmu.edu
Project 7
*/

var nPoints = 100;
var theta = 30.0;
var rcolor = "red";

function setup() {
    createCanvas(400, 400);
    frameRate(10);
}

function draw() {
  background (random(0, 255));
  frameRate(10);

  push();
  for (var i = 0; i < 40; i++) {
    translate (width/2,height/2);
    rotate(radians(theta*mouseX));//rotates "images"
    drawRorschachCurve(i);
  }
  pop();
}


function drawRorschachCurve () {
  var a = map(mouseX, 0, width, 0, 50);
  var b = map(mouseY, 0, height, 0, 50);

  fill(rcolor);
  noStroke();
  beginShape()
  for (var i = 0; i < nPoints; i++ ) {
    var t= map(i, 0, nPoints, 0, TWO_PI);
    x = a*sin(t)*sin(6*t)*sin(t);
    y = b*cos(t)-a*cos(7*t);

    vertex(-x,-y);
  }
  endShape(CLOSE);
  //draws "Rorscharch image"
}

function mousePressed() {
  if (rcolor == "red") {
    rcolor = "pink";
  } else {
    rcolor = "red";//changes color to pink with mouse clicks
    }
  }

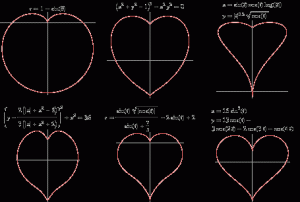
I initially made a heart curve and create a simple, dynamic image that enlarges the heart (widen/lengthen) and rotates the heart in response to the mouse’s movement. However, after playing around with the image, it turned into something completely different. The “heart” now resembles an image from a Rorschach test.

You can also click the mouse to change the object colors from red to pink. The background color changes automatically on the grayscale with every refresh of the frame.

Janet Lee-Project 07-Curves

sketch

//Janet Lee
//Section C
//janetl2@andrew.cmu.edu
//Project 07


var points = 70;
function setup() {
    createCanvas(400, 400);
    strokeWeight(2);
    //stroke("#F1CDD4");//baby pink
    frameRate (30);


}

function draw() {
  background ("#CDE7EE");//baby blue

  push();
  translate (width/2,height/2);
  drawHeart();
  pop();


function drawHeart () {
  var a = map(mouseX,0,width,25,75);
  var b = map(mouseY,0,height,0,100);
//heart becomes bigger and wider

  beginShape()
  //base shape: heart
  for (var i = 0; i < points; i ++ ) {
    var t= map(i,0,points,0,70);//hearts made out of lines
    x = a* sin(t)*sin(t)*sin(t);
    y = b*cos(t)-a*cos(2*t)-2*cos(b*t)-cos(a*t);

    fill("#F1CDD4");//baby pink
    strokeWeight(2);
    vertex(-x,-y);//make the heart upright
  }
  endShape(CLOSE);
}
}

heartcurves_801

Denise Jiang- Project 07

sketch

var nPoints=300;

function setup() {
    createCanvas(500,500);
}

function draw() {
	background(157,129,137);
	drawLeaf();
	drawPeach();
	drawPedal();
}

function drawPeach(){
	var xa;
	var ya;
	var v;
	fill(255,202,212);
	noStroke();
	push();
	translate(width/2, height/2-40);
	beginShape();
	var a;
	var b=map(mouseY, 0,height, 250,255);
	for (var i=0; i<nPoints; i++){
		var t=map(i,0, nPoints, 0, TWO_PI);
		xa=a*((v-1)*cos(t)+cos((v-1)*t))/v;
		ya=a*((v-1)*sin(t)+sin((v-1)*t))/v;
		a=constrain(b,250,255);
		v=3;
		vertex(ya,xa);
	}
	endShape();
	pop();
}

function drawPedal(){
	var xp;
	var yp;
	noFill();
	stroke(255,229,217);
	strokeWeight(5);
	push();
	translate(width/2, height/2+30);
	var m=map(mouseX, 0, height, 0, 5);
	var n=constrain(m,0,5);
	beginShape();
	for (var i=0; i<nPoints; i++){
		var t=map(i,0, nPoints, 0, TWO_PI);
		xp=10*(n+2)*(cos(t)-cos((n+1)*t));
		yp=10*(n+2)*(sin(t)-sin((n+1)*t));
		vertex(xp,yp);
	}
	endShape();
	pop();
}

function drawLeaf(){
	var c=map(mouseY, 0, height, 0, 5);
	fill(215,226,220);
	noStroke();
	push();
	translate(width/2, height/2);
	rotate(radians(50));
	ellipse(-100,-140, 50+c, 145+c);
	pop();
}

I used two different pedal curves in this project. One of them I managed to use MouseX to control the n number of the pedals, while the other one I set the n number to 3 to create the two-pedal peach shape. Moving the mouse from left to right will increase the number of pedals from 0 to 5. MouseY controls the size of the peach.

Andrew Wang – Project 07

sketch

//Andrew Wang

function setup() {
    createCanvas(400, 400);
    fill(240,210,210);
}

function draw() {
    background(130);
    push();
    translate(width/2, height/2);
    //maps mouse between 0- 150 (0-75 for inner) and rotates grid by 30 degrees
    x = map(mouseX, 0, width, 0, 150);
    y = map(mouseY, 0, height, 0, 150);
    rotate(radians(30));
    cruciform(x,y);
    x = map(mouseX, 0, width,150,0);
    y = map(mouseY, 0, height, 150, 0);
    rotate(radians(30));
    cruciform(x,y)
    x = map(mouseX, 0, width, 75,0);
    y = map(mouseY, 0, height, 75,0);
    rotate(radians(30));
    cruciform(y,x);
    x = map(mouseX, 0, width, 0, 150);
    y = map(mouseY, 0, height, 0, 150);
    rotate(radians(30));
    cruciform(x,y);
    x = map(mouseX, 0, width,150,0);
    y = map(mouseY, 0, height, 150, 0);
    rotate(radians(30));
    cruciform(x,y)
    pop();
}

function cruciform(a,b){
    beginShape();
    noStroke();
    for (var n = 0; n < 100; n++) {
        //change to degrees
        var t = map(n, 0, 100, 0, 2*PI)
        //parametric equation of cruciform
        x = a*(1/cos(t));
        y = b*(1/sin(t));
        //draws circles of size 3-6
        ellipse(x, y, map(mouseY, 0, height, 3, 6), 
                      map(mouseY, 0, height, 3, 6));
    }
    endShape(CLOSE);
}

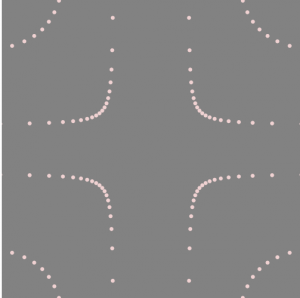
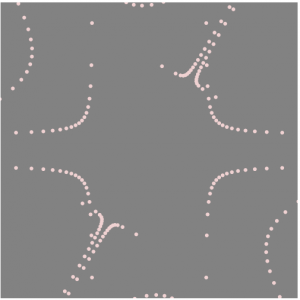
I used the cruciform curve from mathworld for my project. Initially having only put down one curve, it looked a bit lackluster so I created a smaller version to sit inside of the larger one. This was a little better, however, it still looked a little bit barren at certain mouse positions so I decided to try rotations.

v1

I realized that if I wanted to rotate, I would have to make four outer cruciform curves to fill each of the corners. I made the one in the middle upright and curved the others.

v2

for this curve, the two equations that I used were x = a*1/cos(t) and y= a*1/sin(t). I plotted points along the curve instead of drawing the lines since it looked a little bit strange with the lines as there were lots of intersections.