![[OLD FALL 2017] 15-104 • Introduction to Computing for Creative Practice](../../../../wp-content/uploads/2020/08/stop-banner.png)
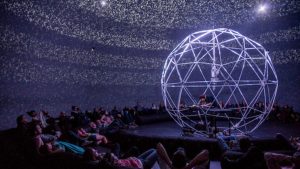
Volume, an installation piece made by an architecture collective named Softlab, is an interactive cube. It is made up of grids of responsive mirrors that redirect light and sound of the people surrounding the piece as a volume. It is interesting in that the motive of the piece is to capture the excitement of the festival-goers. Not only that I liked the sound it makes, but I was also intrigued by its scale and immersive visual. The mirrors are designed to rotate, track people’s movements as they walk around the installation, which creates a sense of infinite depth. The interface for the installation was built in Processing, tiling the coordinates of the cameras in order to visualize the interaction and convert the input into ambient sound.
Month: September 2017
elizabew – looking outwards – 04 – SectionE
Sugarcube: MIDI and MaxMSP Controller
What I really like about this project is how satisfying it looks to play with and touch and listen too. The tilt sensors as you tilt the entire machine makes the sound go up or down, almost as if you were holding a bowl and rolling around a ball in it. It really creates a bridge between physically doing something and technology. I also really like the satisfying buttons and the shape of the whole box — it looks like something I could keep on the side of my desk to just push the buttons for fun.
According to the maker, the project is a MIDI controller — generates Musical Instrument Digital Interface (MIDI) data to MIDI-enabled devices.
The artist was inspired by monome — a similar interactive instrument. However, he wanted to make something cheaper while also not relying on the computer to process everything into MIDI.
aboyle-Project-04-String Art
function setup() {
    createCanvas(300, 400);
}

var move=100
var dir=1

function draw(){
    background(mouseX/2+mouseY/2);
    noFill();

//if moving lines hit the center of the circles, they switch direction
    move+=dir*2
    if (move>=300 || move<=100){
      dir=-dir
    }

  for (var i=10; i<=150; i+=10){
      //creates border lines on left
      stroke(0,300-mouseX,300-mouseX)
      line(0,110-i/2,i*2,0);
      line(0,296+i/2,i*2,400);
      //creates border lines on right
      line(300,360-i/2,i*2,400);
      line(300,30+i/2,i*2,0);
      //creates moving lines
      stroke(300-mouseX,0,300-mouseX)
      line(150,move,i-10,0);
      line(150,move,310-i,0);
      line(150,move,i-10,400);
      line(150,move,310-i,400);


    if (i<100){
      //creates side curves
      stroke(300-mouseX,0,0)
      curve(-200-i*4,150,0,155-i/5,0,255+i/5,-200-i*4,250)
      curve(500+i*4,150,300,145-i/5,300,245+i/5,500+i*4,250)
      //creates circles
      ellipse(150,100,30+i/2)
      ellipse(150,300,30+i/2)
      //creates center curves
      stroke(0,0,300-mouseX)
      curve(0,400,0,300,100+i,200,100,0);
      curve(0,400,300,300,100+i,200,100,0);
      //mirror image of curves
      push();
      translate(width,height);
      rotate(PI);
      curve(0,400,0,300,100+i,200,100,0);
      curve(0,400,300,300,100+i,200,100,0);
      pop();

    }
  }
}
I didn’t really have any ideas about what I wanted the final product to look like, so I just started messing around with different lines to see what would happen. I think that string art is visually appealing, so now that I have a basic grasp on for() I’m excited to play around with it in the future. I decided to add some color changes and movement as well, just to spice it up a little. The one thing I had trouble with was creating the center curves; I ended up making one half and then mirroring it with push() and pop(), but I bet there’s a simpler way to do it.
hqq – secE – project04 – string art
//hamza qureshi
//section e
//project 04
//hqq@andrew.cmu.edu

var x1;
var y1 = 1;
var x2 = 1;
var y2 = 1;
var yDes = 400;

function setup(){
    createCanvas(300,400);
}

function draw(){
    background(30); //dark gray background
    //create a single loop that sets the limits
    //within the x1 variable to allow the curves
    //to stretch horizontally
    for (var x1 = 0; x1 < 4*width; x1 += 5){
        strokeWeight(0.3);
        var y1 = x1 * 0.50;
        var yDev = height/4 + y1;
//outermost lines that are brightest in color
        stroke(180);
        line(x1*4, y1, x1-yDes, y2*0.5);
        line(x1*.10, height, x2, yDev);

//next ring
        stroke(130);
        line(x1*0.4, y1*0.6, x1-yDes, y2*0.5);
        line(x1*2, height*2, x2, yDev);

//next ring
        stroke(80);
        line(x1*0.4, y1, x1-yDes, y2*0.5);
        line(x1*.90, height, x2, yDev);

///next ring
        stroke(60);
        line(x1*0.3, y1, x1-yDes, y2*0.5);
        line(x1*1.7, height, x2, yDev);

//next ring
        stroke(50);
        line(x1*0.2, y1, x1-yDes, y2*0.5);
        line(x1*2.5, height, x2, yDev);

//final ring
        stroke(40);
        line(x1*0.1, y1, x1-yDes, y2*0.5);
        line(x1*3.2, height, x2, yDev);
    }
}

//voila!
For this piece of string art, I wanted to create a piece that used a tunneling effect to show depth. To do this, I used the for loop to change the size, orientation, and stroke color to make it appear as if the sections are getting deeper and deeper. After a few projects where the code became so long, I’m glad that this one uses a much more refined syntax.
LookingOutwards04-jooheek
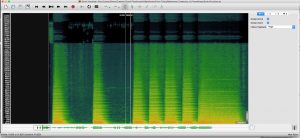
The Creatures of Prometheus – Generative visualisation of Beethoven’s ballet with Houdini
By: Simon Russell
This project shows the relationship between audio and visuals through computation. Specifically, it creates visuals for a Beethoven ballet. Through an algorithm, it detects the pitch and amplitude of the music and makes different shapes and colors for different musical notes. It also detects how high or low the note is compared to the previous note, and uses this to determine how high the shapes are in the composition.
I found this project interesting because it shows how computation can create a connection between audio and visuals, which creates both music and visual art at the same time. It shows that music doesn’t always have to be heard and art doesn’t always have to be seen.
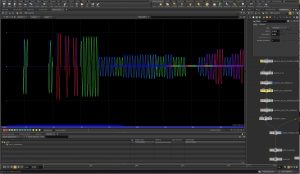
However, what’s interesting is that he did not get the algorithm perfectly. The first four bars of the computation is incorrect, but he states he just wanted to get it finished and out rather than being perfect. He states, “It was quite a fun one because I plugged in the data, hit render and then didn’t really know what would come out. Usually I’d hand animate every last detail but this one is essentially generative.” It’s fun to know that this project was just a fun experiment of someone rather than an actual serious project.
Site: http://www.creativeapplications.net/sound/the-creatures-of-prometheus-generative-visualisation-of-beethovens-ballet-with-houdini/
heeseoc-Project-04-StringArt
//Steph Chun
//15-104 section #A
//heeseoc@andrew.cmu.edu
//Project-04

function setup() {
    createCanvas(400, 300);
}

function draw() {

	background(0);

	for (var i = 0; i < 500; i++) {

		stroke(150+mouseX, 255-mouseY, 100); //color change depending on cursor location//
		strokeWeight(.5);

		line(i*15, height, mouseX, height-i*15); //when mouse is at horizontal center, bottom left//
		line(mouseX, i*15, width-i*15, 0); //top right
		line(i*15+width, height, mouseX, i*15); //bottom right
		line(i*15, 0, mouseX, i*15); //bottom right
}
}
I’ve been experimenting with the curves that connect the adjacent sides of the canvas. While moving them around, I found out that it creates an interesting dimensional quality when the flat sides stick together along the cursor, so I flipped the curves so that the four curves follow the mouse. I gave a slightly different value for one of the curves, because the form as a whole looked boring when it was completely symmetrical.
elizabew-Project-04- String Art
//Elizabeth Wang
//elizabew
//Section E
//Project-04: String Art


// for (var VARNAME = STARTINGVALUE; VARNAME < LIMIT; VARNAME += INCREMENT) {
//     WHAT_TO_DO;
// }


function setup() {
  createCanvas(400,300);
  background(0);

}

function draw() {

  for (var x = 0; x <= 300; x += 10){ //looping lines with a spacing of 10 each time
    stroke(255);
    strokeWeight(.01);

    line(0, height - x, x * 1.5, 0); //upperleft

    line(width, x * 1.5, height - x, height); //lowerright

    line(0, x * 1.5, height/4 + x, height); //left side of eye

    line(height, height/20 + x, x * 1.5, 0); //right side of eye

    noStroke();
    fill(255);
    ellipse(180, 160, 80, 80);

  }


}
Reflection
At the beginning of the project, instead of coming up with an idea of what to make with lines, I wanted to practice getting used to using the for() function and seeing how it affects the shape and look of the lines. After a while, I felt that what I was beginning to form looked like an eye, and so I decided to work towards that as the goal of my project.
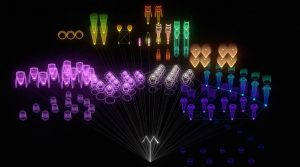
sunmink- Looking Outwards- 04
The origin of word ‘entropy’ came from the Greek word meaning transformation. The sound artist fraction collaborates with louis philippe starnault, naure graphique, and creation ex nihilo to perform a mesmerizing music installation. The installation that provides the sound includes over 6000 distinctive pixels that can transform on order.
When playing his music, fraction absorbs the audience by introducing them an intense-audio-visual experience. He usees sound spatialization, direct light, and projections to enable the audience to fully experience the ‘Entropia.’ I admire this artifact itself because it is an interactive product made by a collaboration of MadMapper, TouchDesigner, Resolume, MaxMsp, Ableton Live, Lemur and IanniX who created algorithms that can illuminate the spherical structure and also built RGB LED strip that is the skeleton of ‘entropy.’ The experience of ‘entropy’ is created through an algorithm that is programming signal based on the pressurized soundtrack. The signals are converted into noise and the luminous behavior during the performance.
selinal-Project-String Art-04
My process for creating these visuals was first to cement a series of curves in a “random” line and balance that series with other curves series based on the location and spread of the first.
//Selina Lee
//Section C
//selinal@andrew.cmu.edu
//Project-04

function setup() {
    createCanvas(400, 300);
    background(250, 220, 130); //faint yellowish background

    noStroke();
    fill(200, 220, 170, 120); //greenish arced shadow on right lower corner
    ellipse(400, 320, 550, 400);

    for(var line1x = 0; line1x < width; line1x += 15) { //initial red series of curves with increments of 15
    	fill(200, 210, 110, 120); //greenish light color to fill curve shapes
    	stroke(250, 70, 20); // red line
    	curve(line1x, line1x, line1x * 10, 100, line1x * 2.5, 200, line1x * 2, height);

    	curve(line1x - 15, height*1.5, line1x * 10 + 20, 220, line1x/2, 50, line1x * 2, 0);

    	curve(line1x/5, 0, -line1x, 0, line1x, 75, line1x + 50, 200);

    	curve(line1x, -100, -line1x/5, 100, line1x*10, 0, line1x + 50, 200);
    }

    for(var line2x = 6; line2x < width; line2x += 15) { //yellow series of curves with increments of 15 but starting more right
    	noFill();
    	stroke(250, 200, 0);
    	strokeWeight(2);
    	curve(line2x, line2x, line2x * 10, 100, line2x * 2.5, 200, line2x * 2, height*2); //thicker top set

    	strokeWeight(1);
    	curve(line2x - 15, height, line2x * 10 + 20, 220, line2x/2, 50, line2x * 2, 0);

    	strokeWeight(.5);
    	curve(line2x/5, 0, -line2x, 0, line2x, 75, line2x + 50, 200); //diminishing bottom sets that overlap with red series and green fills

    	curve(line2x, -100, -line2x/5, 100, line2x*10, 0, line2x + 50, 200);
    }

    for(var line3x = 0; line3x < width; line3x += 20) { //linear series with larger increments of 20
    	stroke(255, 180, 10);
    	strokeWeight(1.5);
    	line(line3x, height +20, line3x*2.3, 200 - line3x/15); //evened out yellow lines on bottom of canvas

    	line(line3x, height+20, line3x*1.8, 180 - line3x/15);

    	line(line3x, height + 20, line3x * 2, 190 - line3x/ 15);

    	fill(200, 50, 0, 150);
    	ellipse(line3x*2, 190 - line3x/15, 10, 10); //ellipse series of red circles

    }
    for(var circle4 = 220; circle4 < width; circle4 += 30) { //ellipse series from right half of canvas to balance out exponential series of red circles
    	fill(200, 50, 0, 150);
    	ellipse(circle4, 190 - circle4/15, 10, 10);
    	ellipse(circle4, 210 - circle4/25, 10, 10);
    }
    for(var line4y = 0; line4y < height; line4y += 15) { //vertical curve series to balance out horizontal strokes
    	fill(200, 100, 10, 50); // orange color with 50 percent transparency
    	curve(width, line4y, 250, line4y, 100, line4y, 0, height - line4y);
    }
}

function draw() {
}sunmink-Project04-string-Art
//Sun Min Kim
//Section E
//sunmink@andrew.cmu.edu
//project04-stringart

var x1 = 50; //x of line
var y1 = 0; //y of line

function setup() {
    createCanvas(400, 300);
}

function draw() {
    background(190, 100, 120);

    var r = acos(height, width); //rotating angle

    for (var i = 0; i <800; i +=30) {
    	strokeWeight(1);
    	rotate(r);

    	stroke(191, 61, 80); //top red line
    	line(400 , i / 8, i / 6, 2);

    	stroke(191, 20, 130); //left pink line
    	line(0, i / 3, i, 200);

    	stroke(130, 100, 140);
    	line(x1 + 250, y1, i/2 -300, 400); //left purple line

    	stroke(255);
    	line(x1 + 340, y1, i/2 -100, 400); //right white line

    	stroke(245);
    	line(x1 - 100, width/2  , i - 300, 300); //bottom grey line


    }

}
For this project, I started off with simple straight lines because I was not sure how function for () is going to act on this problem. However, as I gained confidence in using for (), I could build more layers of strings step by step. It was very interesting to create curves without curve vertex function and I look forward to learning many other ways to build similar result.