sijings-Final Project

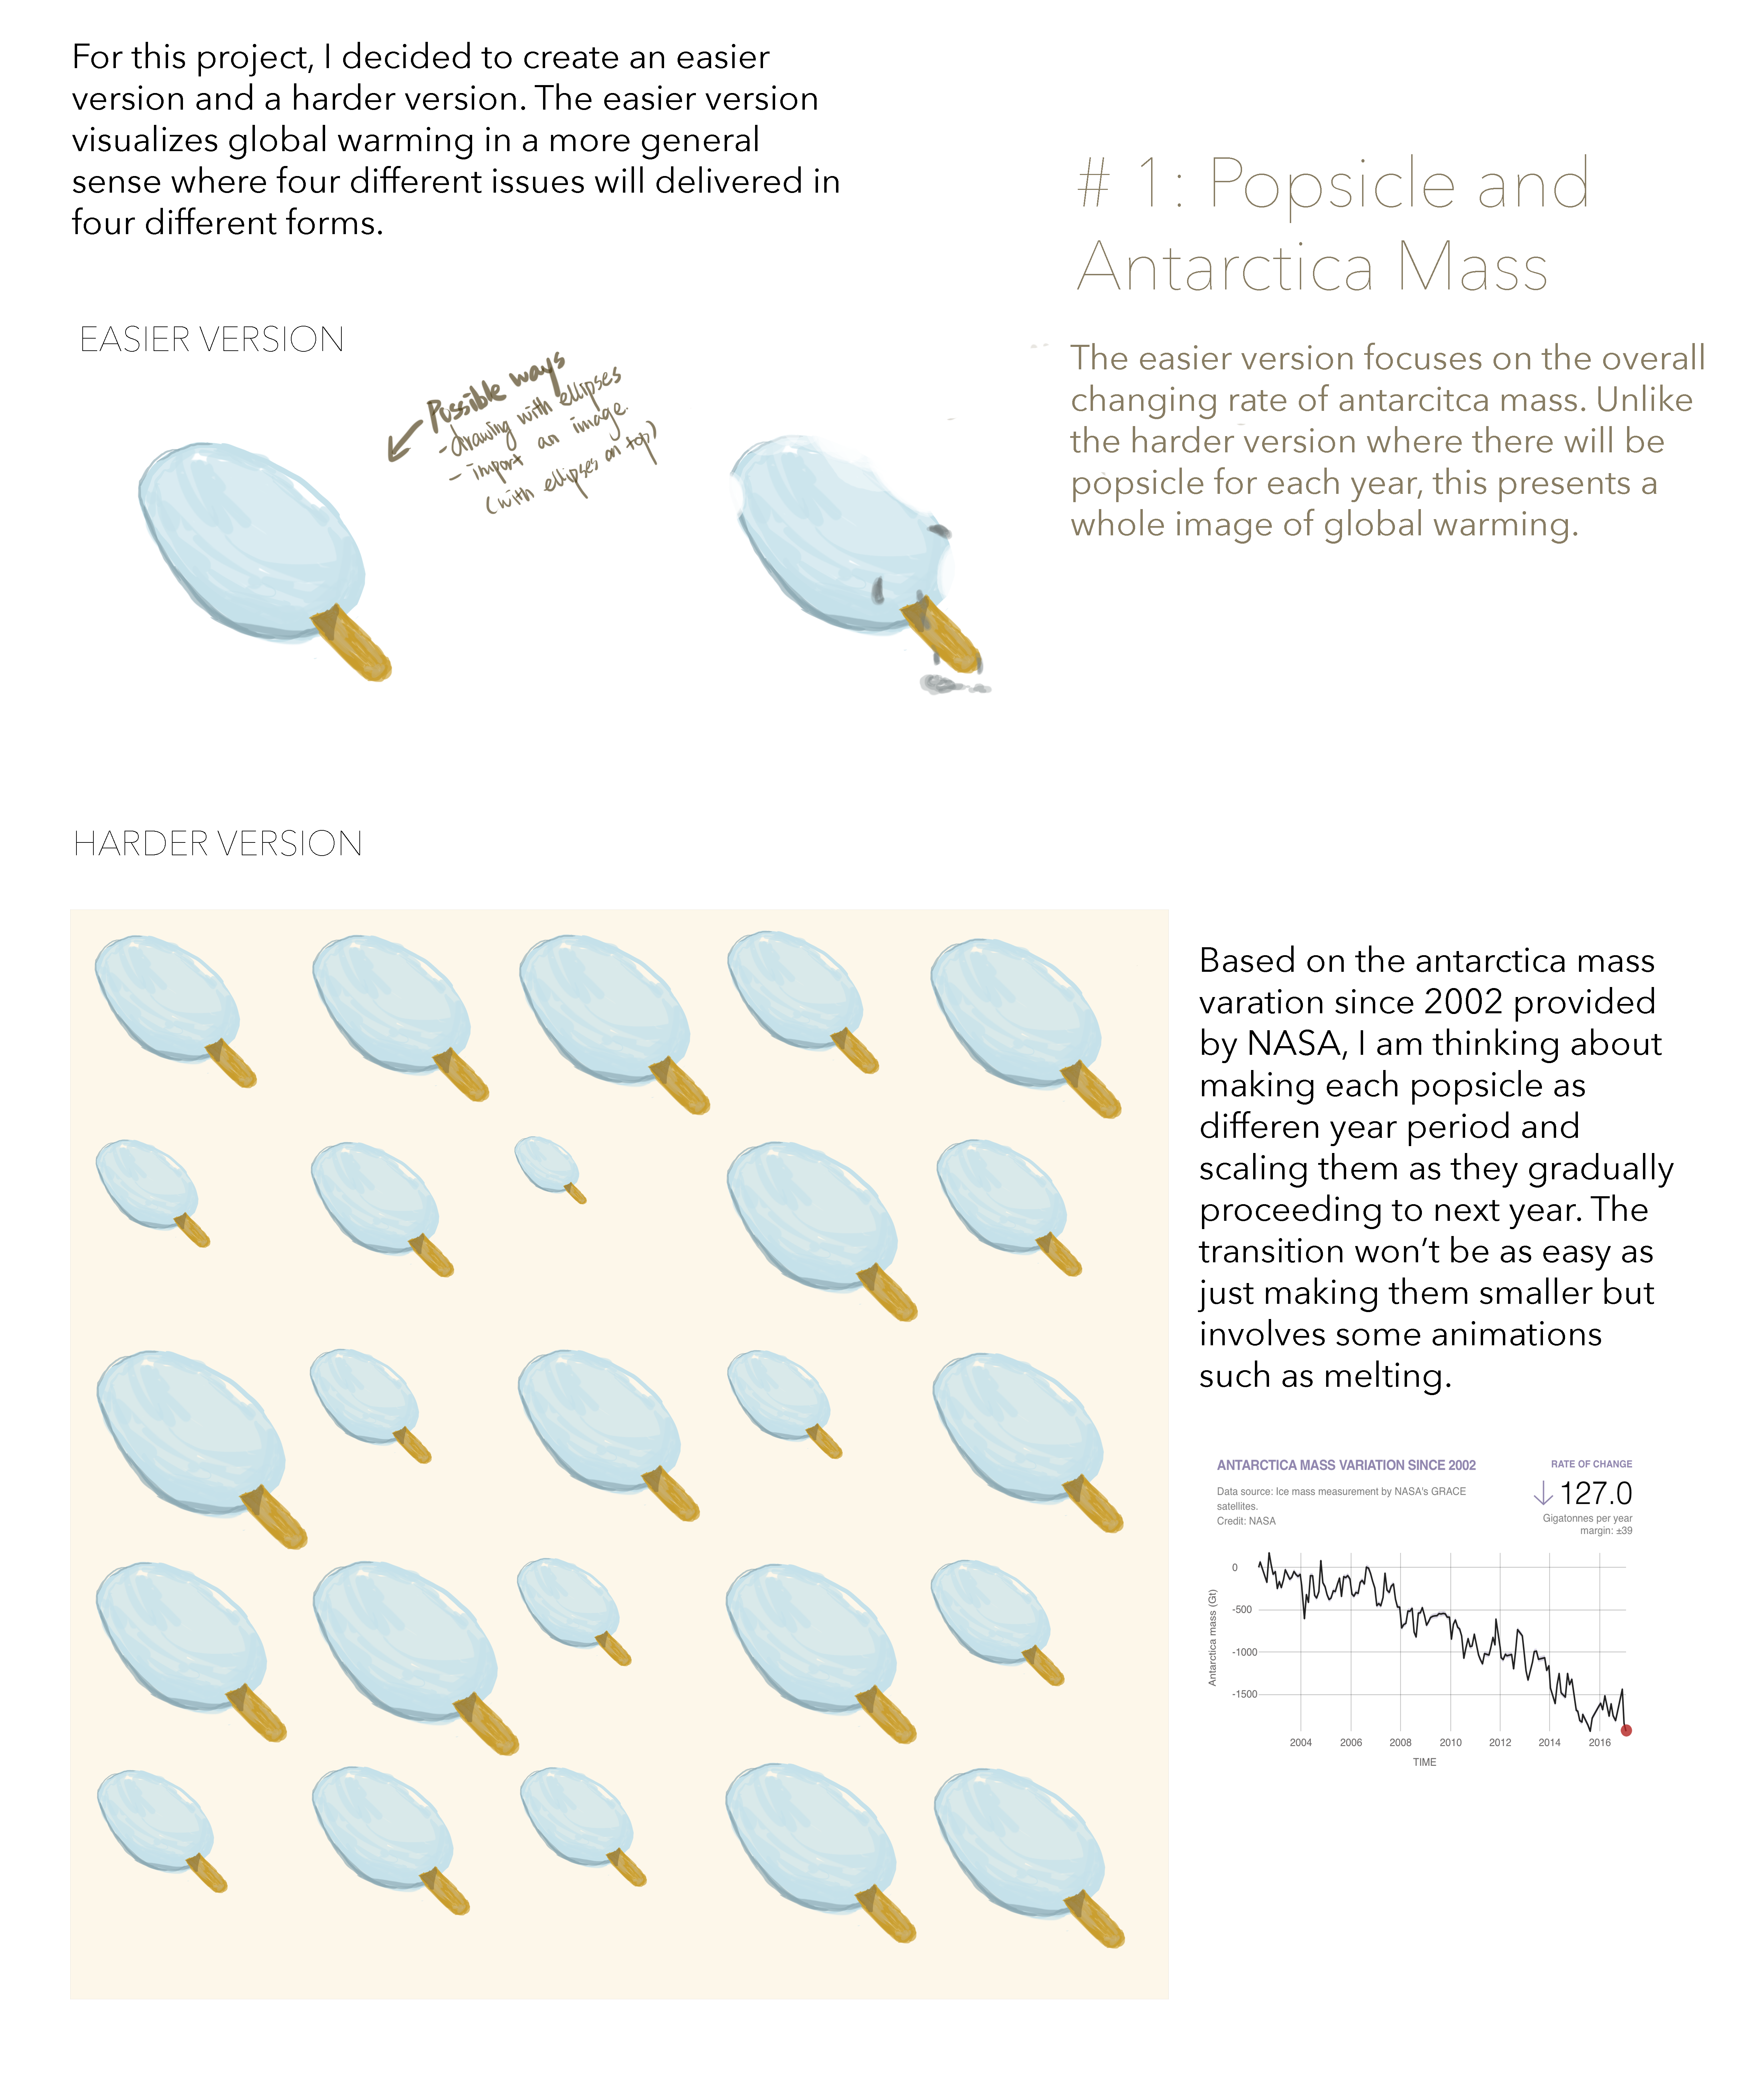
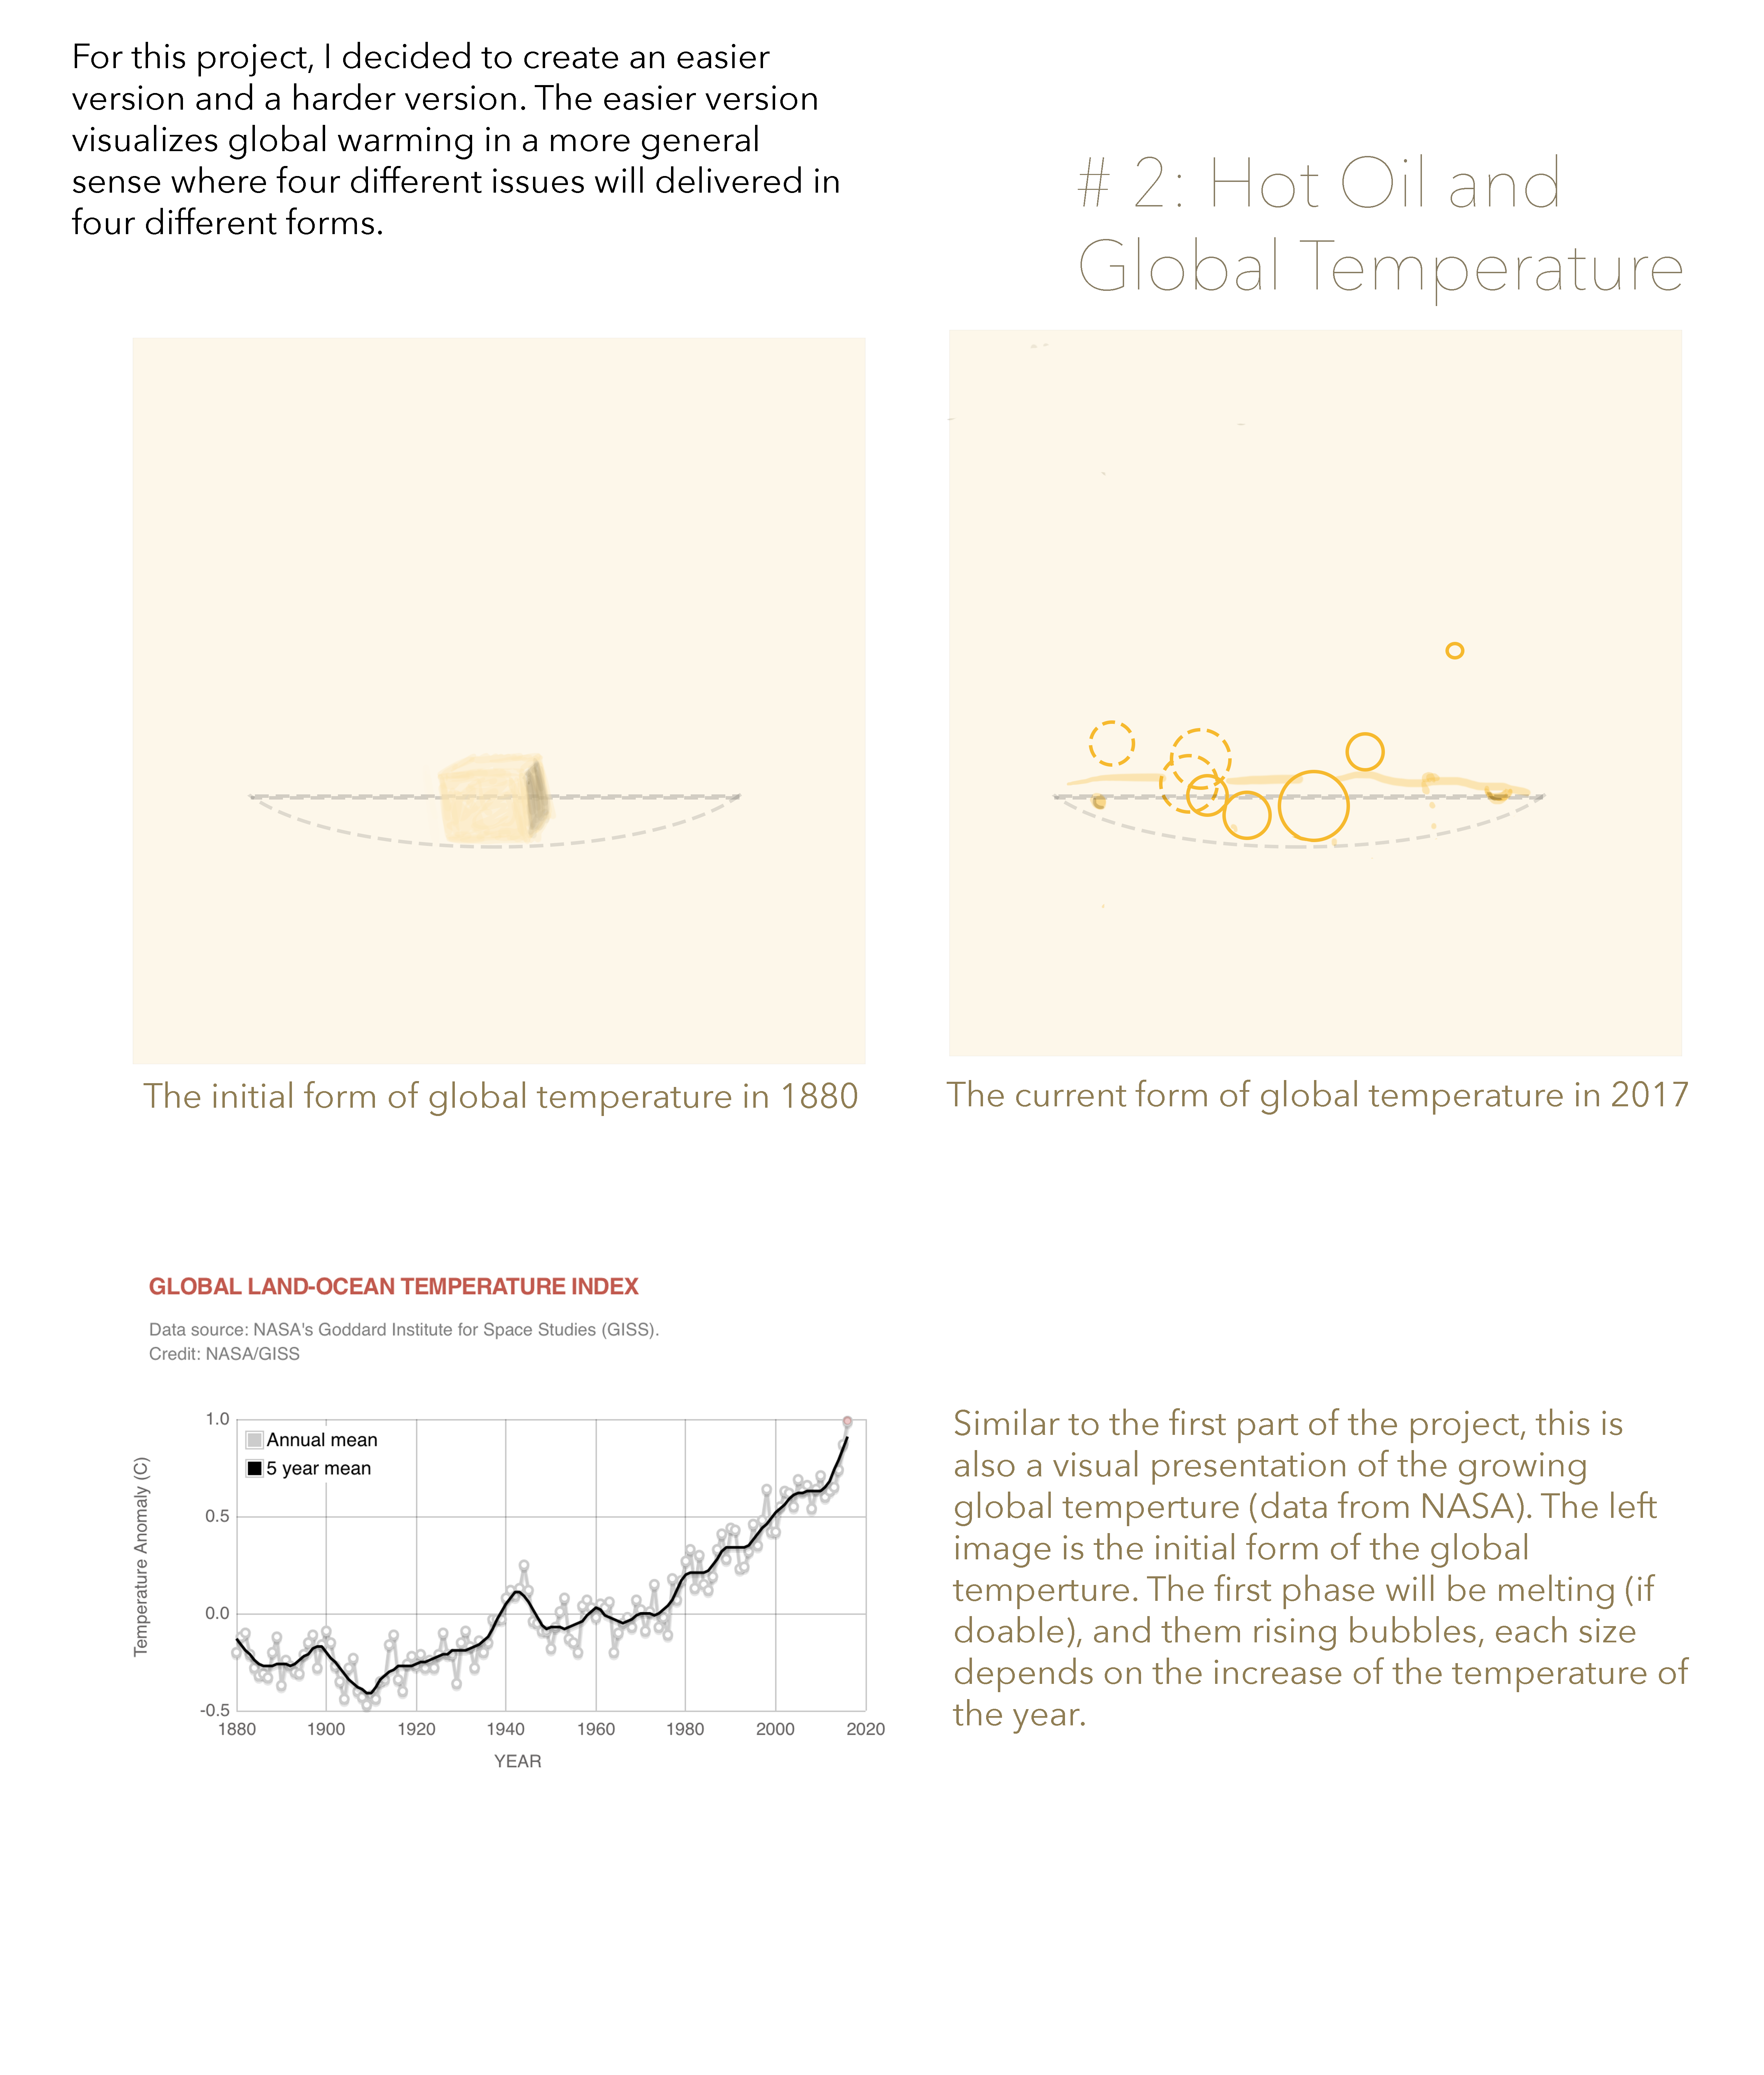
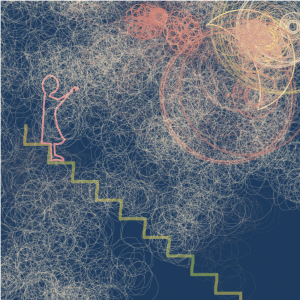
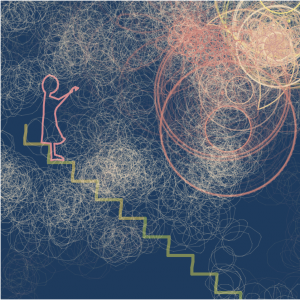
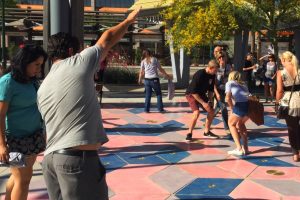
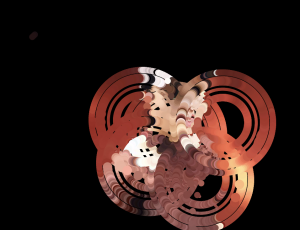
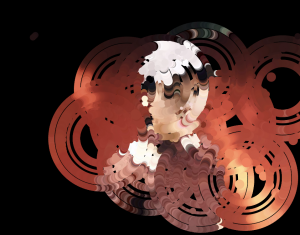
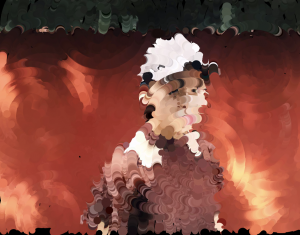
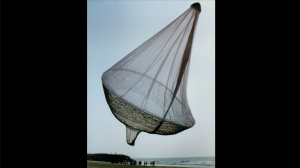
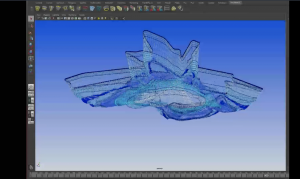
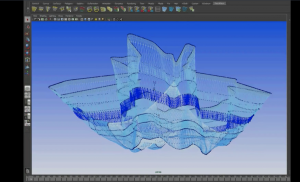
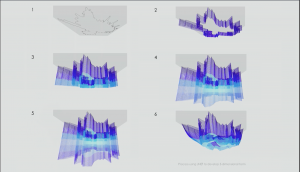
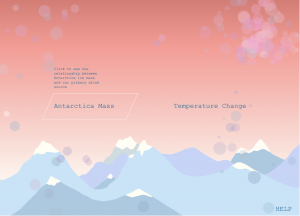
For this project, I want to visualize a set of data from NASA about temperature change and Antarctic mass loss. Instead of just looking at statistical graphs, I chose to investigate from a image perspective that the audience may get a better connection. I found out that although we all know what global warming is, we don’t really connect them to ourselves, thus, I create a direct connection between our daily necessities (food and water) and the changes. The project is divided to two parts, one is to visualize the relationship between the loss of wheat and increasing temperature, the second part is to visualize the relationship between the loss of water and the decreasing antarctic mass. For our knowledge,  there are applications of recursion, use of objects, for loops, etc. The data are all transformed with equations calculated from certain patterns and unit comparison. The project on wordpress is not displayed correctly and very slow, for the full project, please download the linked zip file (below are both the original and the scaled) and see it chrome. 

The introduction
The help page
The second part displaying the relationship between wheat and temperature
The first part between water and Antarctic mass

sijings-termP-original

sijings-termP-scaled

sijings-termP-scaled

//Clair(sijing) Sun
//session C
//sijings@andrew.cmu.edu
//sijings-11-B

///////////global vriables///////////
var wheatX = 50;
var wheatY = 50;
var wheatL = 20;
var frames = [];
var backgroundR = 204;
var backgroundG = 229;
var backgroundB = 237;
var TemperatureMode = false;
var startMode = true;
var iceMode = false;
var helpMode = false;
var img;
var animateW = 200;
var animateH = 50;

///////////global value for ice mass///////////

//all data from NASA.com: URL: https://climate.nasa.gov/vital-signs/land-ice/
var dateRecorded = ["2002.4.16", "2002.5.8", "2002.8.15", "2002.9.17", "2002.10.16", "2002.11.14", 
 "2002.12.17", "2003.1.15", "2003.2.13", "2003.3.15", "2003.4.16", "2003.5.12",
 "2003.7.17",  "2003.8.15", "2003.9.17", "2003.10.16", "2003.11.14", "2003.12.17",
 "2004.1.08", "2004.2.17",  "2004.3.17", "2004.4.16", "2004.5.15", "2004.6.17", "2004.7.16", "2004.8.14",     
 "2004.9.16", "2004.10.16", "2004.11.14", "2004.12.17","2005.1.15","2005.2.13", "2005.3.15", "2005.4.16", 
 "2005.5.16", "2005.6.17", "2005.7.16", "2005.8.14","2005.9.16", "2005.10.16", "2005.11.14", "2005.12.17", 
 "2006.1.15", "2006.2.13", "2006.3.15", "2006.4.16", "2006.5.16", "2006.6.14", "2006.7.17", "2006.8.15", 
 "2006.9.17", "2006.10.16", "2006.11.14", "2006.12.17", "2007.1.15", "2007.2.13", "2007.3.15", 
 "2007.4.16", "2007.5.16", "2007.6.14", "2007.7.17", "2007.8.15", "2007.9.17", 
 "2007.10.16", "2007.11.14", "2007.12.17", "2008.1.15", "2008.2.13", "2008.3.15", 
 "2008.4.16", "2008.5.15", "2008.6.17", "2008.7.16", "2008.8.14", "2008.9.16", "2008.10.16",     
 "2008.11.14", "2008.12.17", "2009.1.15", "2009.2.13", "2009.3.15", "2009.4.16", "2009.5.16",   
 "2009.6.17", "2009.7.17", "2009.8.14", "2009.9.16", "2009.10.16", "2009.11.14", "2009.12.17",    
 "2010.1.15", "2010.2.13", "2010.3.15", "2010.4.16", "2010.5.15", "2010.6.17",  "2010.7.16",
 "2010.8.14", "2010.9.16", "2010.10.16", "2010.11.14", "2010.12.17", "2011.2.17", 
 "2011.3.15", "2011.4.16", "2011.5.16", "2011.7.20", "2011.8.15", "2011.9.17", "2011.10.16",
 "2011.10.30", "2011.10.30", "2012.1.1", "2012.2.13", "2012.3.17", "2012.4.8", "2012.6.17",
 "2012.7.16", "2012.8.14", "2012.9.13", "2012.11.21", "2012.12.17", "2013.1.15", "2013.2.13",
 "2013.4.20", "2013.5.16", "2013.6.17", "2013.7.17", "2013.10.16", "2013.11.14", "2013.12.17",
 "2014.1.8", "2014.3.18", "2014.4.16", "2014.5.16", "2014.6.14", "2014.8.15", "2014.9.17", 
 "2014.10.16", "2014.11.18", "2015.1.22", "2015.2.13", "2015.3.15", "2015.4.16", "2015.4.27",
 "2015.7.13", "2015.8.15", "2015.9.13", "2015.12.21", "2016.1.15", "2016.2.13", "2016.3.17",
 "2016.5.19", "2016.6.17", "2016.7.16", "2016.8.22", "2016.11.29", "2016.12.24", "2017.1.22"]  

var iceMassL = [  0.00, 62.12, -176.07, 170.09, 33.71, -81.62, -51.14, -249.68, -168.66, 
                -238.74, -143.83, -29.82, -139.58,  -118.44, -48.72, -84.84, -107.17, 
                -83.32, -218.59, -604.75, -322.73, -412.72, -98.40, -99.73, -331.48, 
                -361.87, -287.24, 78.00, -181.62, -229.19, -323.17, -379.81, -362.53, 
                -276.68, -285.66, -196.75, -128.12, -342.36, -109.54, -121.62, -97.43, 
                -137.23, -315.63, -340.25, -296.39, -307.18, -178.31, -154.18, -196.17, 
                2.39, -10.96, -74.55, -162.59, -244.63, -451.67, -427.09, -453.85, 
                -356.27, -70.24, -269.10, -295.85, -222.92, -196.99, -374.88, -467.93, 
                -469.47, -715, -676.06, -660.57, -515.51, -518.89, -484.19, -764.67, 
                -821.51, -540.05, -536.66, -476.17, -572.55, -682.62, -641.78, -592.27, 
                -577.59, -572.47, -570.43, -546.31, -550.68, -544.09, -548.48, -587.92, 
                -587.78, -846.48, -671.72, -621.76, -706.68, -727.68, -809.36, -1071.51, 
                -953.83, -841.41, -935.26, -928.85, -789.81, -1033.29, -1086.26, -1138.23, 
                -1017.76, -1035.13, -951.88, -827.31, -914.18, -611.65, -948.14, -1066.81, 
                -1088.57, -1025.66, -1043.95, -1028.25, -1196.57, -987.23, -734.95, -807.52, 
                -996.11, -1220.58, -1329.47, -1116.96, -994.06, -989.43, -1085.24, -1066.72, 
                -1215.76, -1162.48, -1424.32, -1606.66, -1386.24, -1253.63, -1480.57, 
                -1531.72, -1252.97, -1383.92, -1321.53, -1687.98, -1697.55, -1808.10, 
                -1825.73, -1735.62, -1862.28, -1934.24, -1778.25, -1637.34, -1604.18, 
                -1679.21, -1516.72, -1755.32, -1611.07, -1750.97, -1808.04, -1438.70, 
                -1840.86, -1933.91]; 

var cupW = 300;
var cupH = 400;
var top1H = 30;
var top3H = 10;
var xspacing = 0.5;    // Distance between each horizontal location
var w;                // Width of entire wave
var theta = 0.0;      // Start angle at 0
var amplitude = 5.0; // Height of wave
var period = 150.0;   // How many pixels before the wave repeats
var dxWave;               // Value for incrementing x
var yvalues;  // Using an array to store height values for the wave
var beginAnimate = false;
var beginChanges = false;
var iceCount = 0; //to represent framerate

var instruct1; //two images in help
var instruct2;

/////////preloading images////////////

function preload(){
    //loading mountains on page 1
    img = loadImage("https://i.imgur.com/BIk36Rs.png");
    //loading mouth
    var filenames = [];
    filenames[0] = "https://i.imgur.com/fDCS6G3.png";
    filenames[1] = "https://i.imgur.com/XqYcfeX.png";
    filenames[2] = "https://i.imgur.com/vOOvd64.png";
    filenames[3] = "https://i.imgur.com/XqYcfeX.png";
    filenames[4] = "https://i.imgur.com/tmTBJXg.png";
    filenames[5] = "https://i.imgur.com/XqYcfeX.png";
    for (var i = 0; i < filenames.length; i++){//create a new arrary for humans
        frames.push(loadImage(filenames[i]));
    }
    //load instructural images
    instruct1 = loadImage("https://i.imgur.com/yXqSt39.png");
    instruct2 = loadImage("https://i.imgur.com/8KBVWZK.png");
}

//////////setting moving particles///////// Some ideas are inspired by TA's leadinglecture

var gravity = 0.01;   // downward acceleration
var springy = 1.2; // how much velocity is retained after bounce
var drag = 0.0001;    // drag causes particles to slow down
var np = 100;      // how many particles


function particleStep() {
    var forceX = (mouseX / 0.4 - this.x) / dist(this.x,this.y,mouseX / 0.4 ,mouseY / 0.4) * 0.1;
    var forceY = (mouseY / 0.4 - this.y) / dist(this.x,this.y,mouseX / 0.4 ,mouseY / 0.4) * 0.1;
    this.dx -= forceX;
    this.dy -= forceY;
    this.x += this.dx;
    this.y += this.dy;
    if (this.x > width) { // bounce off right wall
        this.x = width - (this.x - width);
        this.dx = -this.dx * springy;
    } else if (this.x < 0) { // bounce off left wall
        this.x = -this.x;
        this.dx = -this.dx * springy;
    }
    if (this.y > height) { // bounce off bottom
        this.y = height - (this.y - height);
        this.dy = -this.dy * springy;
    } else if (this.y < 0) { // bounce off top
        this.y = -this.y;
        this.dy = -this.dy * springy;
    }
    var vs = Math.pow(this.dx, 2) + Math.pow(this.dy, 2);
    // d is the ratio of old velocty to new velocity
    var d = vs * drag;
    d = min(d, 1);
    this.dx *= (1 - d);
    this.dy *= (1 - d);
}


function particleDraw() {
    fill(this.randomR,this.randomG,207,this.randomOpacity);
    ellipse(this.x, this.y,this.scaleS,this.scaleS);

}

function makeParticle(px, py, pdx, pdy) {
    p = {x: px, y: py,
        dx: pdx, dy: pdy,
        step: particleStep,
        render: particleDraw,
        scaleS: random(10,55), //because of the color gradiation on the background
        randomR: map(mouseY,0,height,250,100),//the foreground color also needs a transition
        randomG: random(150,200),
        randomOpacity: random(70,100)
        }
    return p;
}

var particles = [];

/////////basic setup//////////
function setup() {//2.6,x       1.875,y
    createCanvas(1250, 900);
    //loading moving circles on the front page
    for (var i = 0; i < np; i++) {
        particles.push(makeParticle(200, 200,random(-0.25, 0.25), random(-0.25, 0.25)));
    }
    w = width/2+cupW/2-3;
    dxWave = (TWO_PI / period) * xspacing;
    yvalues = new Array(floor(w/xspacing));
}

////////////draw function is divided to different modes as each will lead to a differect part of 
////////////the project

function draw() {
    scale(0.4,0.4);
    background(backgroundR, backgroundG, backgroundB); //set as variables for later changes
    ///////////////call of temperature mode////////////////
    if (TemperatureMode == true){
        fill(252,235,198);
        draWheats();
        fill(255,150);
        rect(150,height - 80,300,50);
        textSize(18);
        fill(103, 114, 175);
        text("Click me to the start",190,height - 50);
    }
    ///////////////call of start mode////////////////
    if (startMode == true){
        //using recursion for drawing a transitional background
        push();
        translate(200, 350);
        colorLayer1(0, 2);
        pop();
        push();
        scale(0.25,0.25);
        image(img,width / 2 - 700,height / 2 - 100);
        pop();

        //activate boxes & introduction behind & around the text 1
        var higherx = width / 2 - 50;
        var lowerx = width/2 - 450;
        if (mouseX / 0.4 < higherx & mouseX / 0.4 > lowerx && mouseY / 0.4 > height/2 - 60 && mouseY / 0.4 < height/2 + 50){
            push();
            strokeWeight(1);
            noFill();
            stroke(255);
            var quadx1 = width/2 - 400;
            var quadx2 = width/2 - 50;
            var quadx3 = width/2 - 100;
            var quadx4 = width/2 - 450;
            quad(quadx1, height/2 - 60, quadx2, height/2 - 60, quadx3, height/2 + 50, quadx4, height/2 + 50);
            pop();
            textSize(15);
            fill(0, 102, 153);
            text("Click to see the relationship between Antarctica ice mass and our primary drink source", width/2-400, 280, 200, 300);
        }

        //activate boxes & introduction behind & around the text 2
        if (mouseX / 0.4 < width/2+420 && mouseX / 0.4 > width/2+70 && mouseY / 0.4 < height/2+50 && mouseY / 0.4 > height/2-60){
            push();
            strokeWeight(1);
            noFill();
            stroke(255);
            quad(width/2+70, height/2-60, width/2+420, height/2-60, width/2+370, height/2+50, width/2+20, height/2+50);
            pop();
            textSize(15);
            fill(0, 102, 153);
            text("Click to see the relationship between temperature and our primary food source: wheat", width/2+70, 280, 200, 300);
        }

        //writing the text
        textSize(28);
        fill(0, 102, 153);
        textFont("Courier New");
        text("Antarctica Mass", width/2-400, height/2);
        text("Temperature Change", width/2+100,height/2);
        text("HELP",width-100,height-20);
        
        //loading the particles
        push();
        noStroke();
        for (var i = 0; i < particles.length; i++) { // for each particle
            var p = particles[i];
            p.step();
            p.render();
        }
        if (mouseIsPressed) {
            particles.push(makeParticle(mouseX/0.4, mouseY/0.4,random(-0.5, 0.5), random(-0.5, 0.5)));
        }
        pop();
    }

    if (iceMode == true){
        noFill();
        drawIce();
    } 

    if (helpMode == true){
        backgroundR=192;
        backgroundG=213;
        backgroundB=247;
        textSize(18);
        fill(0, 102, 153);
        textFont("Courier New");
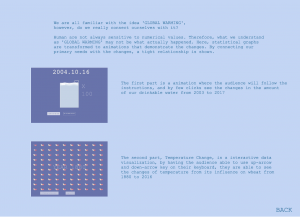
        text("We are all familiar with the idea 'GLOBAL WARMING',",width/2-400, 100); 
        text("however, do we really connect ourselves with it? ", width/2-400, 120);
        text("Human are not always sensitive to numerical values. Therefore, what we understand",width/2-400, 160);
        text("as 'GLOBAL WARMING' may not be what actually happened. Here, statistical graphs", width/2-400, 180);
        text("are transformed to animations that demonstrate the changes. By connecting our", width/2-400, 200);
        text("primary needs with the changes, a tight relationship is shown.",width/2-400, 220);
        
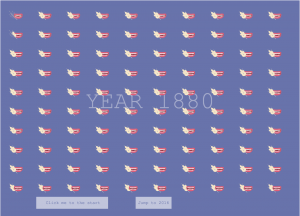
        text("The second part, Temperature Change, is a interactive data", width/2-120, 660);
        text("visualization, by having the audience able to use up-arrow", width/2-120, 680);
        text("and down-arrow key on their keyboard, they are able to see", width/2-120, 700);
        text("the changes of temperature from its influence on wheat from",width/2-120,720);
        text("1880 to 2016",width/2-120,740);
        
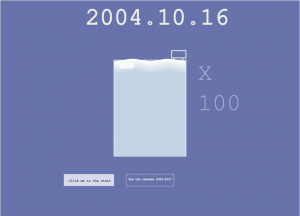
        text("The first part is a animation where the audience will follow the",width/2-120, 350); 
        text("instructions, and by few clicks see the changes in the amount", width/2-120, 370);
        text("of our drinkable water from 2003 to 2017", width/2-120, 390);
        push();
        scale(0.17,0.17);
        image(instruct1,width/2+140,height/2+3000);
        image(instruct2,width/2+140,height/2+1200);
        pop();
        textSize(28);
        fill(0, 102, 153);
        text("BACK",width-100,height-20);

    }
}
function mousePressed() {
    if (startMode == true){
        if ((mouseX / 0.4) < width/2-50 & (mouseX / 0.4) > width/2-450 && (mouseY / 0.4) > height/2-60 && (mouseY / 0.4) < height/2+50){
            iceMode = true;
            startMode = false;
        }
        if (mouseX / 0.4 < width/2+420 & mouseX / 0.4 > width/2+70 && mouseY / 0.4 < height/2+50 && mouseY / 0.4 > height/2-60){
            TemperatureMode = true;
            startMode = false;
        }
        if (mouseX / 0.4 > width - 100 & mouseX / 0.4 < width - 30 && mouseY / 0.4 > height - 40 && mouseY / 0.4 < height - 10){
            helpMode = true;
            startMode = false;
        }
    }
    else if (TemperatureMode == true){
        if (mouseX / 0.4 > width/2-60 & mouseX / 0.4 < width/2-60+150 && mouseY / 0.4 > height-80 && mouseY / 0.4 < height-80+50){
            yearCount=2016;
        }
        if (mouseX / 0.4 < 450 & mouseX / 0.4 > 150 && mouseY / 0.4 < height-30 && mouseY / 0.4 > height-80){
            startMode = true;
            TemperatureMode = false;
        }
    }
    else if (iceMode == true){
        rect(width/2-animateW/2,height-animateH*3.5,animateW,animateH);
        if (beginAnimate == true & mouseX / 0.4 >width/2-animateW/2 && mouseX / 0.4 height-animateH*3.5 && mouseY / 0.4  width/2-animateW*1.8 && mouseX / 0.4 < width/2-animateW*1.8+210 && mouseY / 0.4 > height/2+275 && mouseY / 0.4 < height/2+275+50){
            startMode = true;
            iceMode = false;
            iceCount = 0;
            beginChanges = false;
            beginAnimate = false;

        }
    }
    
    else if (helpMode == true){
        if (mouseX / 0.4 > width - 100){
            helpMode = false;
            startMode = true;
        }
    }
}

/////////////recursion for background transition//////////////////
var colorR=215;
var colorG=112;
var colorB=106;
function colorLayer1(depth, len) {
    noStroke();
    fill(colorR+depth/3,colorG+depth/3,colorB+depth/3);
    rect(-200,-400,width,2);
    push();
    translate(0, len);
    colorLayer2(depth + 1, len);
    pop();
}

function colorLayer2(depth, len) {
    if (depth < 400) {
        colorLayer1(depth, len);
    }
}

/////////////data for wheat//////////////////
var wheatCounter=0;
var yearCount=1880;
var averTemp = [-0.20, -0.12 , -0.10, -0.21, -0.28, -0.32, -0.31, -0.33, -0.20, -0.12, -0.37, -0.24, -0.27,
                -0.30, -0.31, -0.21, -0.15, -0.11, -0.28, -0.16, -0.09, -0.15, -0.27, -0.35, -0.44, -0.28, 
                -0.23, -0.40, -0.43, -0.47, -0.42, -0.44, -0.35, -0.34, -0.16, -0.11, -0.34, -0.40, -0.26,
                -0.22, -0.27, -0.21, -0.28, -0.24, -0.28, -0.21, -0.10, -0.21, -0.21, -0.36, -0.15, -0.09,
                -0.17, -0.28, -0.14, -0.20, -0.15, -0.03, -0.03, -0.03, 0.08, 0.12, 0.09, 0.13, 0.25, 0.12,
                -0.04, -0.05, -0.09, -0.09, -0.18, -0.07, 0.01, 0.08, -0.13,-0.15,-0.20, 0.04, 0.07, 0.03,
                -0.02, 0.05, 0.03, 0.06, -0.20, -0.10, -0.05, -0.02, -0.07, 0.07, 0.02, -0.09, 0.01, 0.15,
                -0.07, -0.02, -0.11, 0.18, 0.07, 0.17, 0.27, 0.33, 0.13, 0.30, 0.15, 0.12, 0.19, 0.33, 0.41,
                0.28, 0.44, 0.43, 0.23, 0.24, 0.32, 0.46, 0.35, 0.48, 0.64, 0.42, 0.42, 0.55, 0.63, 0.62, 0.55, 
                0.69, 0.63, 0.66, 0.54, 0.64, 0.71, 0.60, 0.63, 0.65, 0.74, 0.87, 0.99]

var wheat;
var leaf;
var levelofO;
var lowestTemp = -0.47;//data from NASA
var convertionRate = 0.16
//calculated by 1 temperature will effect 6 wheats to disappear, then one corresponds to 0.16 degree

function convertion(){//this convert the averTemp to the desired value for display
    var currentTemp;
    currentTemp = averTemp[yearCount - 1880] - lowestTemp;
    wheat = floor(currentTemp / convertionRate);
    leaf = floor((currentTemp / convertionRate * 10) % 10);
    levelofO = (currentTemp / convertionRate * 10) % 10 - leaf;
}


function draWheats(){
    convertion();
    var numofL;
    wheatCounter += 0.1;
    backgroundR = 103;
    backgroundG = 114;
    backgroundB = 175;
    noStroke();
    angleMode(DEGREES);
    
    //draw background years
    textSize(100);
    fill(255,100);
    textFont("Courier New");
    text("YEAR " + yearCount, width/2 - 270, height/2);
    
    //draw wheats and mouths
    fill(252,235,198);
    for (var y = 0; y < 10; y ++){
        wheatX = 50 + y * 120;
        for (var i = 0; i < 10; i ++){//top part
            numofL = 0;
            if (i <= wheat & i >= 1 && y < 1){//4 is the number of 麦子
                fill(252,235,198,20);

            }else{fill(252,235,198)}
            
            numofL += 1;
            if (i == wheat + 1 & y < 1){
                if (numofL <= leaf) {
                    fill(252,235,198,20);
                }else{fill(252,235,198)}
            }
            arc(wheatX, wheatY, wheatL, wheatL, 85, 190,CHORD);

            numofL += 1;
            if (i == wheat + 1 & y < 1){
                if (numofL <= leaf) {
                    fill(252,235,198,20);
                }else{fill(252,235,198)}
            }
            arc(wheatX - 9, wheatY + 8, wheatL, wheatL, 265, 10, CHORD);

            push();//left part1
            translate(0,8);
            numofL += 1;
            if (i == wheat + 1 & y < 1){
                if (numofL <= leaf) {
                    fill(252,235,198,20);
                }else{fill(252,235,198)}
            }
            arc(wheatX, wheatY, wheatL, wheatL, 60, 160,CHORD);
    
            ////determine if filling the leaves
            numofL+=1;
            if (i == wheat + 1 & y < 1){
                if (numofL <= leaf) {
                    fill(252,235,198,20);
                }else{fill(252,235,198)}
            }
            arc(wheatX - 4, wheatY + 10, wheatL - 3, wheatL - 3, 230, 355, CHORD);
            translate(7,8);//left part2

            numofL += 1;
            if (i == wheat + 1 & y < 1){
                if (numofL <= leaf) {
                    fill(252,235,198,20);
                }else{fill(252,235,198)}
            }
            arc(wheatX, wheatY, wheatL, wheatL, 60, 160, CHORD);
            
            numofL += 1;
            if (i == wheat + 1 & y < 1){
                if (numofL <= leaf) {
                    fill(252,235,198,20);
                }else{fill(252,235,198)}
            }
            arc(wheatX - 4, wheatY + 10, wheatL - 3, wheatL - 3, 230, 355, CHORD);
            pop();

            push();//right part1
            numofL += 1;
            if (i == wheat + 1 & y < 1){
                if (numofL <= leaf) {
                    fill(252,235,198,20);
                }else{fill(252,235,198)}
            }
            translate(10,6);
            arc(wheatX, wheatY, wheatL, wheatL, 110, 220, CHORD);

            numofL += 1;
            if (i == wheat + 1 & y < 1){
                if (numofL <= leaf) {
                    fill(252,235,198,20);
                }else{fill(252,235,198)}
            }
            arc(wheatX - 11, wheatY + 3, wheatL, wheatL, 290, 40, CHORD);
            
            numofL += 1;
            if (i == wheat + 1 & y < 1){
                if (numofL <= leaf) {
                    fill(252,235,198,20);
                }else{fill(252,235,198)}
            }
            translate(7,8);//right part2
            arc(wheatX, wheatY, wheatL, wheatL, 110, 220, CHORD);
            
            numofL += 1;
            if (i == wheat + 1 & y < 1){
                if (numofL <= leaf) {
                    fill(252,235,198,20);
                }else{fill(252,235,198)}
            }
            arc(wheatX - 11, wheatY + 3, wheatL, wheatL, 290, 40,CHORD);
        
            pop();
            wheatY=50 + i * 80;//for listing all the ys
            push();
            strokeWeight(0.4);
            stroke(252,235,198);
            translate(-9, -1);
            line(wheatX - 5, wheatY - 5, wheatX, wheatY);//top
            line(wheatX - 5, wheatY + 10, wheatX, wheatY + 13);//left1
            line(wheatX + 10, wheatY - 5, wheatX + 12,wheatY + 1);//right1
            line(wheatX, wheatY + 18, wheatX+7, wheatY + 21);//left2
            line(wheatX + 19, wheatY + 10, wheatX + 17, wheatY + 1);//right2
            strokeWeight(1);//root
            line(wheatX + 2, wheatY + 5, wheatX + 29, wheatY + 32);
            pop();
            push();
            var framesC = round(frameCount/6);
            scale(0.1,0.1);
            image(frames[framesC % 6], wheatX * 10, wheatY * 10);
            pop();
        }
    }
    
    fill(255,150);
    if (mouseX / 0.4 > width/30 & mouseX / 0.4 < width/30 + 50 && mouseY / 0.4 > height/18 && mouseY / 0.4 < height/18+50){
        textSize(12);
        fill(173, 129, 225);
        text("1880 -0.2",mouseX / 0.4 +50,mouseY+50);
    }

    rect(width/2-60,height-80,150,50);
    textSize(18);
    fill(103, 114, 175);
    text("Jump to 2016",width/2-50,height-50);
}

function drawIce(){
    iceCount += 1;
    backgroundR = 103;
    backgroundG = 114;
    backgroundB = 175;
    noFill();
    strokeWeight(4);
    stroke(230);
    rect(width / 2 + cupW / 3 - 10, height / 2 - cupH / 2 - top3H, cupW / 6 + 10, -top1H);
    rect(width / 2 + cupW / 3, height / 2 - cupH / 2 - top3H, cupW / 8, top3H);
    rect(width / 2 - cupW / 2, height / 2-cupH / 2, cupW, cupH);

    calcWave();
    renderWave();
    fill(255,200);
    rect(width/2 - 130, height/2 - 190, 65, 25, 20);
    animation();
    
    push();
    var increaseCount = frameCount/3;
    fill(255,190);
    rect(width/2 - animateW * 1.8,height / 2 + 275, 210, 50);
    strokeWeight(0.8 + 0.08 * (increaseCount % 10));
    fill(103,114,175);
    stroke(18);
    textSize(14);
    textFont("Courier New"); 
    text("Click me to the start", width/2 - animateW * 1.7, height / 2 + 295, 350, 100);
    pop();

    if (beginAnimate == true){
        noFill();
        var increaseCount = frameCount/3;
        strokeWeight(0.8 + 0.1 * (increaseCount % 10));
        stroke(230);
        rect(width / 2 - animateW / 2, height - animateH * 3.5, animateW, animateH);
        textSize(12);
        textFont("Courier New"); 
        text("See the changes 2002~2017", width / 2 - animateW / 4 - 40, height - animateH * 3);
        noStroke();
        fill(194,211,231);
        textSize(100);
        textFont("Courier New"); 
        fill(255,100);
        text("X 100", width / 2 + cupW / 1.5, 250, 200, 280);
    }
}


function animation(){
    if (iceCount <= 80){
        textSize(18);
        textFont("Courier New"); 
        fill(255);
        text("Since 2002, there are about 127.0 gigatones loss On antarctica mass every year", width / 2 + cupW / 1.5, 210, 200, 280);
    }
    else if (iceCount > 80 & iceCount <= 160){
        textSize(18);
        textFont("Courier New"); 
        fill(255);
        text("Through the numerical data, we may not see the changes clearly", width / 2 + cupW / 1.5, 210, 200, 280);
    }
    else if (iceCount > 160 & iceCount <= 240){
        textSize(18);
        textFont("Courier New"); 
        fill(255);
        text("However, what we do relate the this place counts 68% of the fresh water for the entire earth", width / 2 + cupW / 1.5, 210, 200, 280);
    }
    else if (iceCount > 240 & iceCount <= 320){
        textSize(18);
        textFont("Courier New"); 
        fill(255);
        text("What if we transform the loss of ice into the loss of our drinkable water?", width/2+cupW/1.5,210,200,280);
    }
    else if (iceCount > 320 & iceCount <= 400){
        textSize(18);
        textFont("Courier New"); 
        fill(255);
        text("Here, I show what happen to 1 bottle of water if we devide this water source into 100 bottles of water", width/2 + cupW/1.5, 210, 200, 280);
    }
    else{beginAnimate=true;}
}
function calcWave() {
    // Increment theta (try different values for 
    // 'angular velocity' here)
    theta += 0.02;

    // For every x value, calculate a y value with sine function
    var x = theta;
    for (var i = 0; i < yvalues.length; i++) {
        yvalues[i] = sin(x)*amplitude;
        x += dxWave;
    }
}
var inputwaterL;
var currentwaterL;
var waterR=255;
var waterG=255;
var waterB=255;
var dateCount=0;
var converticeM=1.091*(10**3);
var totaliceM=2.65*(10**9);
var currentSum;
var changeT=0;

function convertwaterL(){
    if (frameCount % 7 == 0 & changeT < (iceMassL.length - 1) && beginChanges == true){
        changeT += 1;
    }  
    inputwaterL = ((totaliceM - ((-1 * (iceMassL[changeT] - 170.1)) * converticeM)) / (totaliceM));
    inputwaterL = inputwaterL * 100 - 99;
}

function renderWave() {
    convertwaterL();
    currentwaterL = height - (inputwaterL * height);
    currentwaterL = map(currentwaterL, 0, height, height / 2 - cupH / 2, height / 2 + cupH / 2);
    textSize(100);
    fill(255,100);
    textFont("Courier New"); 
    text(dateRecorded[changeT], width / 2 - 270, 100);
    noStroke();
    fill(194,211,231);
    rect(width / 2 - cupW / 2 + 2, currentwaterL + 20, cupW - 4,(height / 2 + cupH / 2 - (currentwaterL + 20)));

    // A simple way to draw the wave with an ellipse at each location
    for (var i = 0; i < 10;i ++){
        waterR = 255 - i * 6.1;
        waterG = 255 - i * 4.4;
        waterB = 255 - i * 2.5;
        for (var x = 955; x < yvalues.length; x++) {
            fill(waterR,waterG,waterB);
            ellipse(x * xspacing, currentwaterL + yvalues[x], 5, 5);
        }
        currentwaterL += 5;
    }
}

function keyPressed() {
    if (keyCode == UP_ARROW & yearCount <= 2015) {
        yearCount += 1;
    }
    else if (keyCode == DOWN_ARROW) {
        if (yearCount > 1880){
            yearCount -= 1;
        }
    }

}

sijings-project12Proposal

For this project, I intended to do some experimenting data visualization that focuses on environmental conservation. My goal was to visualize the data from NASA. Some possible data sets are Carbon Dioxide, Global Temperature, Arctic Sea Ice Minimum, Land Ice, and Sea Level. However, what I want to communicate is not as complicated as the “climate time machine” nor the fancy graphs. Instead, I want to take the advantage of p5js and do some animations’/graphics’ movements that represent these statistics in a much simpler way. The project is intended to make not only the scientists aware of global warming (which they have already done enough), but spread the awareness to all ages in all social classes. I intended to try my best ability to convert some of the changes to very appealing and easy-to-connect graphics. Below are two of my starting ideas.

The first one conveys an easier version and a harder version as I haven’t experimented with my ideas and don’t know the achievability.

The second one deals more about the physic module we have learned in class. I will use elements like “gravity”, “damping”, “spring”, and etc.

sijings-lookingoutwards-12Project Priors and Precursors

The two project I chose for this week is both down by Fernanda Viégas, namely the “Wind Map” and “The Shape of Song (2001)”. I was interested to do things related to data visualization. However, I want to create the visual part with more interesting and attractive elements and Viégas’ projects is a much more complicated version of what I intended to accomplish. Although both projects are about data visualization, one source came from the environmental concern of how wind travels, and the other one is about visualizing a song. The first one is about visualizing an invisible, ancient source of energy surrounds us—energy that powered the first explorations of the world, and that may be a key to the future.


Images from Hurricane Isaac (September 2012)
Images (whole shot) from Hurricane Isaac (September 2012)
Wind Map | MOMA

For the second project, the wind map shows the delicate tracery of wind flowing over the US. The Shape of Song began as a quest to “see” musical form. He created a visualization method called an arc diagram that highlighted repeated sections of music–or of any sequence–with translucent arcs. The overall distribution of pattern gives me inspiration for making my possible work looks like. Similar to “Wind Map”, I also want to get inspirations from natural data which describes some changes.

View of Madonna’s Like a Virgin | 2001
A Collection of Many More Sounds | 2001

Overall, I liked both projects. The only suggestion I have for the second project is to have the sound placed eithere side by side to the project or played as a background music. It is really cool to see the visual element, but I will even appreciate more if I am able to hear some corresponding music.

Here are the links to the projects:

sijings-project11-freestyleTurtle

sijings-Turtle

//Clair(sijing) Sun
//session C
//sijings@andrew.cmu.edu
//sijings-freestyle_turtle

//variables for each turtle
var turtle;
var turtle1;
var turtle2;
var turtle3;
var turtle4;
var turtle5;
var turtle6;
var turtle7;
var turtle8;
var backgroundt;
var backgroundt2;
var humanF;
var r=[250,249,237,122,250,219,216];//array of color where each turtle will 
var g=[222,223,215,137,224,166,131];//take individual color from the array
var b=[111,134,146,80,190,165,115];
var anglechange1=7;
var length1=10;

function setup() {
    createCanvas(480, 480);
    background(22,59,97);
    turtle = makeTurtle(width-20, 40);
    turtle1 = makeTurtle(width-39,60);
    turtle2 = makeTurtle(width-150, 40);
    turtle3 = makeTurtle(width-169,60);
    turtle4 = makeTurtle(40, height/2-40);
    turtle5 = makeTurtle(width-40, 40);
    turtle6 = makeTurtle(width-100, 110);
    turtle7 = makeTurtle(width-120, 150);
    turtle8 = makeTurtle(width-170, 50);
    backgroundt = makeTurtle(width-100, height-50);
    backgroundt2 = makeTurtle(100,50);
    humanF = makeTurtle(80,120);
    //moon
    turtle2.penDown();
    turtle2.setColor(color(r[2],g[2],b[2]));
    turtle2.setWeight(2);
    turtle2.left(50);
    for (var i=0; i<30;i++){
        turtle2.right(anglechange1);
        turtle2.forward(length1);
    }
    turtle2.right(120);
    turtle2.forward(2*length1);
    for (var i=0; i<7; i++){
        turtle2.left(10);
        turtle2.forward(2*length1);
    }
    turtle2.left(15);
    turtle2.forward(length1);
    turtle2.left(15);
    turtle2.forward(length1);

    //for stairs
    turtle4.penDown();
    turtle4.setWeight(5);
    for (var i = 0; i < 10; i++) {
        turtle4.setColor(color(random(r[3]-20,r[3]+20),g[3],b[3]));
        turtle4.right(90);
        turtle4.forward(10);
        turtle4.right(10);
        turtle4.forward(10);
        turtle4.left(10);
        turtle4.forward(10);
        turtle4.left(90);
        turtle4.forward(40);

    }

    //human figure that stands on the stair
    humanF.setColor(color(224,134,143));
    humanF.setWeight(3);
    for (var i = 0; i<8; i++){
        humanF.right(20);
        humanF.forward(5);
    }
    humanF.left(50);
    humanF.forward(5);
    humanF.left(90);
    humanF.forward(15);
    humanF.left(50);
    humanF.forward(25);
    humanF.left(50);
    humanF.forward(5);
    humanF.right(50);
    humanF.forward(5);
    humanF.right(50);
    humanF.forward(5);
    humanF.right(120);
    humanF.forward(5);
    humanF.right(120);
    humanF.forward(5);
    humanF.right(250);
    humanF.forward(5);
    humanF.left(25);
    humanF.forward(15);
    humanF.right(7);
    humanF.forward(25);
    humanF.left(17);
    humanF.forward(5);
    humanF.left(17);
    humanF.forward(5);
    humanF.left(17);
    humanF.forward(20);
    humanF.left(17);
    humanF.forward(20);
    humanF.left(27);
    humanF.forward(5);
    humanF.right(90);
    humanF.forward(5);
    humanF.right(20);
    humanF.forward(5);
    humanF.right(20);
    humanF.forward(5);
    humanF.right(20);
    humanF.forward(5);
    humanF.left(100);
    humanF.forward(18);
    humanF.left(70);
    humanF.forward(10);
    humanF.right(20);
    humanF.forward(5);
    humanF.right(50);
    humanF.forward(3);
    humanF.right(100);
    humanF.forward(10);
    humanF.left(10);
    humanF.forward(5);
    humanF.left(10);
    humanF.forward(5);
    humanF.right(110);
    humanF.forward(5);
    humanF.left(10);
    humanF.forward(22);
    humanF.left(80);
    humanF.forward(15);
    humanF.right(89);
    humanF.forward(15);
    humanF.left(5);
    humanF.forward(15);
    humanF.right(5);
    humanF.forward(15);
    humanF.left(5);
    humanF.forward(15);
    humanF.right(5);
    humanF.forward(15);
    humanF.right(5);
    humanF.forward(5);
    humanF.left(45);
    humanF.forward(5);
    for (var i=0; i<6; i++){
        humanF.right(16);
        humanF.forward(5);
    }   


}


function draw() {
    turtle.penDown();
    turtle1.penDown();
    //below are patterns around the moon (which can be controlled by mouse X and Y)
    
    for (var i = 0; i < 5; i++) {
        turtle.setColor(color(r[0]+i*20,g[0]+i*5,b[0],50));//have 50 at the end for certain transparency
        turtle.forward(mouseX/30);
        turtle.right(25);   
    }
    for (var i = 0; i < 20; i++) {
        turtle1.setColor(color(r[1]-i*2,g[1]-i*5,b[1],100));
        turtle1.forward(mouseX/100);
        turtle1.right(25);   
    }

    for (var i = 0; i < 20; i++) {
        turtle1.setColor(color(r[2]-i*2,g[2]-i*5,b[2],100));
        turtle1.forward(5);
        turtle1.right(25);   
    }

    //for drawing the background (two random generated lines)
    for (var i = 0; i < 20; i++) {
        backgroundt.setColor(color(r[2]-i*2,g[2]-i*5,b[2],20));
        backgroundt.forward(random(0,20));
        backgroundt.right(25);   
    }
    for (var i = 0; i < 20; i++) {
        backgroundt2.setColor(color(r[4],g[4],b[4],50));
        backgroundt2.forward(random(0,20));
        backgroundt2.left(25);   
    }

    for (var i = 0; i < 20; i++) {
        turtle5.setColor(color(r[4],g[4],b[4],30));

        turtle5.forward(mouseX/50);
        turtle5.right(25);   
    }  
    for (var i = 0; i < 20; i++) {
        turtle6.setColor(color(r[5],g[5],b[5],10));
        turtle6.forward(mouseX/50);
        turtle6.right(25);   
    }  

    for (var i = 0; i < 20; i++) {
        turtle7.setColor(color(r[6],g[6],b[6],30));
        turtle7.forward(mouseX/30);
        turtle7.right(25);   
    } 

    for (var i = 0; i < 20; i++) {
        turtle8.setColor(color(r[7],g[7],b[7],10));
        turtle8.forward(mouseX/40);
        turtle8.right(25);   
    }  

    for (var i = 0; i < 20; i++) {
        turtle8.setColor(color(r[7],g[7],b[7],10));
        turtle8.forward(5);
        turtle8.right(25);   
    } 

}

//below codes are directly from turtle graph lecture from 15-104 website

function turtleLeft(d){this.angle-=d;}function turtleRight(d){this.angle+=d;}
function turtleForward(p){var rad=radians(this.angle);var newx=this.x+cos(rad)*p;
var newy=this.y+sin(rad)*p;this.goto(newx,newy);}function turtleBack(p){
this.forward(-p);}function turtlePenDown(){this.penIsDown=true;}
function turtlePenUp(){this.penIsDown = false;}function turtleGoTo(x,y){
if(this.penIsDown){stroke(this.color);strokeWeight(this.weight);
line(this.x,this.y,x,y);}this.x = x;this.y = y;}function turtleDistTo(x,y){
return sqrt(sq(this.x-x)+sq(this.y-y));}function turtleAngleTo(x,y){
var absAngle=degrees(atan2(y-this.y,x-this.x));
var angle=((absAngle-this.angle)+360)%360.0;return angle;}
function turtleTurnToward(x,y,d){var angle = this.angleTo(x,y);if(angle< 180){
this.angle+=d;}else{this.angle-=d;}}function turtleSetColor(c){this.color=c;}
function turtleSetWeight(w){this.weight=w;}function turtleFace(angle){
this.angle = angle;}function makeTurtle(tx,ty){var turtle={x:tx,y:ty,
angle:0.0,penIsDown:true,color:color(128),weight:1,left:turtleLeft,
right:turtleRight,forward:turtleForward, back:turtleBack,penDown:turtlePenDown,
penUp:turtlePenUp,goto:turtleGoTo, angleto:turtleAngleTo,
turnToward:turtleTurnToward,distanceTo:turtleDistTo, angleTo:turtleAngleTo,
setColor:turtleSetColor, setWeight:turtleSetWeight,face:turtleFace};
return turtle;}

For this assignment, I wanted to explore the difference between turtles and the drawing method we have used in the past. I want to create a turtle which responds to the cursor. I found that with turtles, I can generate more detailed and “hand-drawing” like drawings. Thus, I have the inspiration coming from the Dreamworks.

I want to build some interactions between a human figure and the moon. But the style here is aimed to be old, decorative, and detailed. Thus, I thought about creating patterns along the moon and patterns in the background. Depending on the concentration of the patterns, different feelings can be generated (sometimes like fog). Some patterns (the ones in the background) is automatically generated. And other patterns (the ones around the moon) is generated according to the users playing with their mouse.  By dragging the mouse to the right, the patterns grow. With more manipulations, the patterns become dense. Here is a draft that I had before I code the project.

Here are some versions that my freestyle turtle project generates.

Version one
Version 2
version 3

sijings-lookingOutwards-11

Mesa Musical Shadows – Montréal’s venerable Daily tous les jours studio

For this assignment, I chose the work Mesa Musical Shadows because it both serves as an interactive art project and also a media that actually produces real music. It allows the audience to engage in spontaneous exploration, play, and even compose their own music. The piece was created for th

e Mesa Arts Centre, Arizona, known to be the sunniest state. This piece is created by Montréal’s venerable Daily tous les jours studio. It is installed in the north plaza at the Mesa Arts Center in Arizona. Mesa Musical Shadoes have four modes which will change according to the four different time periods (Morning, midday, evening and night) of the day. This is controlled by a MaxMSP patch linking Arduino Mega boards via OSC. Most sounds here were composed by sound designer David Drury to reflect varying atmospheres and — pragmatically — shadow lengths throughout the day. The installation’s 47 sensors are run through six control nodes, comprised of an Arduino Mega, ethernet shields, and custom connector shields – each of which is protected in a waterproof enclosure, placed underneath the tiling. Each sensor unit has a custom PCB with a light sensor on top and an LED on its bottom. The music is coded to the sensors,  for nighttime illumination and the more sensitive gear (computers, amplifiers, etc.) is all installed in the museum.

Sensors Being Connected to Computers | 2016
The Structure of the Sensor | 2016

A normal sensor will be easy to create for anyone who owns some coding skill, however, what Mesa Musical Shadows is manifested by creator’s artistic sensibilities of audiences’ relationship with the artwork. Quoted from “Creative Application Networks”, “From simple post-it notes to fully interactive mats, we brought different prototypes on site to get direct feedback and help refine the project … These consultations helped us figure out what the project’s essence had to be and hopefully, the results honor that process and reflect the community’s various contributions.”

Audience Interacting with The Work | 2016

sijings-lookingoutwards-10

The Home Page of MINICADE | Chloe Varelidi is the Co-creator
The Home Page of Varelidi Website

This week, I was inspired by Chloe Varelidi and her project “MINICADE”. This project attracts me not only because of its being very interesting to play but also the ability to create our own games. In general, “MINICIADE” is a super easy way to collaboratively create a playlist of mini-games with participants’ friends. Each person can add a link to one or more mini-games to the playlist and instantly play them as one massive game. Mobile-friendly and 100% open-source. Participants also get a chance to learn code while we create the game. Personally, I always see this game as silly but really fun to play. And I think these games get to become really popular recently. However, sometimes I wished that I have an app to create these games myself, to create some tricks to my friends. I think Chloe Varelidi here provides this chance.

Some biography about Chloe Varelidi. Chloe Varelidi is a Game designer and illustrator who currently work at littleBits as a Sr. Product Design Strategist where she spends her days with the finest of humans designing new products that empower children to create inventions.


“Minicade” by Chloe Varelidi and Atul Varma  (the specific date was not found)

sijings-project10- Generative Landscape

sijings_ GenerativeLandscape

//Clair(sijing) Sun
//session C
//sijings@andrew.cmu.edu
//GenerativeLandscape

var frames = [];
var frameeys=[];
var humans=[];
var cakes = [];
var frames2 = [];
var r=220;


function setup() {
    createCanvas(480, 240);
    var x=width/2;
    var y=height/2;
    var x1;
    var y1;
    
    // create an initial collection of humans
    for (var i = 0; i < 10; i++){
        var rx = random(width);
        humans[i] = makeHuman(rx);
    }

    for (var i2 = 0; i2 < 5; i2++){
        var rx2 = random(0,5);
        cakes[i2] = makeCake(rx2);
    }
    frameRate(10);


}

function preload(){
    var filenames = [];
    filenames[0] = "https://i.imgur.com/SqI6peg.png";
    filenames[1] = "https://i.imgur.com/045MUOm.png";
    filenames[2] = "https://i.imgur.com/fQHcLAX.png";
    filenames[3] = "https://i.imgur.com/8xnKXdV.png";
    filenames[4] = "https://i.imgur.com/RXbcttI.png";
    
    for (i=0; i<filenames.length; i++){//create a new arrary for humans
        frames.push(loadImage(filenames[i]));
    }

    frames2.push(loadImage("https://i.imgur.com/4Li0MwV.png"));
    frames2.push(loadImage("https://i.imgur.com/DPquy2W.png"));
    var filenames2 = [];
    filenames2[0]="https://i.imgur.com/eKURFcs.png";
    filenames2[1]="https://i.imgur.com/6khWp0b.png";
    filenames2[2]="https://i.imgur.com/ftnXNpy.png";
    filenames2[3]="https://i.imgur.com/GUpBr3X.png";
    for (i=0; i<filenames2.length; i++){
        frameeys.push(loadImage(filenames2[i]));//create a new arrary for eyes
    }
}


function draw() {
    background(222,212,212); 
    fill(206,119,44);
    angleMode(DEGREES);
    push();
    noStroke();
    arc(width/2, -40, 390, 390, 0, 180,90);
    pop();
    for (var i2=0; i2<18; i2++){//for drawing the sound's light rays
        x=width/2+sin((360/18)*i2)*r;
        y=-10+cos((360/18)*i2)*r;
        x1=width/2+sin((360/18)*i2)*(r-20);
        y1=-10+cos((360/18)*i2)*(r-20);
        stroke(157,82,32);
        strokeWeight(6);
        line(x, y, x1, y1);
    }
    push();
    scale(0.5,0.5);
    translate(-60,0);
    image(frameeys[frameCount%4], width/2+30, -30);//for the eyes animation
    pop();
    push();
    addNewCake();//call these functions in setup so it is actually get called
    updateHumansandCakes();
    removecakeandhuman();
    addNewHuman(); 
    pop();

    
}


function updateHumansandCakes(){
    // Update the building's positions, and display them.
    for (var i = 0; i < humans.length; i++){
        humans[i].move();
        humans[i].display();
    }
    for (var i2 = 0; i2 < cakes.length; i2++){
        cakes[i2].move2();
        cakes[i2].display2();
    }
}


function removecakeandhuman(){//to remove the cakes and humans which are off the canvas
    var lakesToKeep = [];
    for (var i2 = 0; i2 < cakes.length; i2++){
        if (cakes[i2].x2 + cakes[i2].breadth2 > 0) {
            lakesToKeep.push(cakes[i2]);
        }
    }
    cakes = lakesToKeep; 
    var buildingsToKeep = [];
    for (var i = 0; i < humans.length; i++){
        if (humans[i].x1 + humans[i].breadth > 0) {
            buildingsToKeep.push(humans[i]);
        }
    }
    humans = buildingsToKeep; // remember the surviving buildings
    
}

function addNewCake(){
    var newCakeLikelihood1 = 0.01; //make possibility lower
    if (random(0,1) < newCakeLikelihood1) {
        var randompos1=-5;
        cakes.push(makeCake(randompos1));
    }
}

function addNewHuman() {
    // With a very tiny probability, add a new building to the end.
    var newHumanLikelihood = 0.6; //higher possibility
    if (random(0,1) < newHumanLikelihood) {
        var randompos=random(-5,0);
        humans.push(makeHuman(randompos));        
    }
}

//update position of building every frame
function humanMove() {
    this.x1 += this.speed1;
}
function cakeMove(){
    this.x2 += this.speed2;
}

function lakeDisplay(){
    push();
    translate(this.x2,50);//note here translate has to be inside of push so that
    scale(this.scaleS,this.scaleS);//new objects won't be added out side of the
    image(frames2[0],0,height-10);//canvas instead, they will be added inside
    translate(-650,300);
    image(frames2[1],40,height-10);
    pop();

}


//reconmded to create a new object for a separate image
function makeCake(lakeLocationX){//similar as creating the object below
    var cake = {x2:lakeLocationX,
                speed2 : random(1,2.5),
                move2: cakeMove,
                breadth2: 50,
                scaleS: random(0.1,0.5),
                display2 : lakeDisplay}
    return cake;
}


// display the pedestrian
function humanDisplay() {
    push();
    translate(this.x1,this.floatHeight);
    var framesC = frameCount % 5; //animating the birds
    scale(this.scaleS2,this.scaleS2);
    image(frames[framesC],0,0);// the birds will flap their wings staggered

    pop();
}

function makeHuman(birthLocationX) {//create the human object with below properties
    var pedestrian = {x1: birthLocationX,
                speed1: random(5,10),
                floatHeight: random(40,150),//for some going a little bit higer than others
                breadth: 50,
                nFloors: round(random(2,8)),
                scaleS2: random(0.05,0.15),//for some is larger than others
                move: humanMove,
                display: humanDisplay}
    return pedestrian;//remember to return the object
}


For this project, I was aiming for creating a city landscape where odd, strange things happen as well as normal people walking on the street. The inspiration comes from the idea how people sometimes walk on the street and won’t give too much attention on what’s happening around them. To achieve this idea, I created two objects, one for the pedestrian and the other for all other moving objects (b/c they have different speed and position, so I think it is easier to have them on two different objects). Some randomization here is the location, size, and speed of the individuals in the object. For example, each pedestrian is walking in a different speed. Here is the sketch for the city landscape I imagined.

For this project, I got to learn how to use object much clearly. Also, I also find that loading frames is a really useful strategy for creating cool visual elements.

Here are two screenshot for the original dimention I was working on.

sijings-project09 – Computational Portrait

 
Note: this only works in Google Chrome for some unknown reason. So when viewing this project, please load it in Google Chrome.

sijings-portrait-week9

//Clair(sijing) Sun
//session C
//sijings@andrew.cmu.edu
//project-09

var underlyingImage;
var count=0;
var gAngle = [45,90,135,180];//for four circle's angles
var radius = [80,80/1.2,80/1.5,80/2];//for four circle's radius


function preload() {
    var myImageURL = "https://i.imgur.com/VEFcvLY.jpg";
    underlyingImage = loadImage(myImageURL);//loading pics

}

function setup() {
    createCanvas(480, 380);//within the size range
    background(0);
    underlyingImage.loadPixels();
    frameRate(30);//set to 30 so that it actually stay 

}

function draw() {
    var x = [cos(radians(gAngle[0])) * radius[0]];//build an array for x changing value
    var y = [sin(radians(gAngle[0])) * radius[0]];
    var px = [mouseX+x[0]];//array for x
    var py = [mouseY+y[0]];//array for y
    count+=1;//for determing when the second, third, fourth circles appear
    if (count>=150){
        x.push(cos(radians(gAngle[1]))*radius[1]);
        y.push(sin(radians(gAngle[1]))*radius[1]);
        px.push(mouseX+x[1]);
        py.push(mouseY+y[1]);
    }
    if (count>=170){
        x.push(cos(radians(gAngle[2]))*radius[2]);
        y.push(sin(radians(gAngle[2]))*radius[2]);
        px.push(mouseX+x[2]);
        py.push(mouseY+y[2]);

    }
    if (count>=190){
        x.push(cos(radians(gAngle[3]))*radius[3]);
        y.push(sin(radians(gAngle[3]))*radius[3]);
        px.push(mouseX+x[3]);
        py.push(mouseY+y[3]);
    }
    var ix = constrain(floor(px[0]), 0, width-1);//set the constrain for each x, y pos
    var iy = constrain(floor(py[0]), 0, height-1);
    var ix1 = constrain(floor(px[1]), 0, width-1);
    var iy1 = constrain(floor(py[1]), 0, height-1);
    var ix2 = constrain(floor(px[2]), 0, width-1);
    var iy2 = constrain(floor(py[2]), 0, height-1);
    var ix3 = constrain(floor(px[3]), 0, width-1);
    var iy3 = constrain(floor(py[3]), 0, height-1);
    var theColorAtLocationXY = [underlyingImage.get(ix, iy)];//get the color
    theColorAtLocationXY.push(underlyingImage.get(ix1,iy1));//add into the color array
    theColorAtLocationXY.push(underlyingImage.get(ix2,iy2));
    theColorAtLocationXY.push(underlyingImage.get(ix3,iy3));

    noStroke();
    fill(theColorAtLocationXY[0]);//call corresponding color
    ellipse(px[0], py[0], 10, 10);

    fill(theColorAtLocationXY[1]);
    ellipse(px[1],py[1],15,15);

    fill(theColorAtLocationXY[2]);
    ellipse(px[2],py[2],5,5);

    fill(theColorAtLocationXY[3]);
    ellipse(px[3],py[3],12,12);

    gAngle[0] = gAngle[0] + 2;//change of angles everytime
    gAngle[1] = gAngle[1] - 2;
    gAngle[2] = gAngle[2] + 2;
    gAngle[3] = gAngle[3] - 2;
}

For this project, I thought about Van Gogh’s painting with how each stroke is distorted and convey a unique feeling of the whole image. “The Starry Night” especially, is where my inspiration came from.  

With each part of the drawing circulating, I thought I will be interesting to apply a similar technique on a portrait. For this project, I chose to do a more interactive piece where the audience can manipulate the strokes with their mouses. According to the position of the mouse, four circles with different width and radius will draw accordingly. In the end, the how the picture looks like a portrait composed with hundreds of circles.

Original Portrait
stage1 with two mouse movement
stage2 with four mouse movements
with more mouse movements
one possibility of the final presentation

I was influenced by the “Cubism” idea.

sijings-lookingoutwards-09

details | Chris Harrison

Link to the ClusterBall


This is a project chosen by Zining Ye. I found this project to be really interesting as I am also interested in the field of data visualization and HCI. I appreciate how he has demonstrated a clear instruction of how the project actually works that I feel very easy to access the whole project. One little suggestion I have is to have the pictures of the actual work to be a little bit larger so the details are better shown. When I was looking at it, I was connected to thinking about web and how our thoughts are also connected and weaving like individual threads. If I was to access this project, I would try to find some specific example of how these levels of Wikipedia category pages and their interconnections connect. Furthermore, I looked into this work on other websites other than Chris’ own website, expecting to find more interesting information of the project. It is demonstrated in “Visual Complexity” that the clustering component of this visualization is vital. As Chris explains: “The mere presence of information isn’t all that interesting; there is no context or relevance to be gleaned. However, the structure of information is revealing about where fields intersect and diverge, and ultimately about how humans organize information”.

Whole Look | Chris Harrison
Detailed Connections | Chris Harrison

Movie of the ClusterBall

sijings-lookingoutwards-08


Janet Echelman (born 1966) is an American sculptor and fiber artist. She graduated from Harvard University in 1987. Her sculptures have been displayed as public art, often as site-specific installations. She starts working with a Hamble material. She first studied Chinese calligraphy at Hong Kong University where she encountered a building/architecture made by bamboo which has a strength she admired during an earthquake. In 1997, Echelman won a Fulbright Senior Lectureship and traveled to India with the intention of giving painting exhibitions. For Janet’s work, I really appreciate how she can flexibly manipulate materials and media. I remember in this talk, she first discussed how her material cannot arrive on time and results in her changed choice of using the material. Instead of waiting, she used a local material, the fishing net. She then discovered how the adaptability of it –the ever-changing form of the interaction of the wind.

The First Work She felt Satisfied to Work with | 1997 | Mahabalipuram

For most of her work, she will design on applications first to construct precise shape with gentle movement. She figured out to use the variable of a machine to create a pattern of hand-made patterns. To let more industrial workers work on her piece, she created her own language of how to make these patterns for the workers. She analyzes the photos of the sky and graphs the saturation with software that is developed by her studio. This software helped her to create images that describe the imagined shape during the day and night time, with wind and without.

The Form of Her Work Without Wind Interpetated from This Application |2014| The Bill and Melinda Gates Foundation Campus
The Form of Her Work With Wind Interpetated from This Application |2014 |The Bill and Melinda Gates Foundation Campus
Layers of Saturation Echelman Uses to Analysis | 2014 | The Bill and Melinda Gates Foundation Campus

Throughout the whole presentation, she presented with pretty self-explanatory pictures and animations. Her instructions are calm, slow and really natural. The anecdote jokes she shared about really helps to add layers on her overall presentation. She also demonstrates a really clear timeline with the different stage in her life and artwork, from her basically new to the medium and material to the place where she mastered it and combine with sound, climate change, and etc.


Janet Echeiman’s talk on Inst-Int Festival