![[OLD FALL 2017] 15-104 • Introduction to Computing for Creative Practice](../../../../wp-content/uploads/2020/08/stop-banner.png)
// Bettina Chou
// yuchienc@andrew.cmu.edu
// Section C
// Project 07 Curves
bgCol = {"r": 200, "g": 180, "b": 180}; //background color
col = {"r": 200, "g": 220, "b": 220}; //color of dots and lines
function setup() {
createCanvas(480,480);
}
function draw() {
var nPoints = map(mouseX, 50, width, 1, 40, true); //varies the number of points 1 to 40
var t = map(mouseY,0,height, 10, 400); //varies size of astroid
var w = map(mouseY, 0, height, -100, 120); //moves center of lines left and right
bgCol.r = map(mouseY,0,height,50,200);
col.r = map(mouseY,0,height,50,200);
background(bgCol.r, bgCol.g, bgCol.b);
push();
translate(240,235); //translate to center of canvas
drawAstroidDots(nPoints, t, w);
drawAstroidLines(nPoints, t, w);
pop();
}
function drawAstroidDots(nPoints, t) {
beginShape();
for (var i = 0; i < nPoints; i++) {
var x = t * cos(i)^3;
var y = t * sin(i)^3;
noStroke();
fill(col.r, col.g, col.b);
ellipse(x,y,5,5);
}
endShape();
}
function drawAstroidLines(nPoints, t, w) {
beginShape();
for (var i = 0; i < nPoints; i++) {
var x = t * cos(i)^3;
var y = t * sin(i)^3;
if (nPoints > 1) {
stroke(col.r, col.g, col.b);
line(w,120,x,y); //draws lines from one center point to each dot
}
}
endShape();
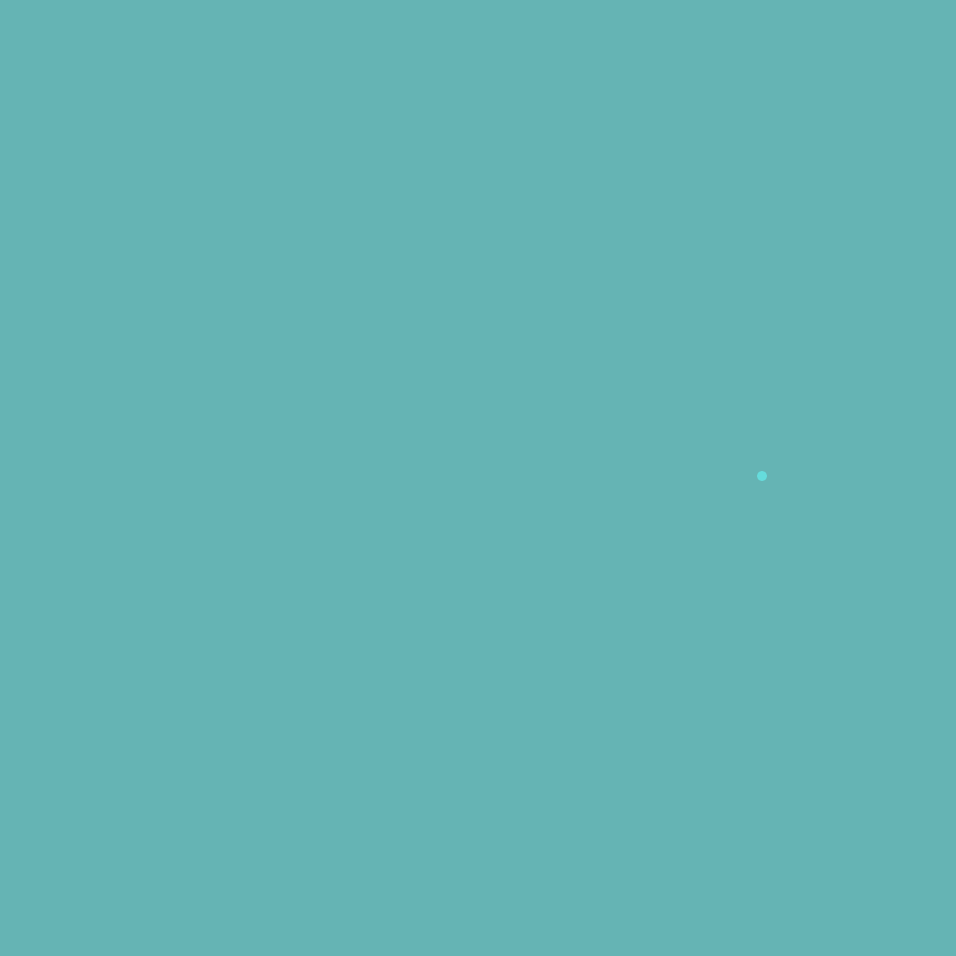
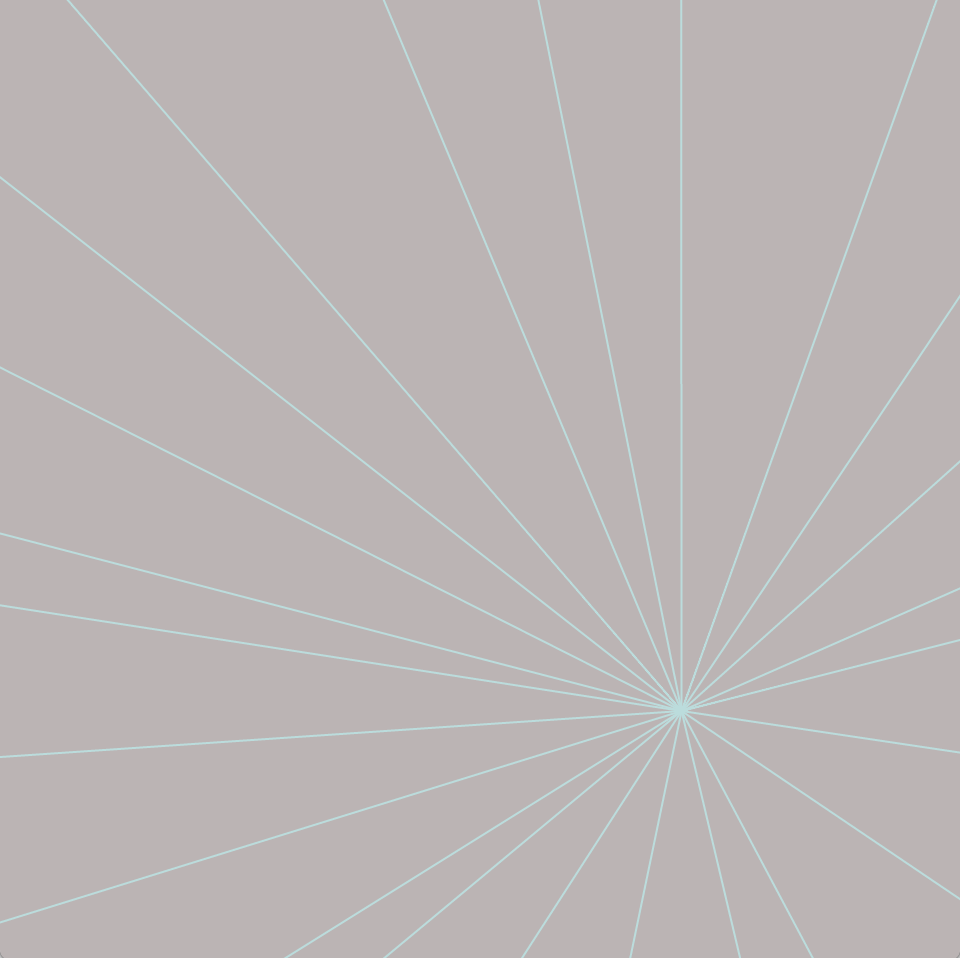
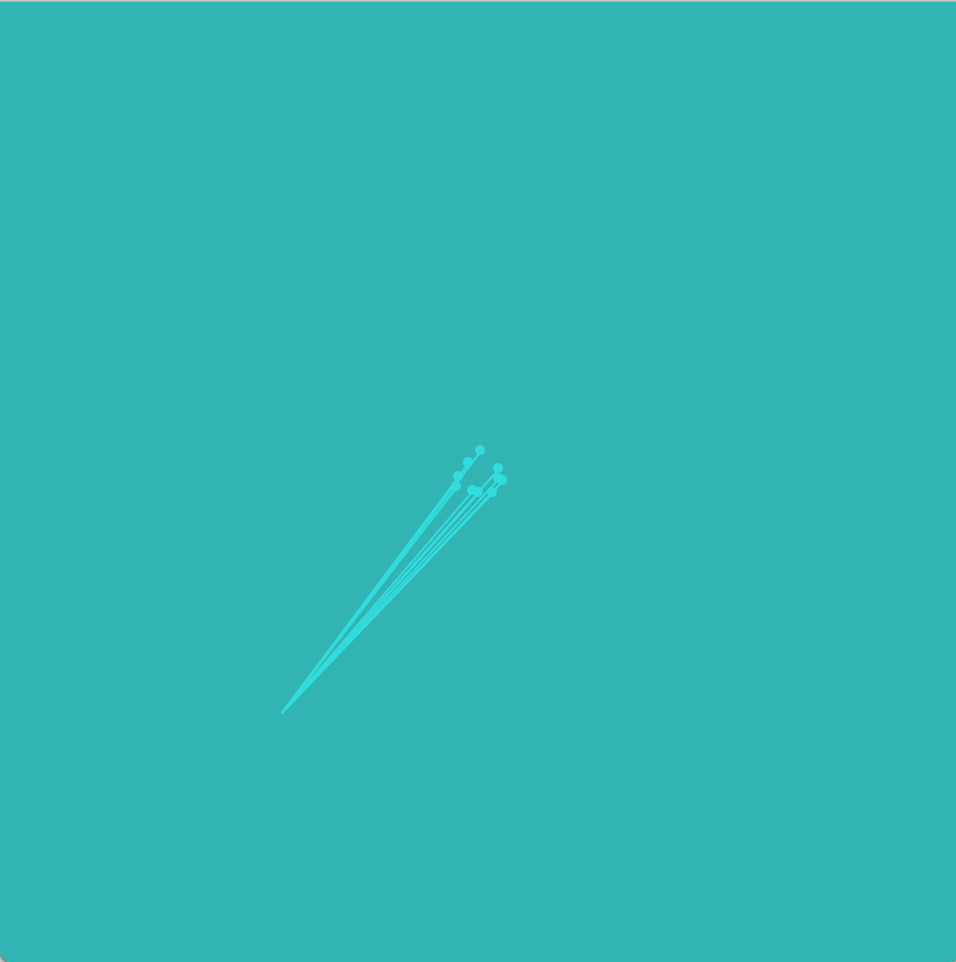
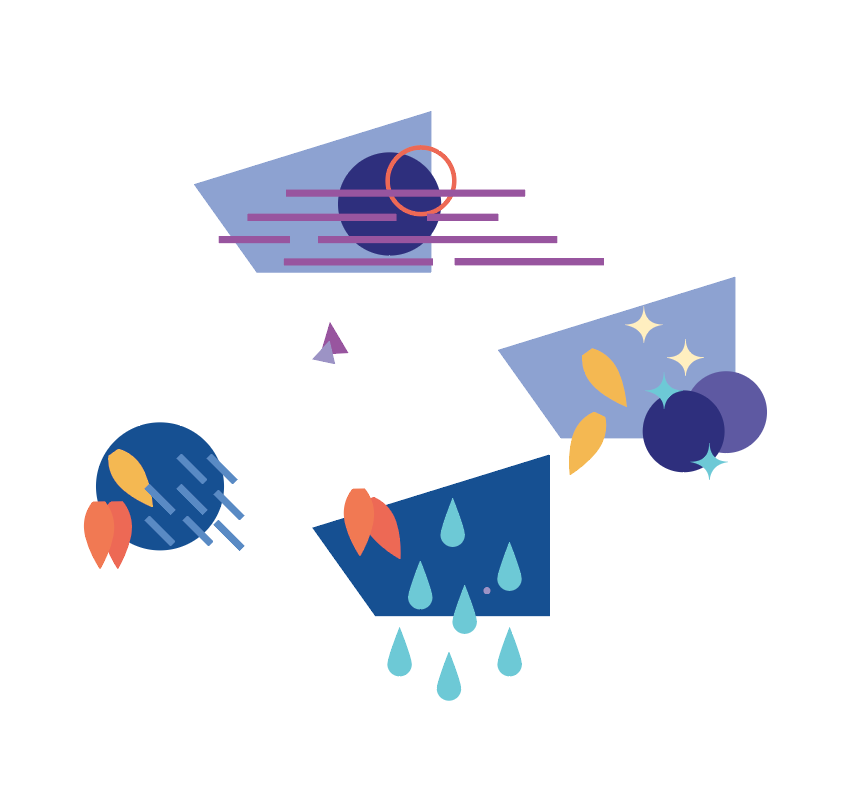
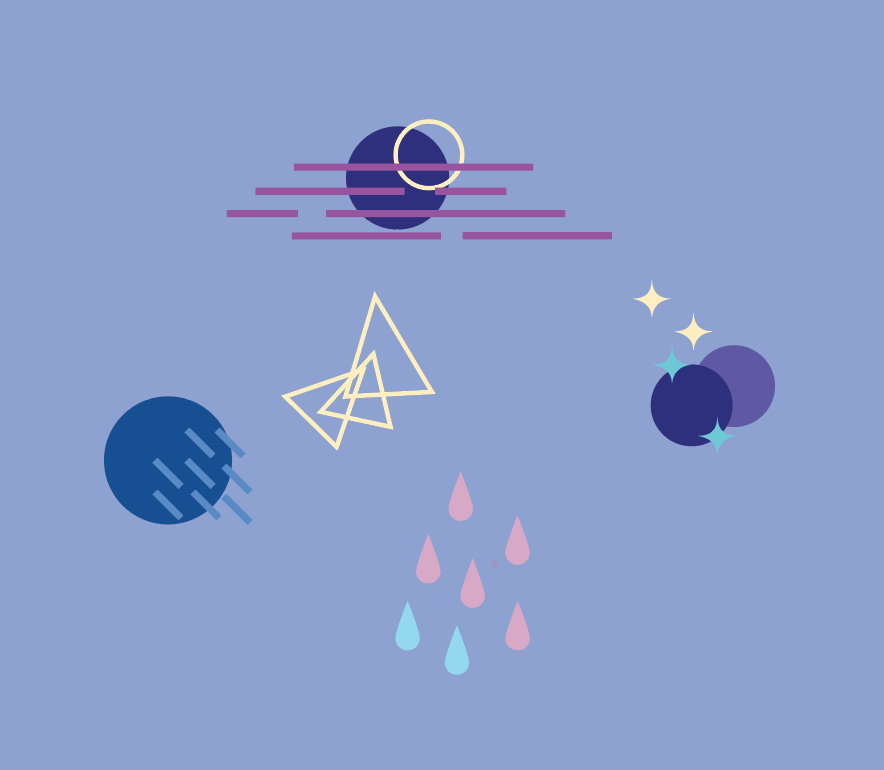
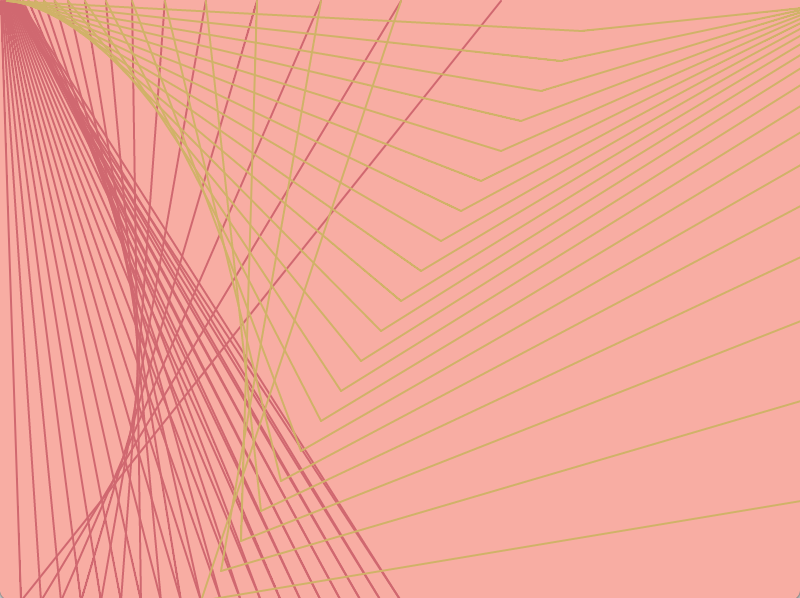
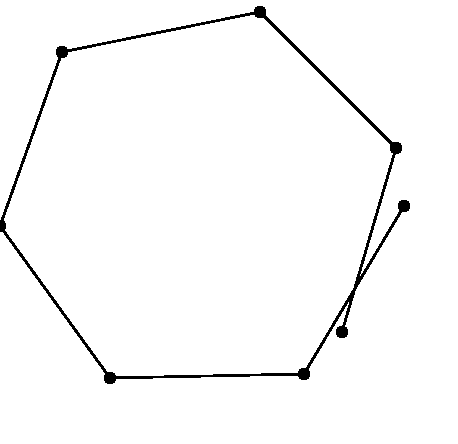
}I approached this project without a visual concept as I was unfamiliar with the curves and unsure of mathematical capabilities. Instead, I found a curve that I liked, the astroid, and decided to get to know what each variable in the function does.
I soon learned of variables that affected size and number of points, and decided the astroid fit the concept of a “star burst” both in nomenclature and form.
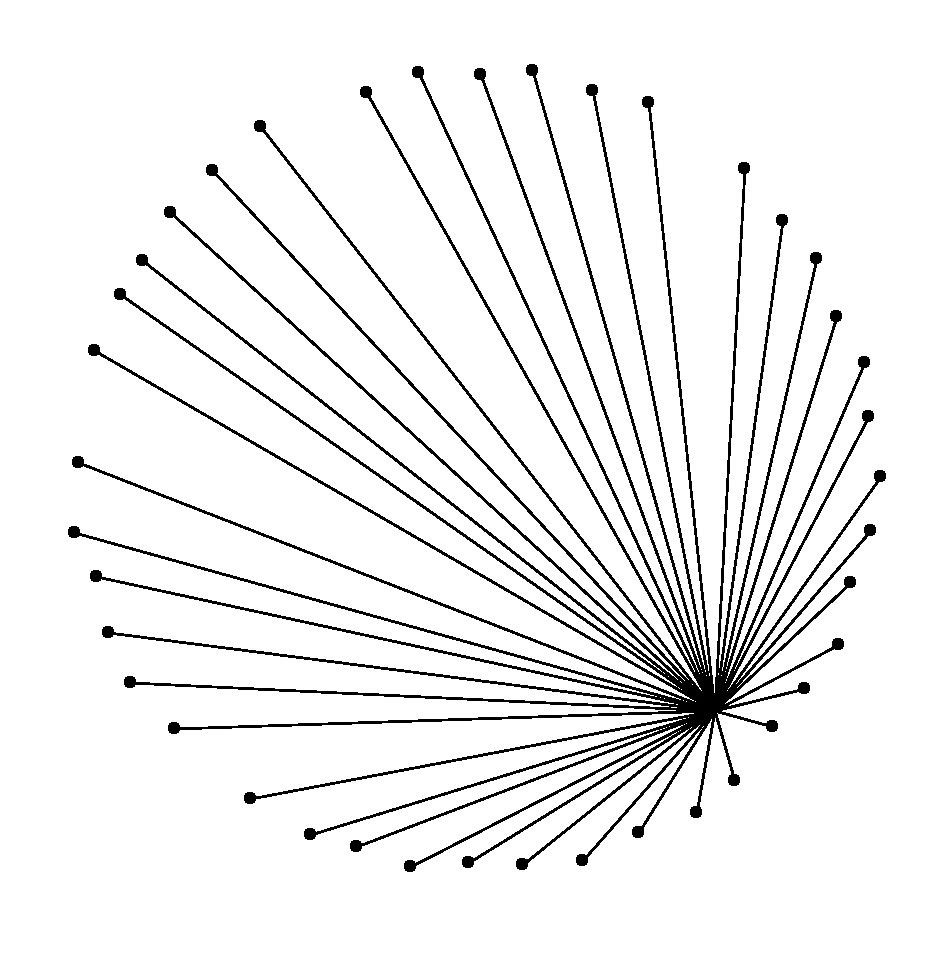
I added interactivity with position, size, amount, and color. I was able to incorporate objects into adjust the color by adjusting the “red” variable in the RGB codes.