Bettina-Project07-Curves-SectionC

sketch

// Bettina Chou
// yuchienc@andrew.cmu.edu
// Section C
// Project 07 Curves

bgCol = {"r": 200, "g": 180, "b": 180}; //background color
col = {"r": 200, "g": 220, "b": 220}; //color of dots and lines


function setup() {
    createCanvas(480,480);
}

function draw() {
    var nPoints = map(mouseX, 50, width, 1, 40, true); //varies the number of points 1 to 40
    var t = map(mouseY,0,height, 10, 400); //varies size of astroid
    var w = map(mouseY, 0, height, -100, 120); //moves center of lines left and right
    bgCol.r = map(mouseY,0,height,50,200);
    col.r = map(mouseY,0,height,50,200);
    background(bgCol.r, bgCol.g, bgCol.b);
    push();
    translate(240,235); //translate to center of canvas
    drawAstroidDots(nPoints, t, w);
    drawAstroidLines(nPoints, t, w);
    pop();
  
}

function drawAstroidDots(nPoints, t) {
    beginShape();
        for (var i = 0; i < nPoints; i++) {
            var x = t * cos(i)^3;
            var y = t * sin(i)^3;
            noStroke();
            fill(col.r, col.g, col.b);
            ellipse(x,y,5,5);
        }
    endShape();
}

function drawAstroidLines(nPoints, t, w) {
    beginShape();
        for (var i = 0; i < nPoints; i++) {
            var x = t * cos(i)^3;
            var y = t * sin(i)^3;
            if (nPoints > 1) {
                stroke(col.r, col.g, col.b);
                line(w,120,x,y); //draws lines from one center point to each dot
            }
        }
    endShape();
}

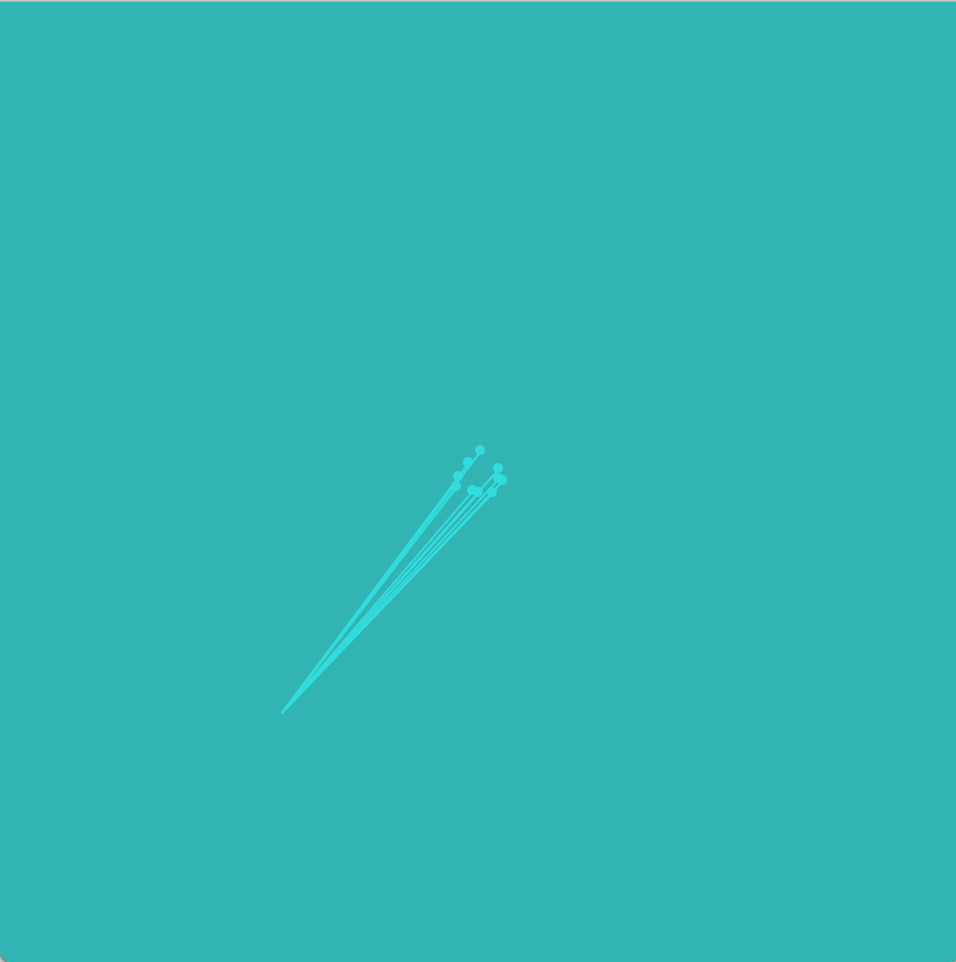
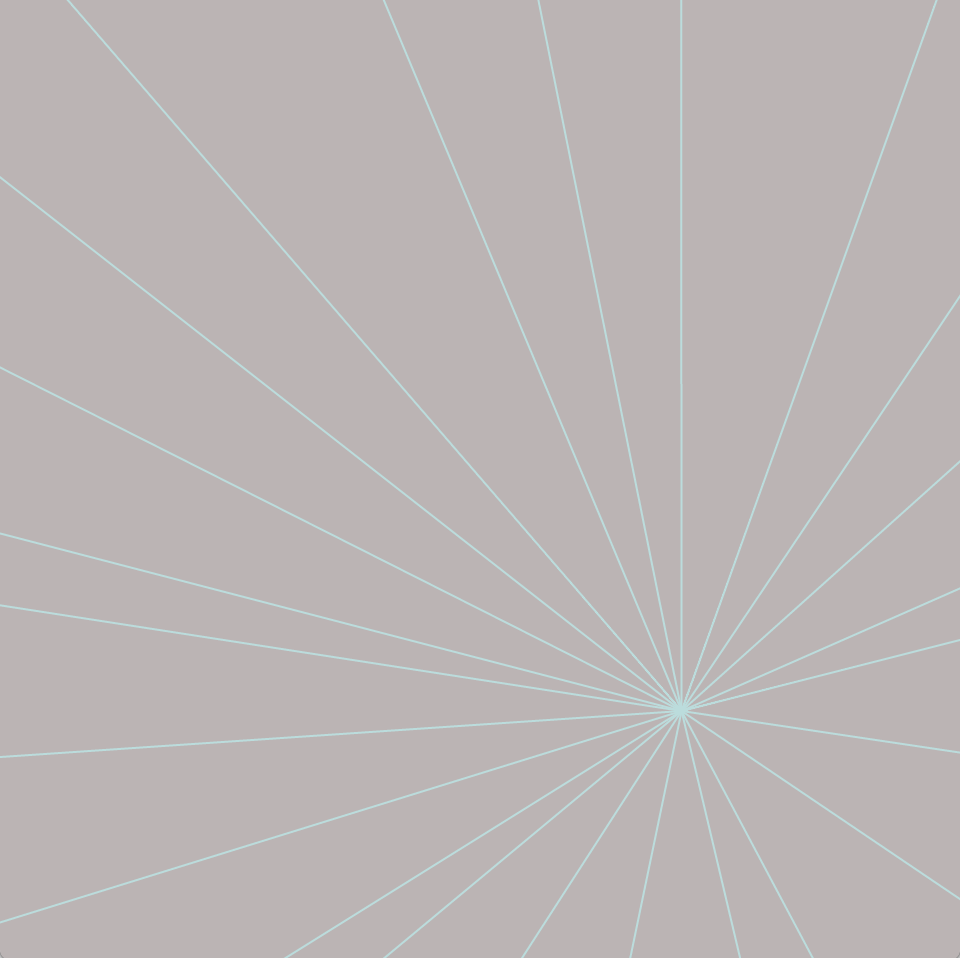
I approached this project without a visual concept as I was unfamiliar with the curves and unsure of mathematical capabilities. Instead, I found a curve that I liked, the astroid, and decided to get to know what each variable in the function does.

I soon learned of variables that affected size and number of points, and decided the astroid fit the concept of a “star burst” both in nomenclature and form.
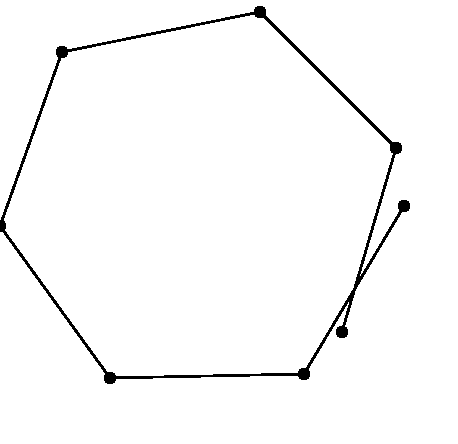
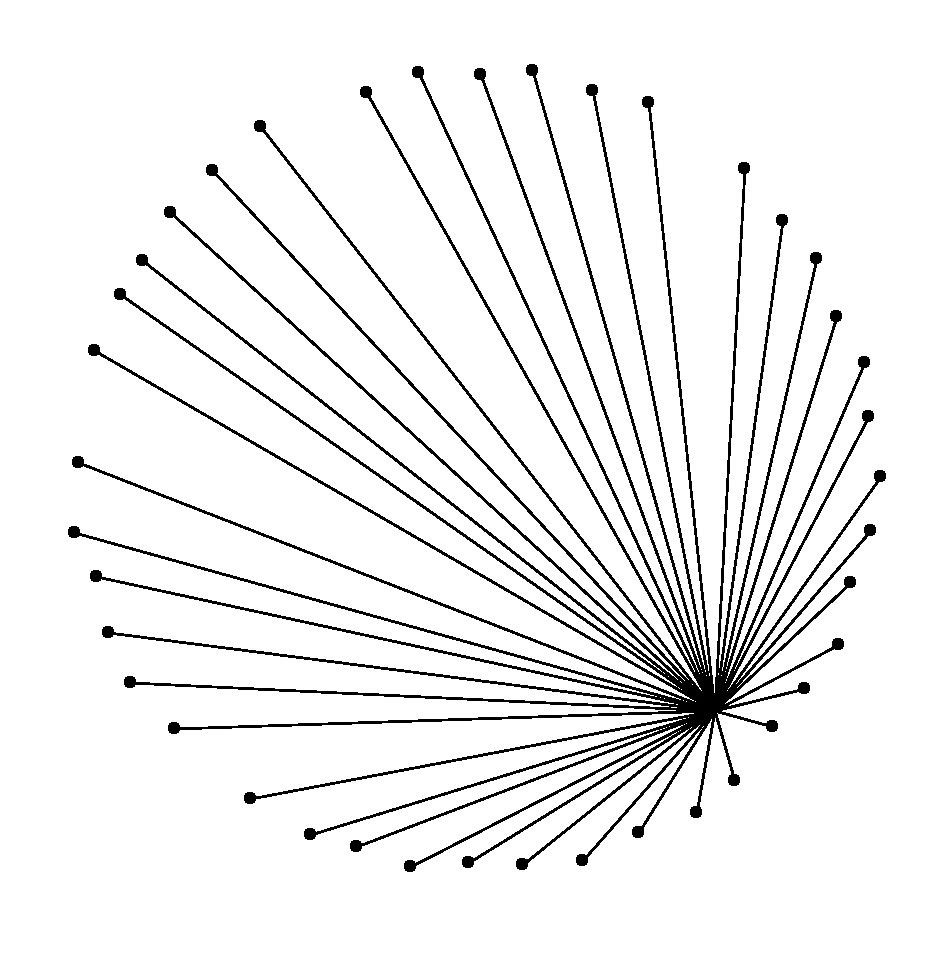
I added interactivity with position, size, amount, and color. I was able to incorporate objects into adjust the color by adjusting the “red” variable in the RGB codes.

Bettina-LookingOutwards-07

Screenshot of a person interacting with the project, “We Feel Fine”. Find the project page here, and the site itself here.

This interactive site, We Feel Fine, was made in 2005 and searches the internet every 10 minutes for expressions of human emotion on blogs and then displays the results these dynamic representations. Not only is the result beautiful, but this piece also helps connect people around the world by seeing others who share similar feelings as we are right now. I’d imagine to implement this, one would need to parse content from sites (perhaps use API’s?) but perhaps the logic would be similar to the concept of strings, and searching through each word in a string and matching them to words in emotion dictionaries. There could also be work with the d3.js library which is made for data visualization.

I also admire how this digital piece was also turned into a print piece. As a designer, I am always searching for how we bridge the gap between print and digital mediums, and this system seems to have either piece suit the medium quite well: the digital piece serves to collect and display data in real time, where as the print piece memorializes moments and interesting findings.

Bettina-Project-06-AbstractClock

sketch

var minuteCounterX = [];
var minuteCounterY = [];
var dy = [];
var col = [];

function setup() {
    createCanvas(150,480);
    background("#469f80");
    for (var m = 0; m < (60 - minute()); m++) {
        minuteCounterX[m] = random (5,140);
        minuteCounterY[m] = random (-10,20);
        dy[m] = random(1,3);
    }
}


function draw() {
    background("#469f80");
    secondsBall();
    for (var r = 0; r < 24 - hour(); r++) { //number of squares is hours left in day
        rectangles(r);
    }
    minutePetalsDraw(minuteCounterX,minuteCounterY);
}
    
function minutePetalsDraw(minuteCounterX,minuteCounterY) { //number of circles equals number of minutes left in the hour
    noStroke();
    for (m = 0; m < (60 - minute()); m++) {
          if (m%4 === 0) {
              fill("#fba919");
        }
          else if (m%4 == 1) {
              fill("#ef5b30");
        }
          else if (m%4 == 2) {
              fill("#96b9e2");
        }
          else {
              fill("#434b9f");
        }
        ellipse(minuteCounterX[m],minuteCounterY[m],10);
        minuteCounterY[m] += dy[m];
        if (minuteCounterY[m] > 480) {
          minuteCounterY[m] = 0;
        }
    }
}


function secondsBall() { //ball appears every other second and grows smaller as the minute passes
    frameRate(60);
    noStroke();
    fill("#e47884");
    if (second()%2 === 0) {
      ellipse(115,30,120 - (second()*2));
    }
}

function rectangles(r) { //number of squares remaining equal number of hours remaining in day
    frameRate(60);
    stroke("#f6f0b8");
    strokeWeight(2);
    noFill();
    rectMode(CENTER);
    push();
    translate(75,30+(r*18)); //each square is 18 pixels apart from center
    angleMode(DEGREES);
    rotate(millis()/45+(r*10)); //each square is 10 degrees apart from the other; number chosen for aesthetics
    rect(0,0,25,25);
    pop();
}

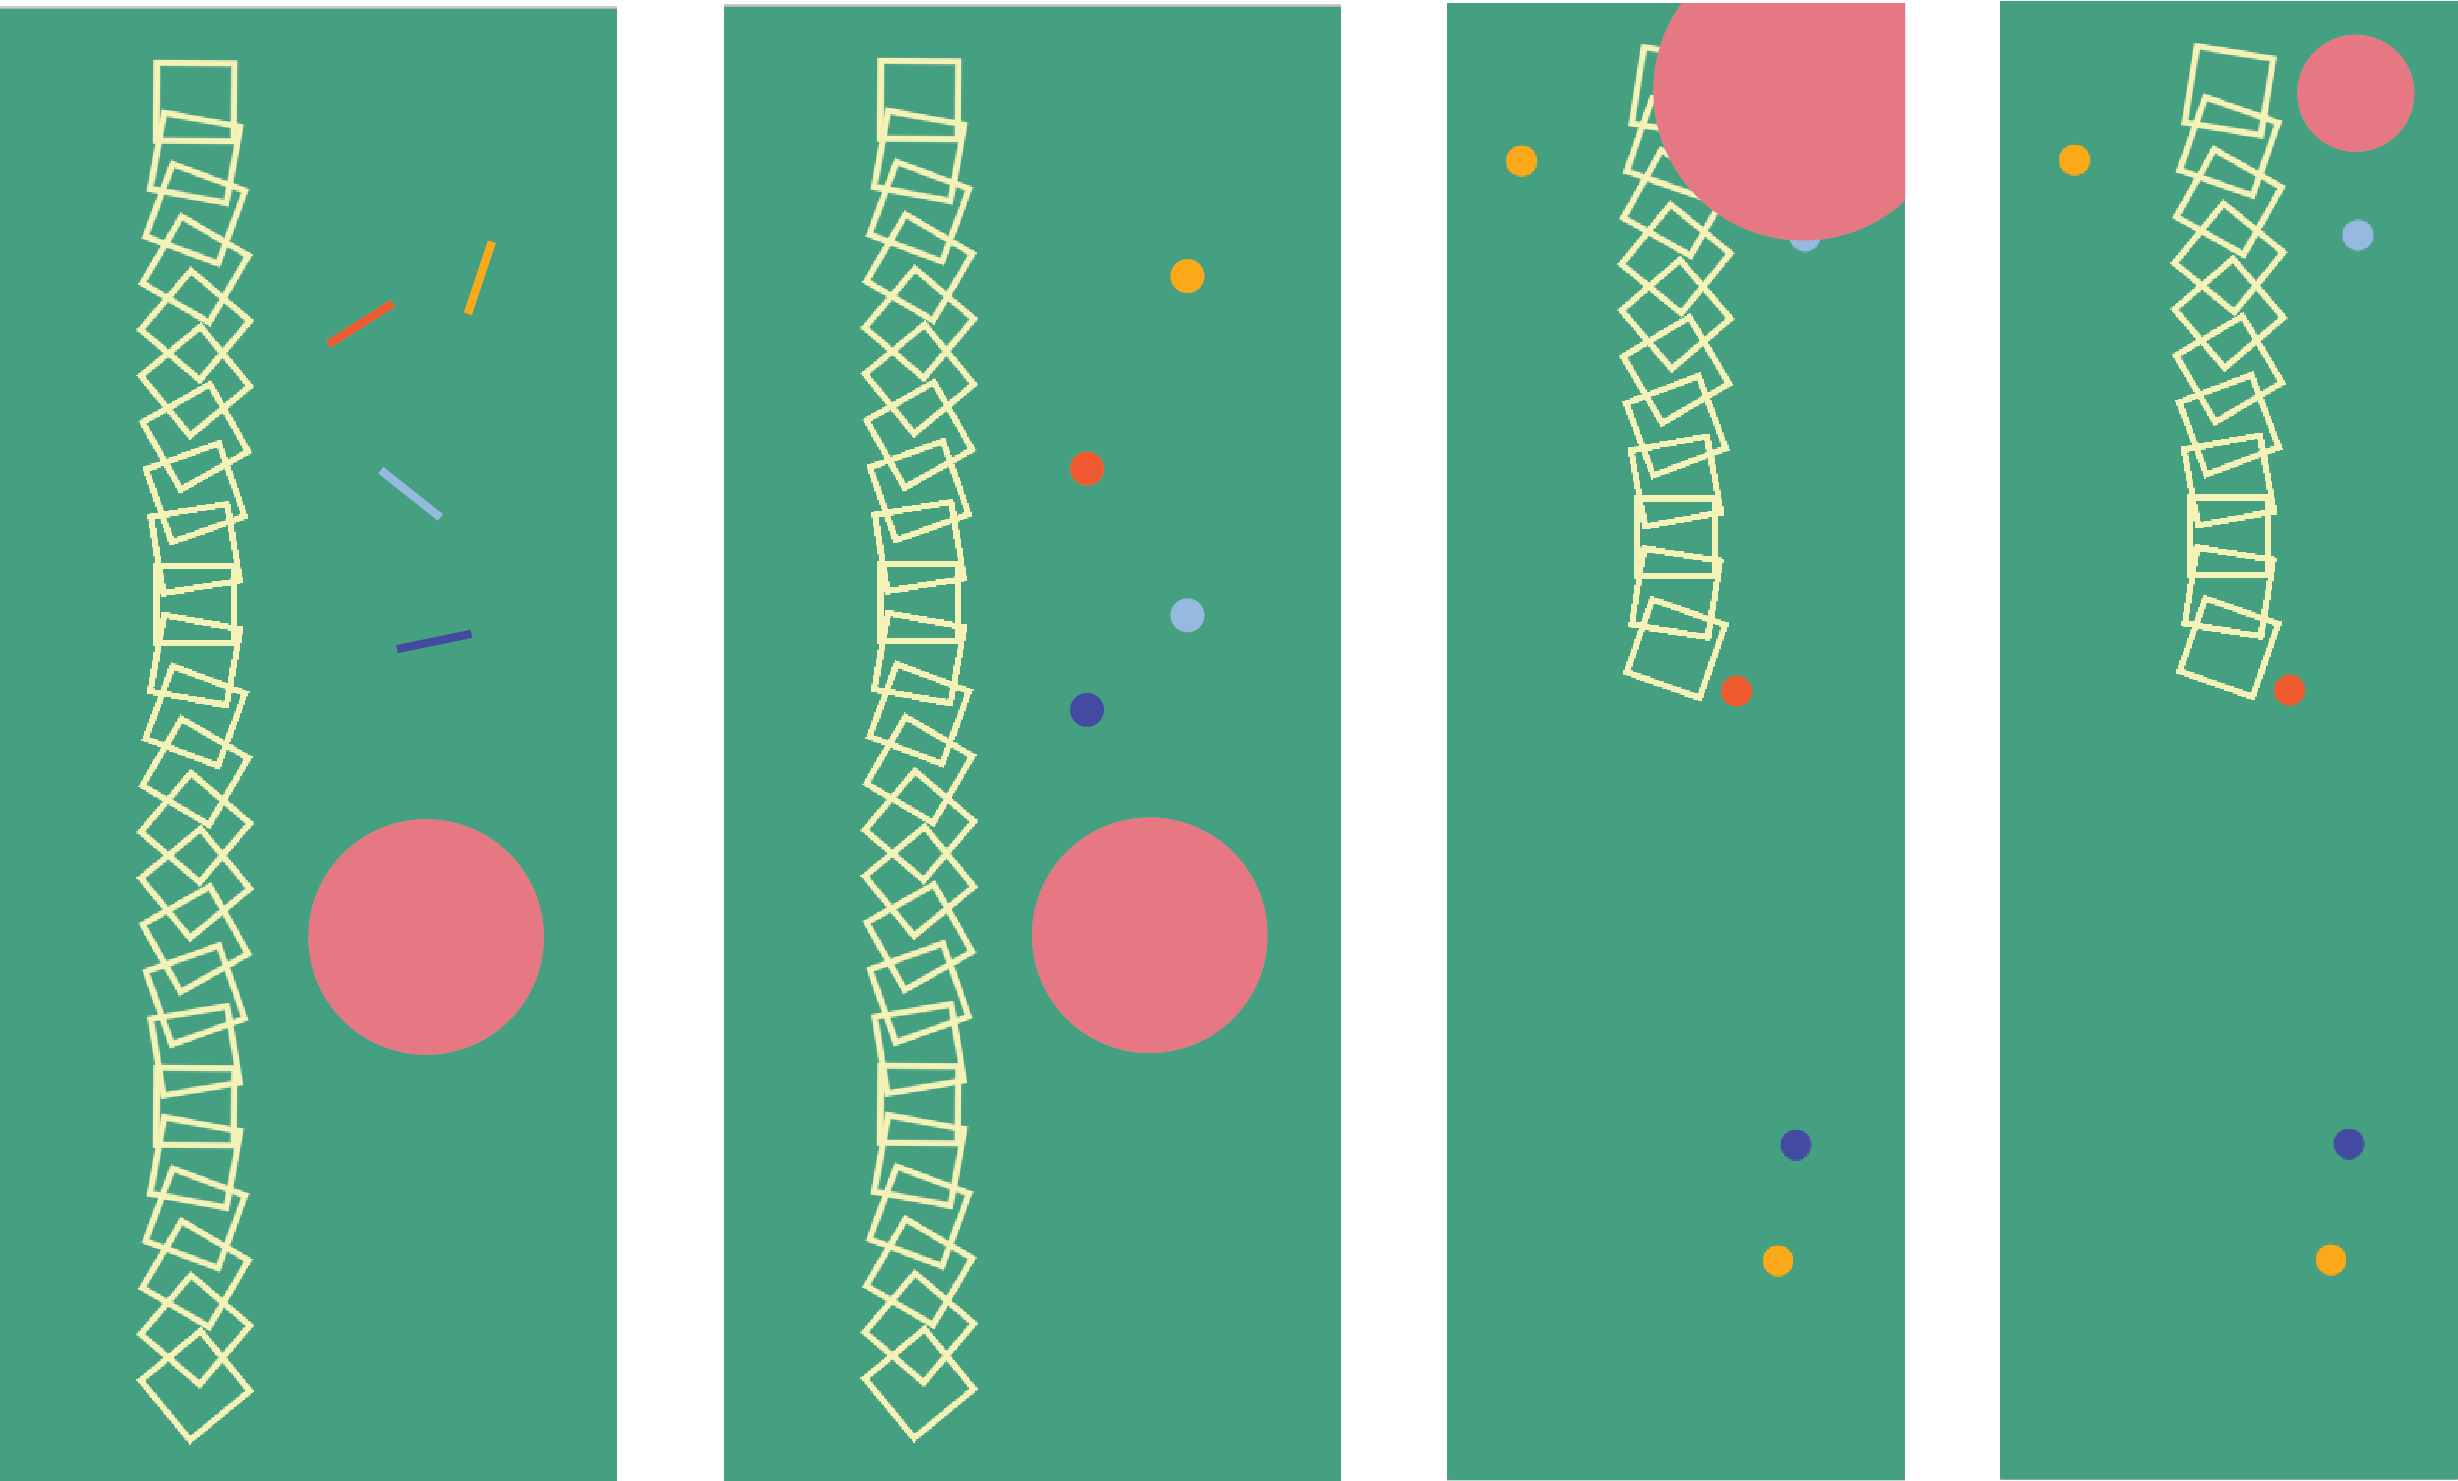
I wanted my designs to follow the concept of visualizing “time left” as opposed to “time passed”. We often view the positive space of things (the black ink that forms the letter) as opposed to the negative space (the white around a letter that comes together to form the black). I played with various geometric shapes and compositions, and had fun experimenting with color.

The rotating squares represent the number of hours left in the day; the confetti circles represent the number of minutes left in the hour, and the size of the blinking circle, which appears and disappears every second, correlates to the number of seconds left in the minute.

The confetti circles was a bit of a challenge. I had tried using a for loop to initialize an array of x and y coordinates; however, I had initially put the for loop in the draw function. As a result, the circles kept on being redrawn and “spazzing”. After trying (with no avail) to set conditions for when the for loop would redraw, I learn that I’d needed to put the for loop in the setup function.

Something I still don’t quite understand is that even though the setup function is called once, the array still changes with the minute. Thus, does the setup function change if the parameters inside it change? When I’d tried printing the minute or second in the setup function, the value in the console didn’t change even as the minute and second did.

Above are some sketches I did for color and composition

Bettina-LookingOutwards-06-SectionC


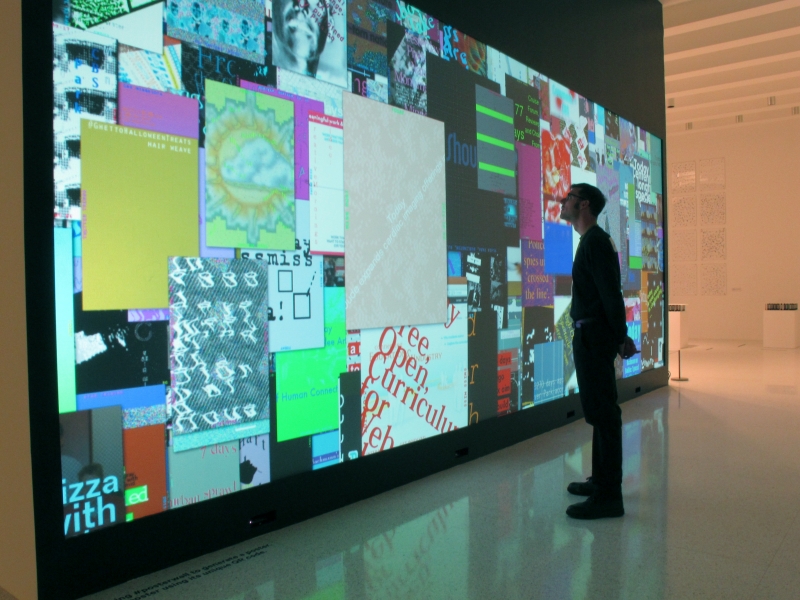
Generative poster wall display
, an installation created by Dutch design company Lust Design.

This installation generates hundreds of unique posters from various internet sources, and new posters are generated when a new visitor enters/interacts with the space. In this way, the project is random not necessarily because the code itself calls random variables (i.e. when we set a value to random()) but because the conditions under which items are generated on random: one cannot predict when and how people will interact with the exhibit or what content will be available online at that time. Surely, there are still set constraints, but the dependence on audience interaction makes this piece feel as if viewers take part in creating the art. I admire how the system needs to have a level of ambiguity to adapt to visitor interactions– that concept is reminiscent of how designers are taught to be comfortable with ambiguity as well. According to the studio’s site, the piece was implemented using a series of kinects. I’d be interested in learning to code with hardware, such as arduino or raspberry pi. My impression is that using such components allows one to create more spatial and interactive pieces instead of experiences on a laptop screen.

Bettina-Project05-Wallpaper-SectionC

sketch

// Bettina Chou
// yuchienc@andrew.cmu.edu
// Section C
// Project 5 Wallpaper

function setup() {
  createCanvas(480,480);
  background("#8ca1d2");
  for (var y=0;y<7;y++) {
    if (y%2===0) { //every odd row
          for (var x = 0; x < 5; x++) {
              var ty=y;
              var tx=x;
              drawTriangles(tx,ty);
              drawTrianglesTwo(tx,ty);
              HorizontalLines(tx,ty);
              TearDrops(tx,ty);

          }
      }
      else {
        for (var x = 0; x < 4; x++) { //every even row
              var tx=x+.5; //shifts every other row to the right
              var ty=y;
              drawTriangles(tx,ty);
              drawTrianglesTwo(tx,ty);
              HorizontalLines(tx,ty);
              TearDropsTwo(tx,ty);
          }
      }
  }
  noLoop();
}

function TearDrops(tx,ty) {
  var TearCounter=random(3); //only draws about a little under half of the tears
  if (TearCounter>1.75) {
  fill("#728fc9");
      noStroke();
      push();
      translate((tx*100)+50,(ty*50)+random(50));
          beginShape();
          curveVertex(50,80);
          curveVertex(50,80);
          curveVertex(58,102);
          curveVertex(50,110);
          curveVertex(42, 102);
          curveVertex(50,80);
          curveVertex(50,80);
          endShape();
      pop();
  }
}

function TearDropsTwo(tx,ty) {
  var TearCounter=random(3);//only draws about half of the tears
  if (TearCounter>1.5) {
  fill("#728fc9");
      noStroke();
      push();
      translate((tx*100)-random(10,50),(ty*50)+random(70));
          beginShape();
          curveVertex(50,80);
          curveVertex(50,80);
          curveVertex(58,102);
          curveVertex(50,110);
          curveVertex(42, 102);
          curveVertex(50,80);
          curveVertex(50,80);
          endShape();
      pop();
  }
}

function drawTriangles(tx,ty) {
  noFill();
  stroke("#ffefbd");
  strokeWeight(2);
  push();
  translate(tx*95,ty*65);
  triangle(50, 25, 65, 47, 35, 47);
  pop();
}

function drawTrianglesTwo(tx,ty) {
  noFill();
  stroke("#ffefbd");
  strokeWeight(2);
  push();
  translate(tx*95,(ty*65)+10); //draws the second in the pair that's translated in the y-direction
  triangle(50, 25, 65, 47, 35, 47);
  pop();
}

function HorizontalLines(tx,ty) {
  noFill();
  stroke("#194e93");
  strokeWeight(3);
  var lineCounter=random(3); //only draws about less than half of line groups
  if (lineCounter>1.85) {
  push();
  translate((tx*80)-20,(ty*60)-random(10,20));
  line(65,70,110,70);
  line(50,80,80,80);
  line(95,80,120,80);
  line(85,90,105,90);
  pop();
  }
}

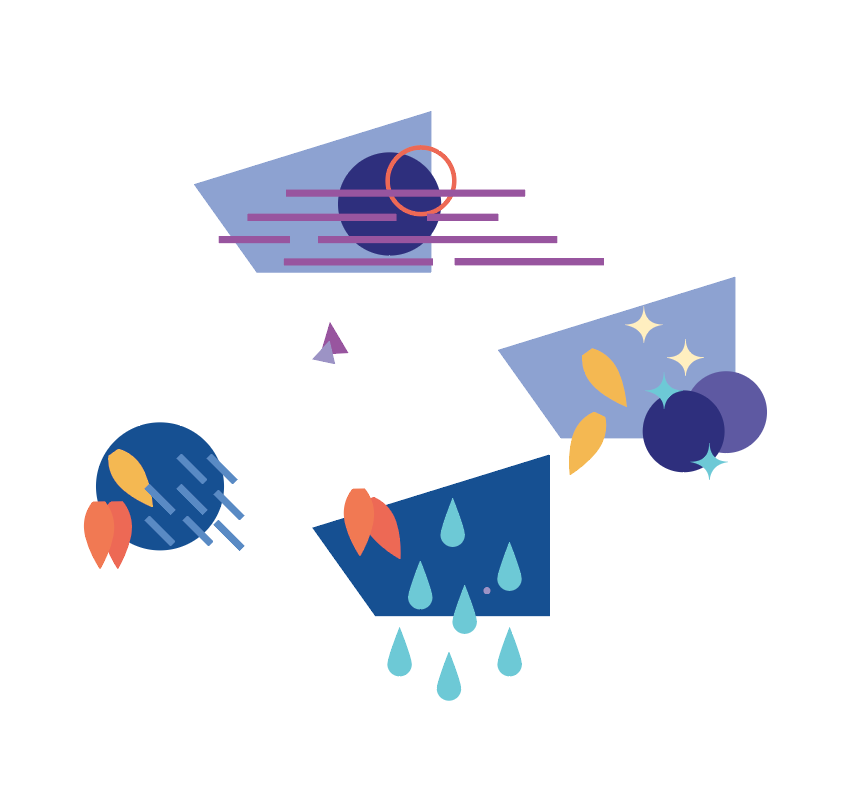
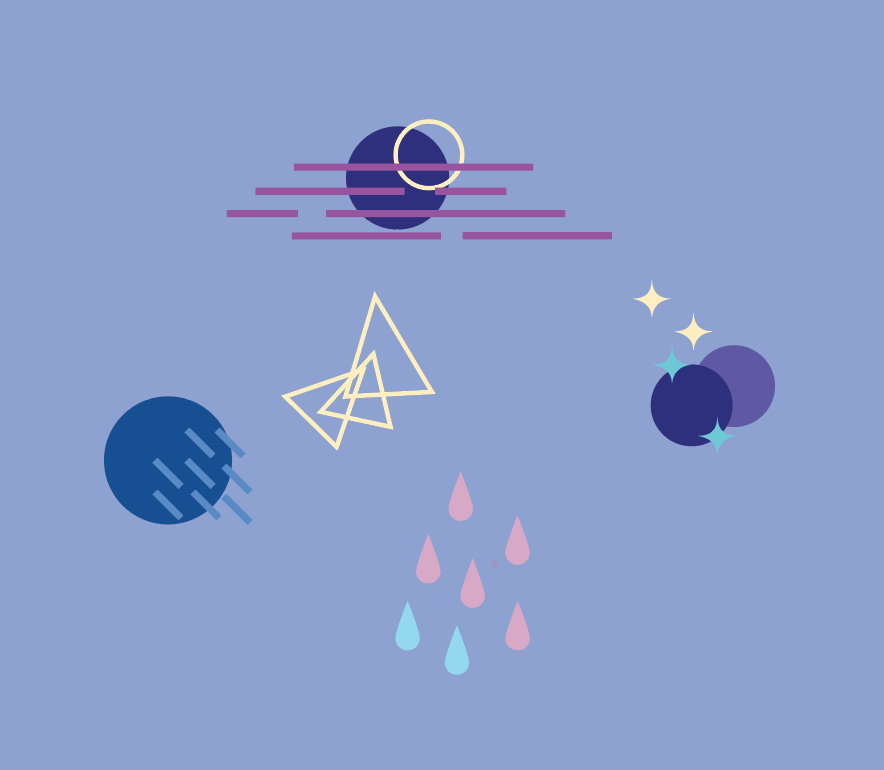
I was inspired by the chilly fall evenings to create a pattern that symbolized the weather. I first sketched a variety of geometric and organic shapes in illustrator and developed a color palette. I simplified the shapes to create more abstract representations of rain, stars, and clouds. Wanting to create something aligning with the characteristics of code (as opposed to trying to “pixel-push”) I realized that mathematical patterns are a key speciality of code. I was inspired by the assignments to create a pseudo-hexagonal grid for all of my elements, and added random omissions and translation variations using conditionals. (try refreshing, the pattern will vary each time!)

Bettina-LookingOutwards_05

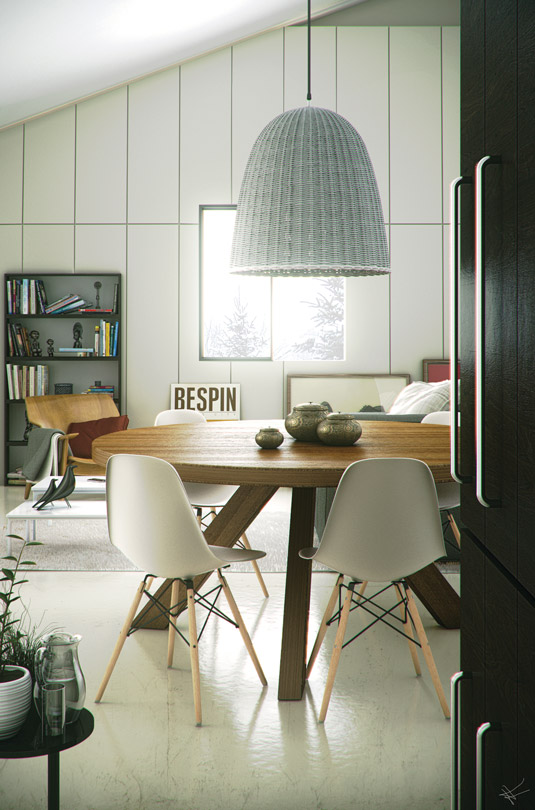
This image is from the same site as the Ebola rendering example. It is by Tiago Alexandrino who creates architectural visualisations for private clients. Taking just five or six days, he created this scene using 3ds Max and V-Ray.

I appreciate this for it’s application. Many 3D graphics are impressive, creating hyperrealistic portraits or adding depth to video game or movie characters. But, I think this work represents our potential with using virtual reality in our everyday lives. Imagine this: instead of showing still images, one could create an entire building design for Google Cardboard and allow clients to step into their ideas before it’s ever built. This concept of presenting the future could work in policy-making as well– we could build ideal or unfavorable scenarios and show those as an additional way to persuade others. Showing the future would serve as powerful fodder to instill motivation and action amongst people.

Bettina-Project04-SectionC

sketch

// yuchienc@andrew.cmu.edu
// Section C
// project 4--stringart

function setup() {
  createCanvas(400,300);
}

var bgColor='#f8ada3'
var fuschia='#d06870'
var lightBlue='#86b5c6'
var ochre='#d0b268'

function draw() {
  background(bgColor);
  fuschiaCurve(mouseX);
  lightBlueCurve(mouseX);
  ochreCurve(mouseX);
}

function fuschiaCurve(mouseX) {
  var x1=mouseX;
  var y1=0;
  var x2=10;
  var y2=300;
  var x3=250;
  var y3=0;
  var cmx=constrain(mouseX,75,500);
  for (i=0;i<400;i+=20) {
    stroke(fuschia);
    line(x1,y1,x2,y2);
    line(x2,y2,x3,y3);
    x1+=.5;
    x2+=10;
    x3*=.8;
  }
}

function lightBlueCurve(mouseX) {
  var x1=10;
  var y1=300;
  var x2=250;
  var y2=0;
  var x3=x2+20;
  var y3=300;
  var cmx=constrain(mouseX,100,500);
  for (i=0;i<300;i+=50) {
    stroke(lightBlue);
    line(x1,y1,x2,y2);
    line(x2,y2,x3,y3);
    x1+=20;
    x2+=cmx/25;
    x3=x2+20;
  }
}

function ochreCurve(mouseX) {
  var x1=150;
  var y1=300;
  var x2=300;
  var y2=0;
  var cmx=constrain(mouseX,100,500);
  for (i=0;i<260;i+=20) {
    stroke(ochre);
    line(x1,y1,x2,y2);
    x1+=cmx*.05;
    x2+=cmx*.05;
  }
}

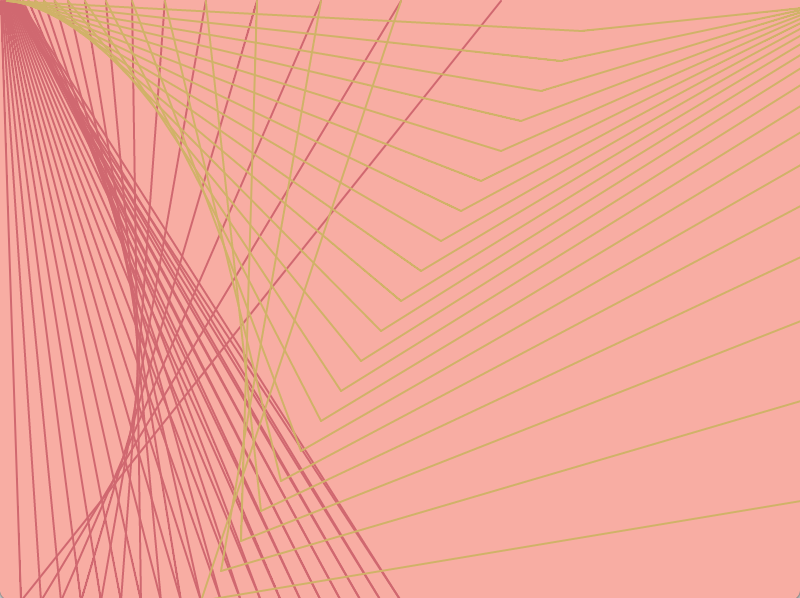
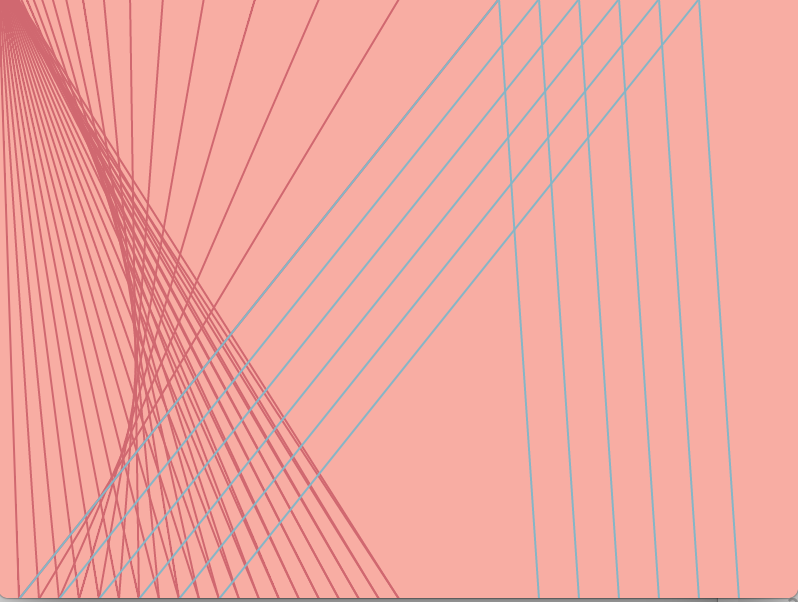
My previous projects, I had sketched a clear visual and then figured out the code to execute it. This time, I wanted to embrace the nature of code and draw something directly in p5 without sketching ideas prior. I’d used the print statement to find the values for x and y at certain points in the loop so I could use those values for other curve functions. I spent the most time adjusting the increments to x and y so the composition outcome was balanced. Some process pictures are below.


I also added an interactive portion, building off of last week’s assignment, so the positions of certain coordinates varied with mouseX.

Bettina-LookingOutwards-04-SectionC

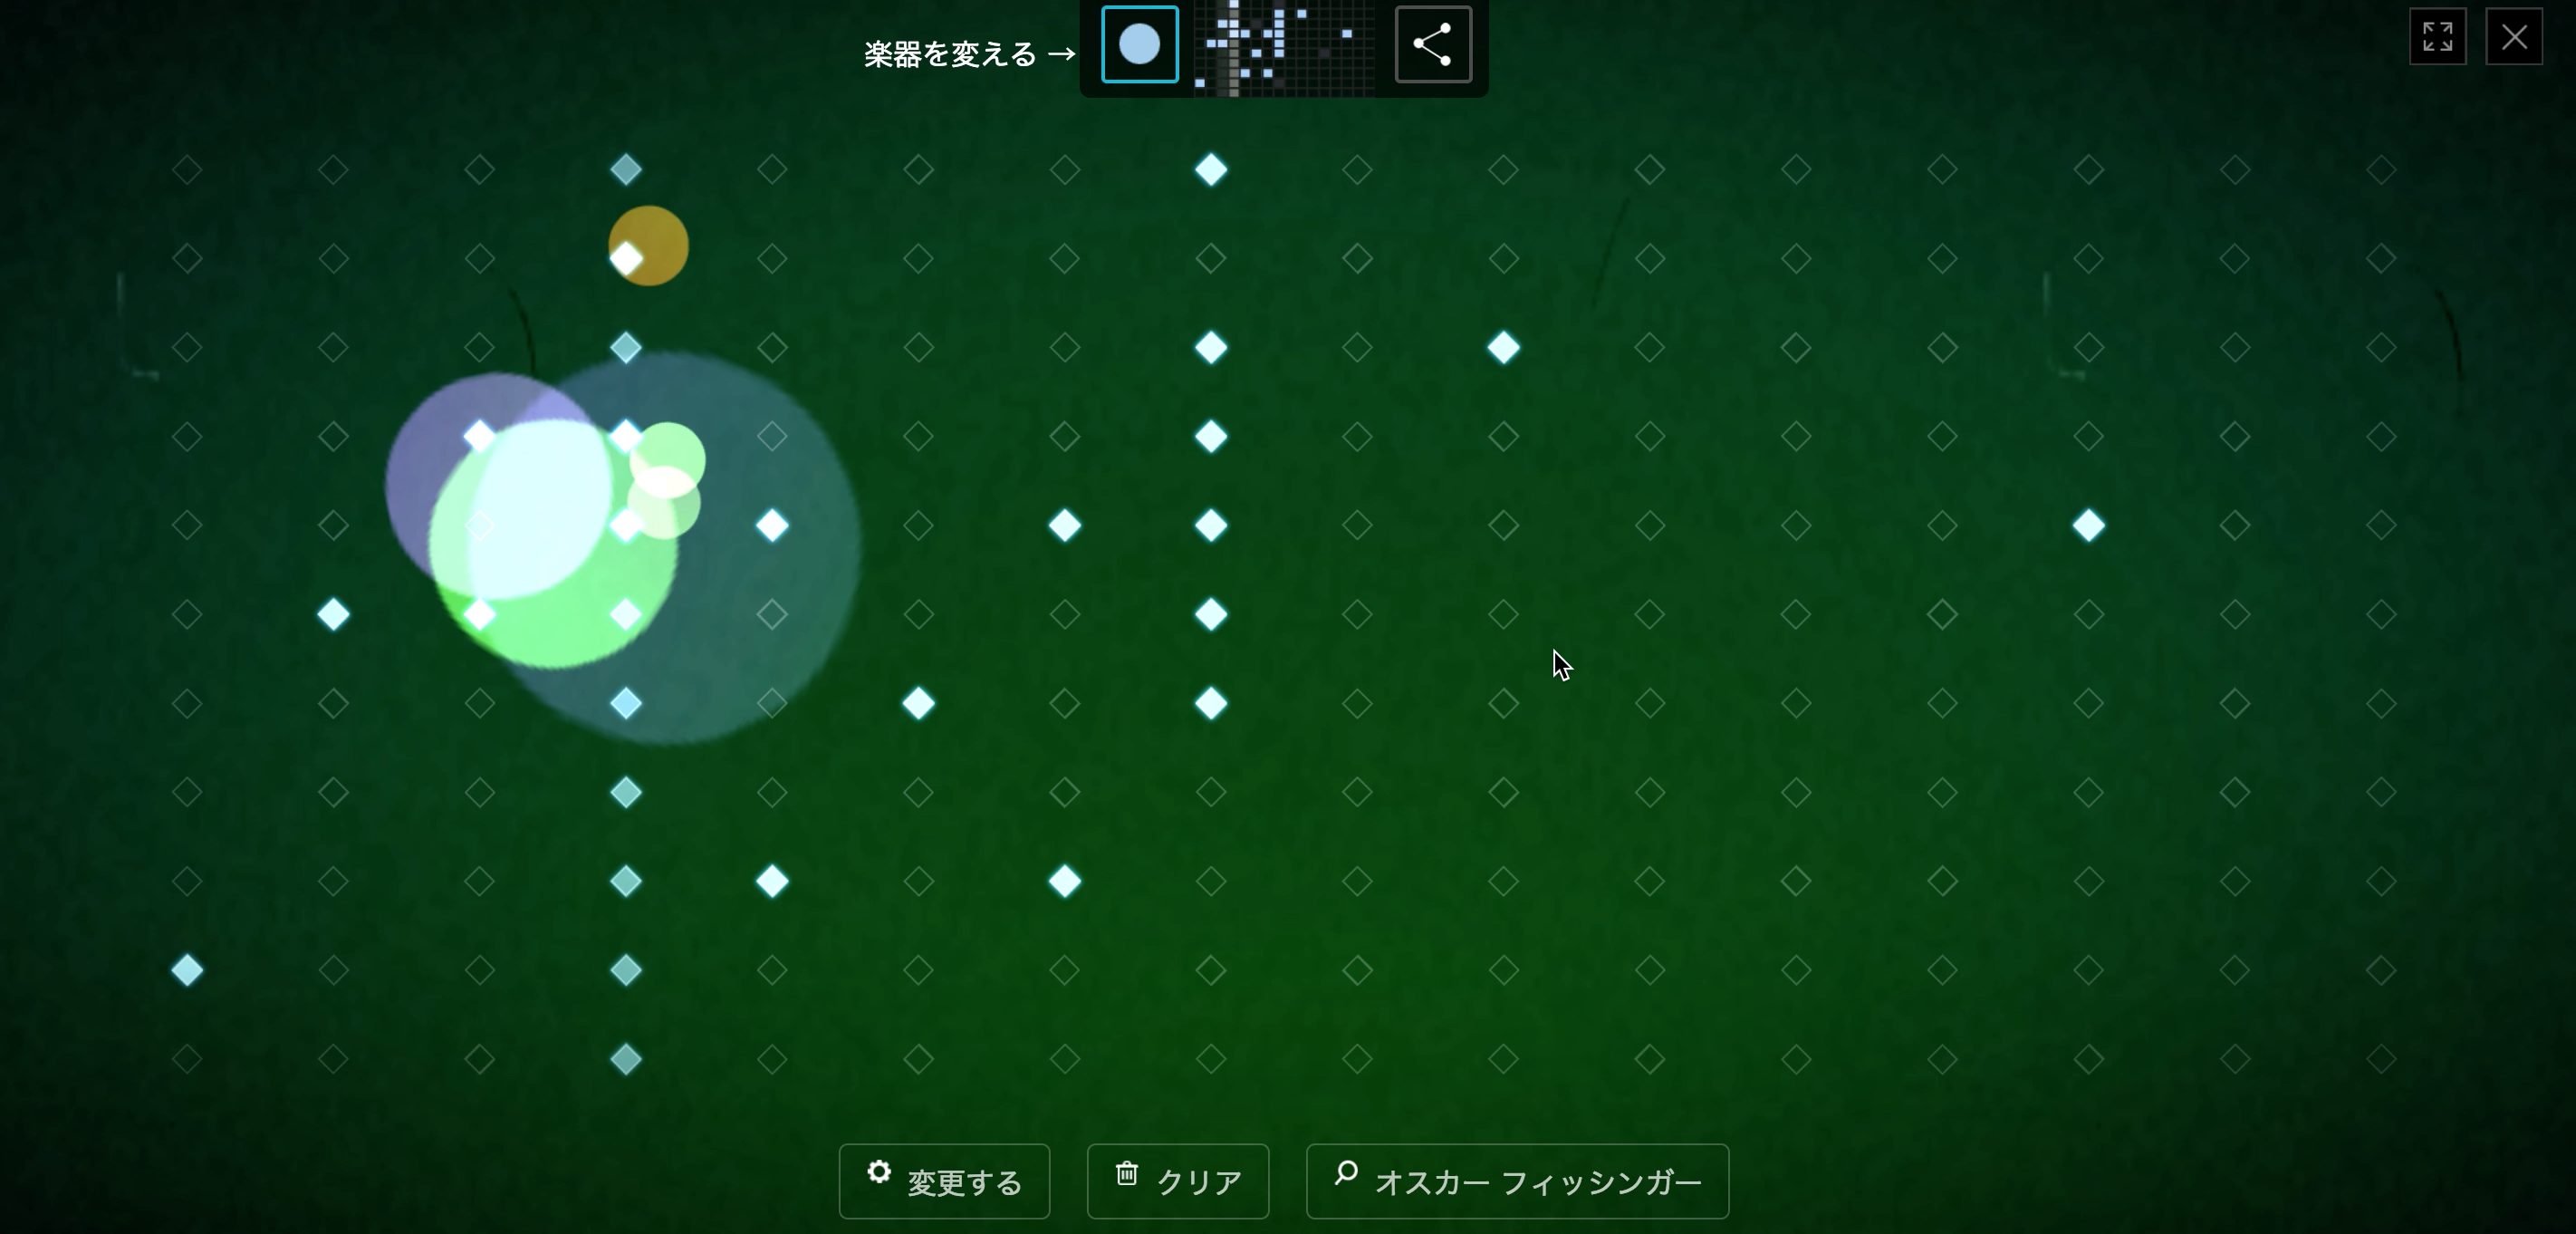
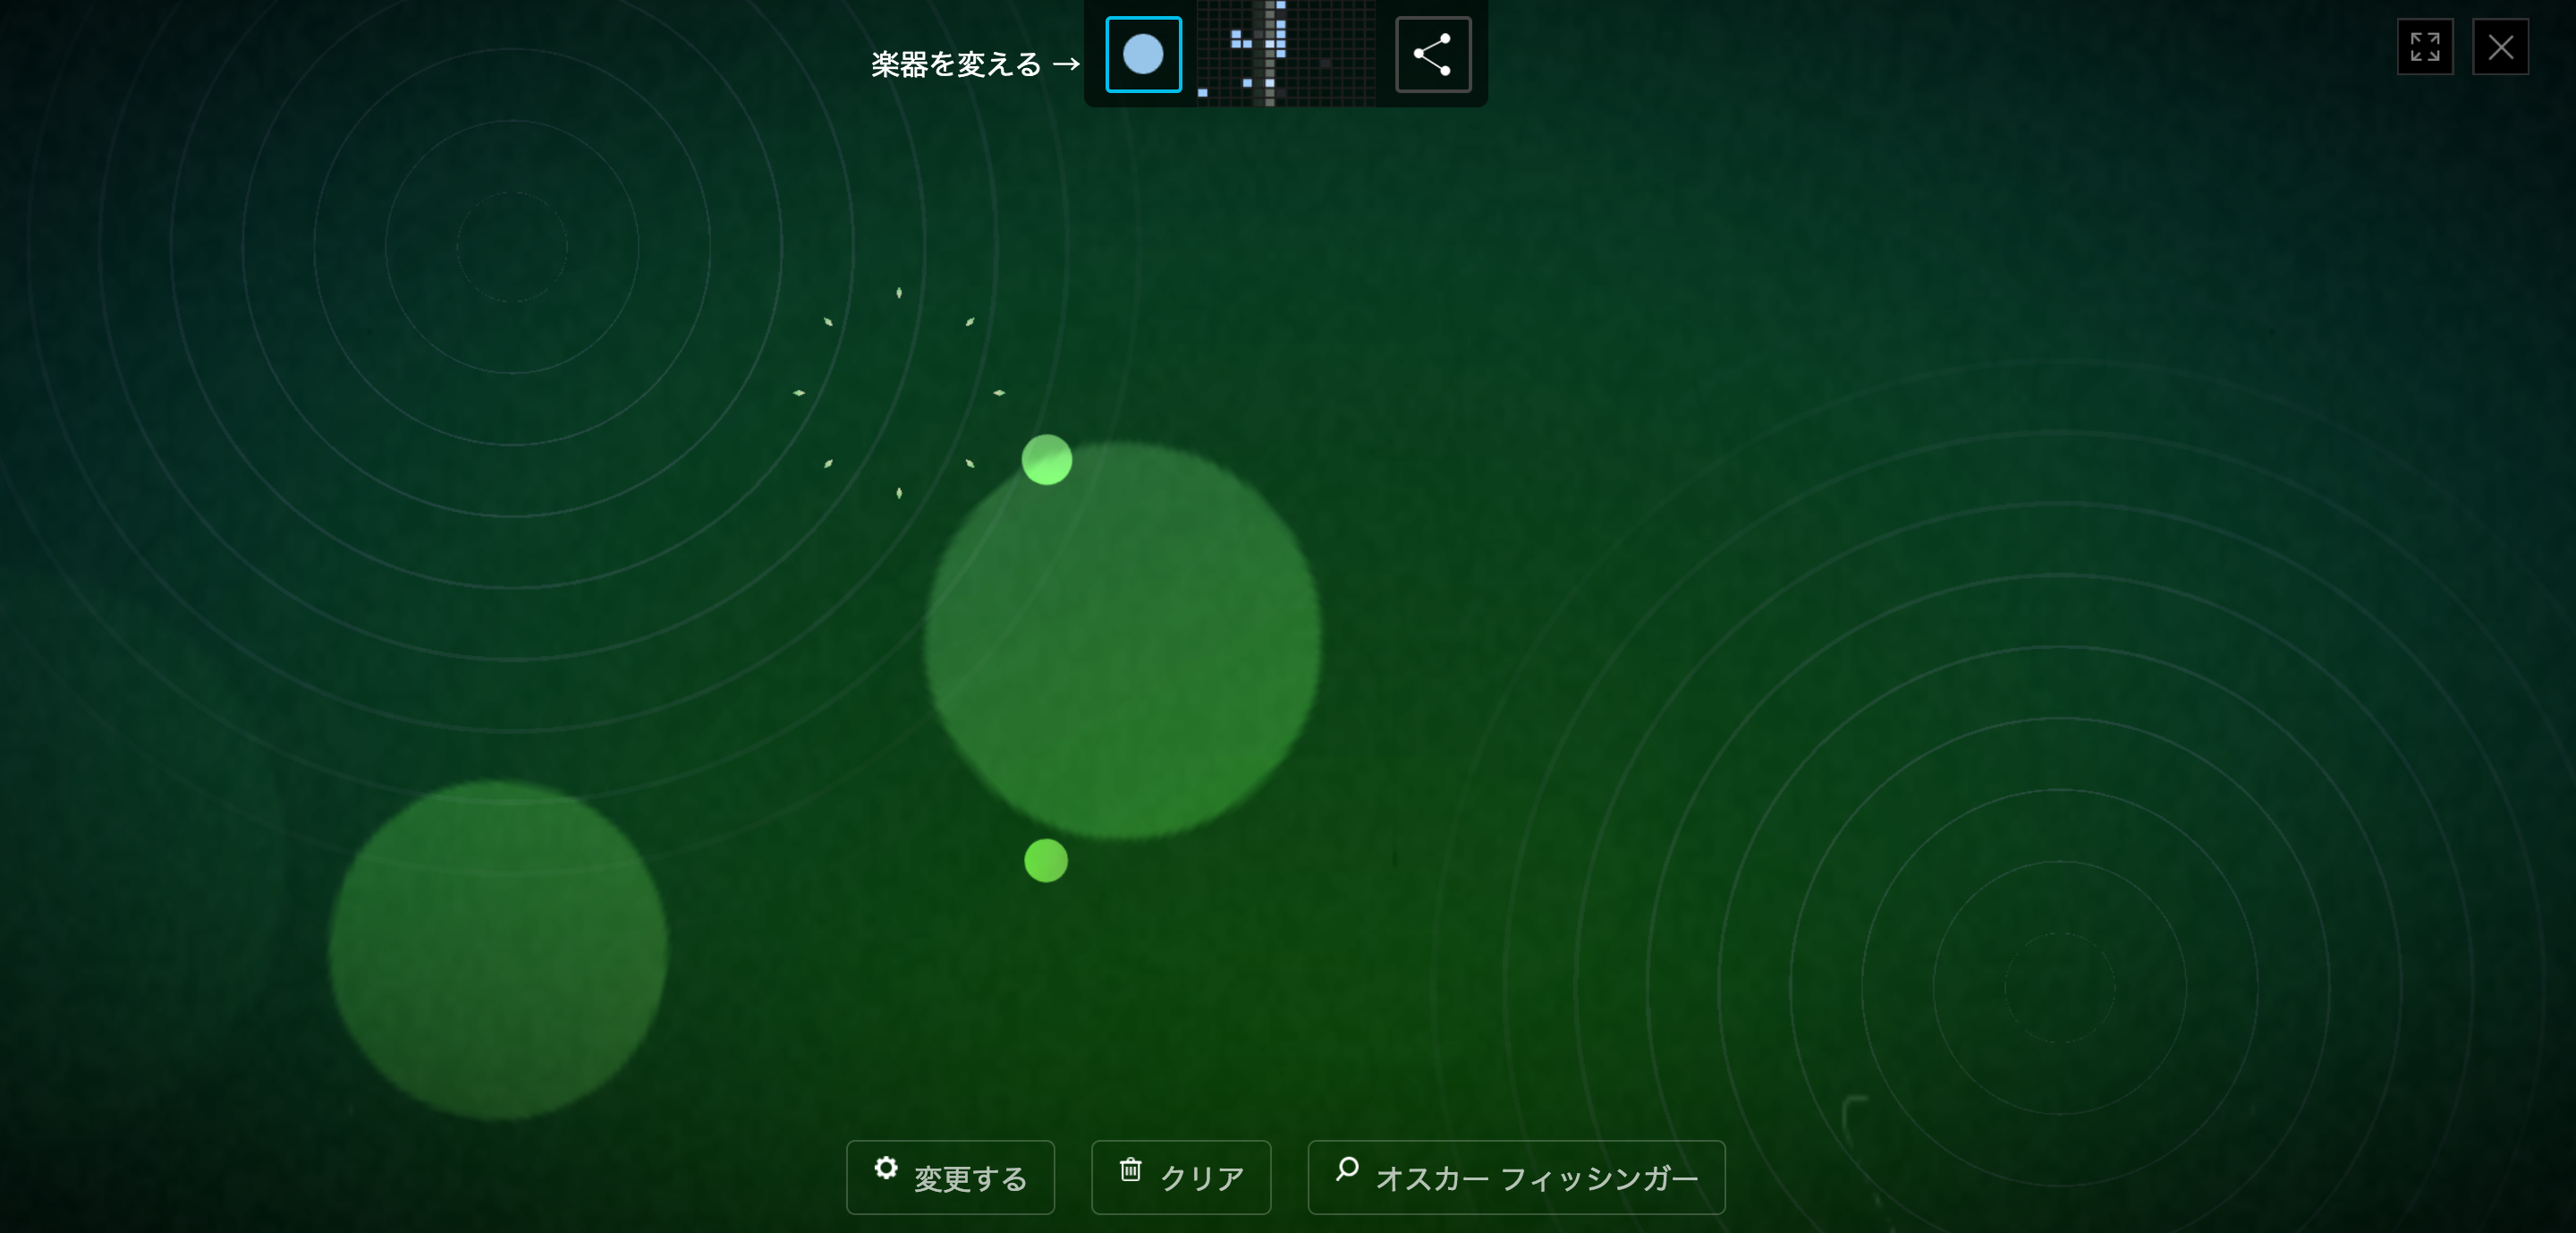
Screenshot from the interaction Google Doodle page

Google Doodle

This Google Doodle released by Japan has a grid of rhombuses the user can click or unclick. A vertical bar travels across the columns “playing” the “notes” of clicked rhombuses the user has selected. I’m fascinated by how such a simple interaction/interface transcends language (I have no idea what the context of this piece is) and is accessible to anyone. A casual user can press random keys and enjoy various tunes. Someone with a trained ear can figure out the key the notes are in, which buttons correspond to which notes, and try to compose a piece. The geometric, abstract visuals are reminiscent of fireworks, not unlike the magical shows one might see at Disney!

Given my current knowledge of javascript, I could see something like this being constructed with conditionals and the playing controlled by for loops. However, I am eager to learn how to program UI animations such as fades and light-ups in a compact way!

Bettina-Project03-SectionC

sketch
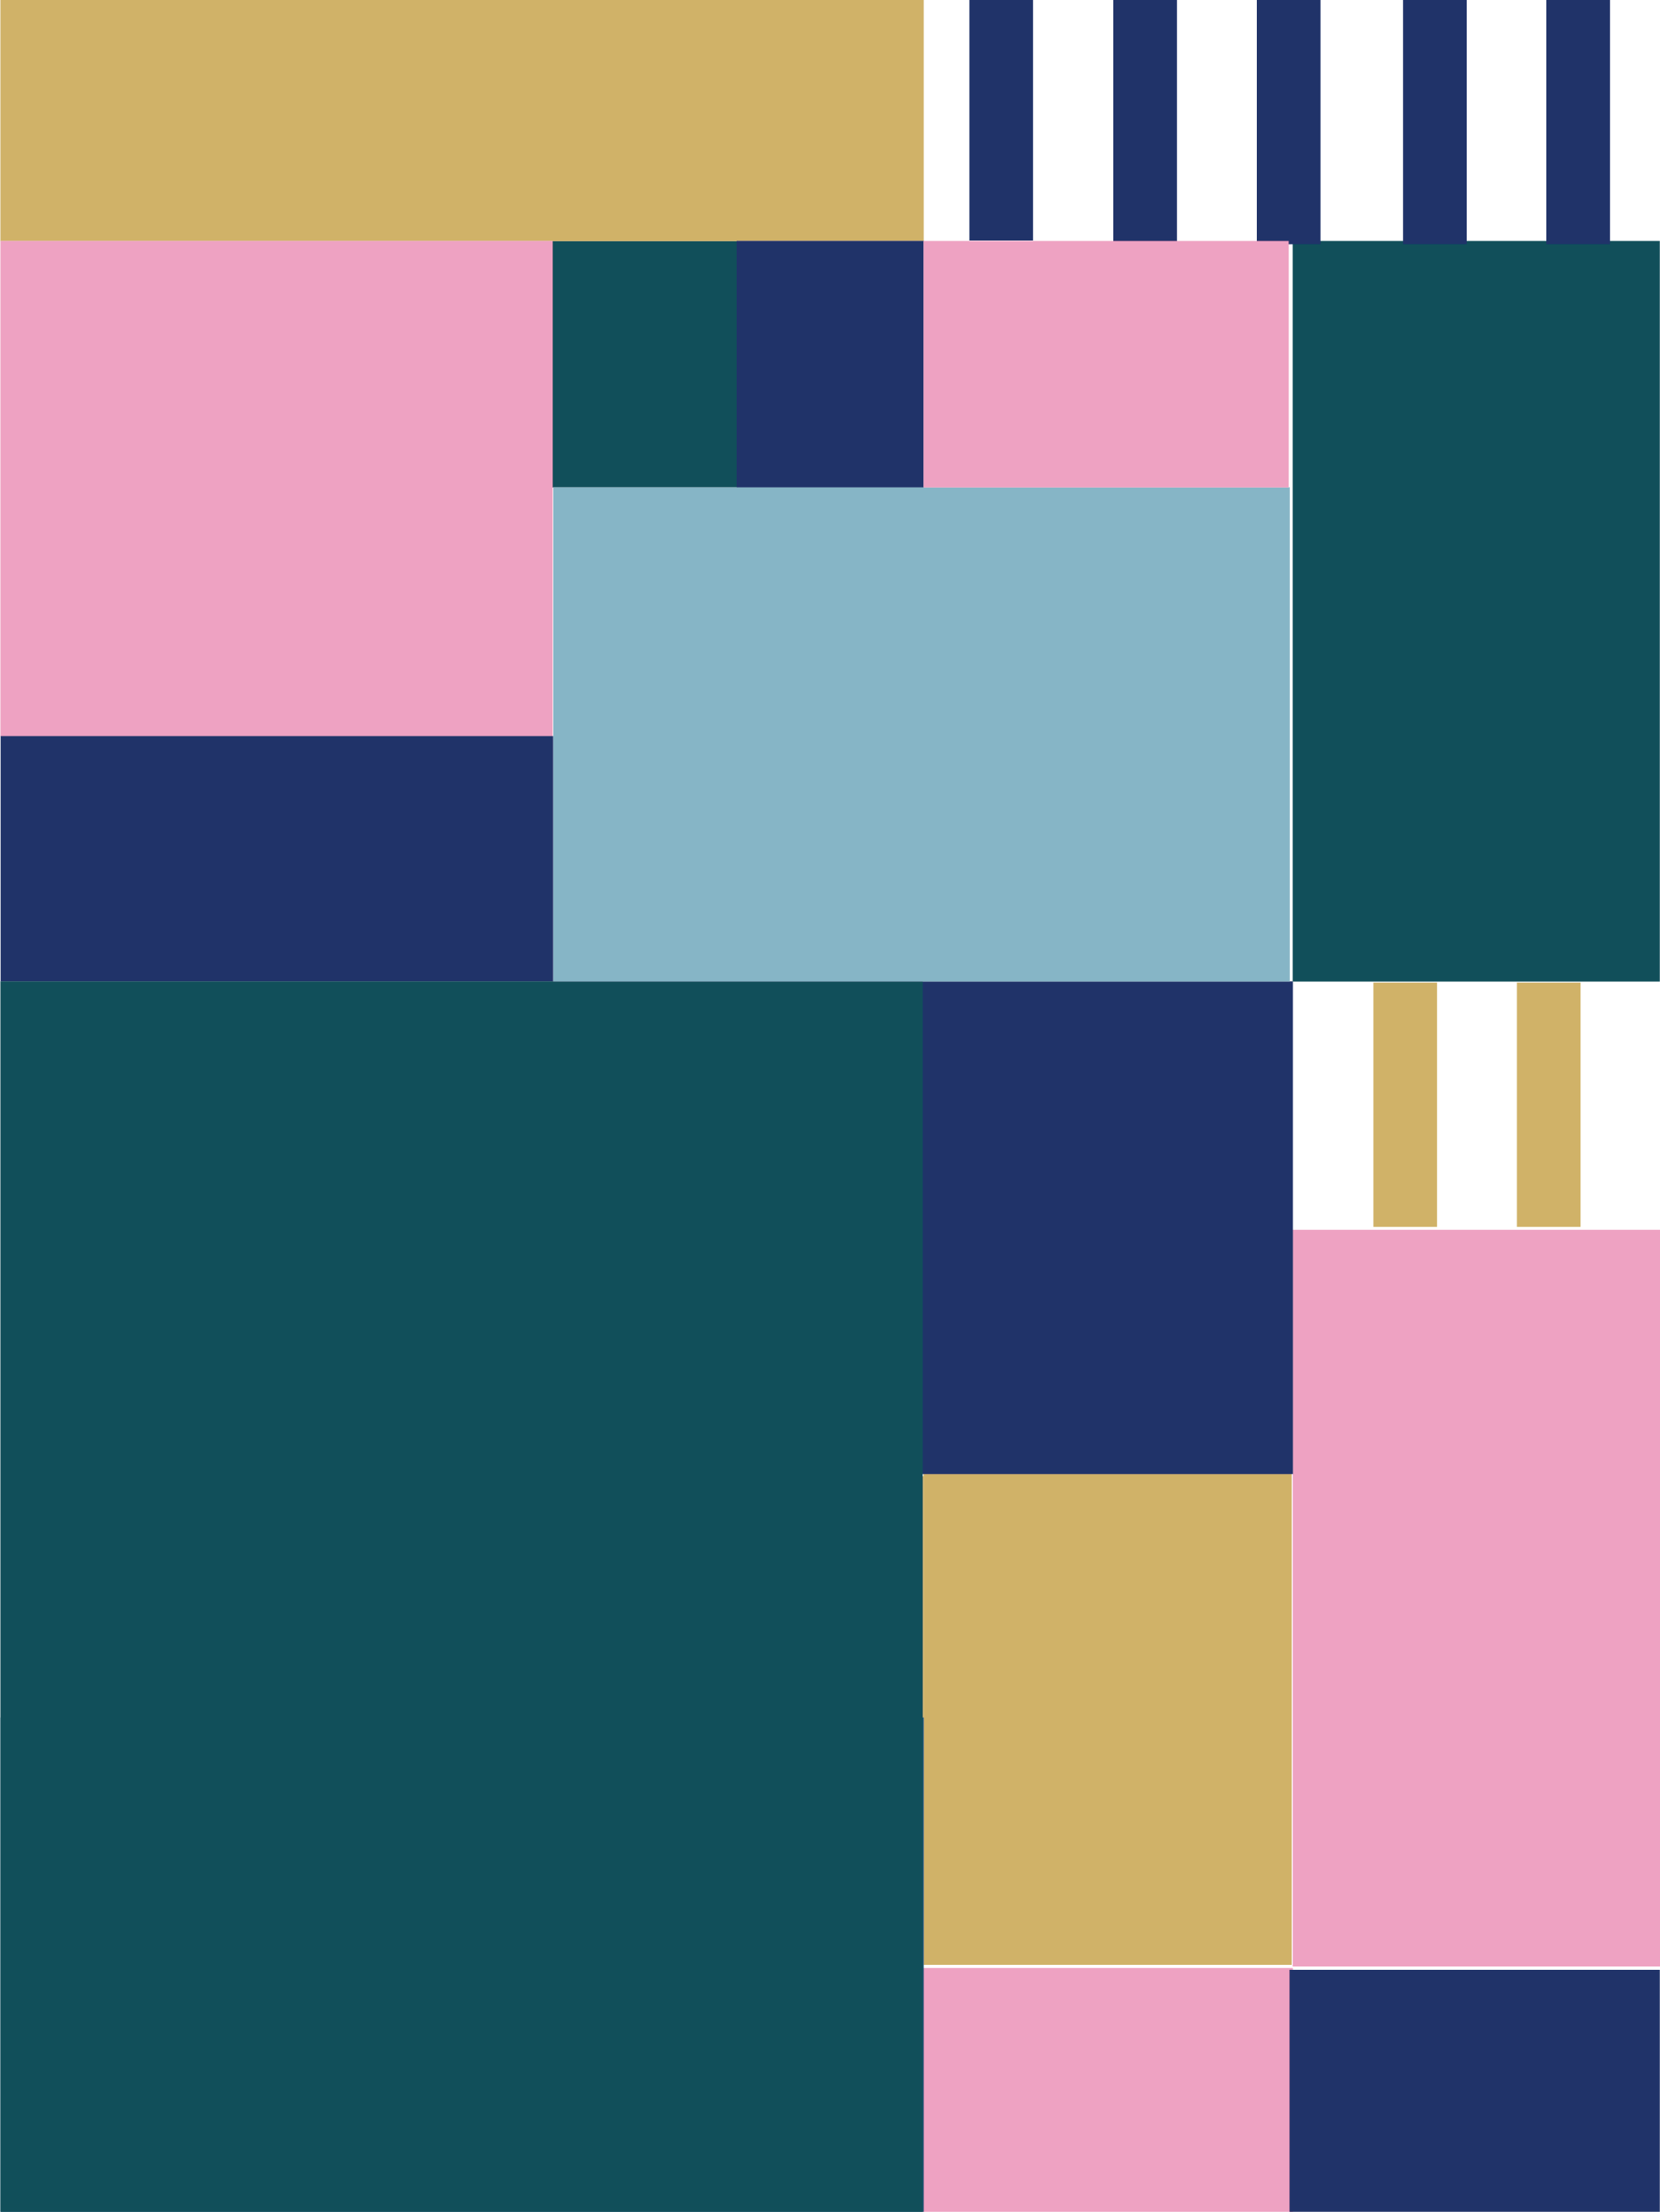
To interact: slowly move mouse Y up and down the top half of the image.
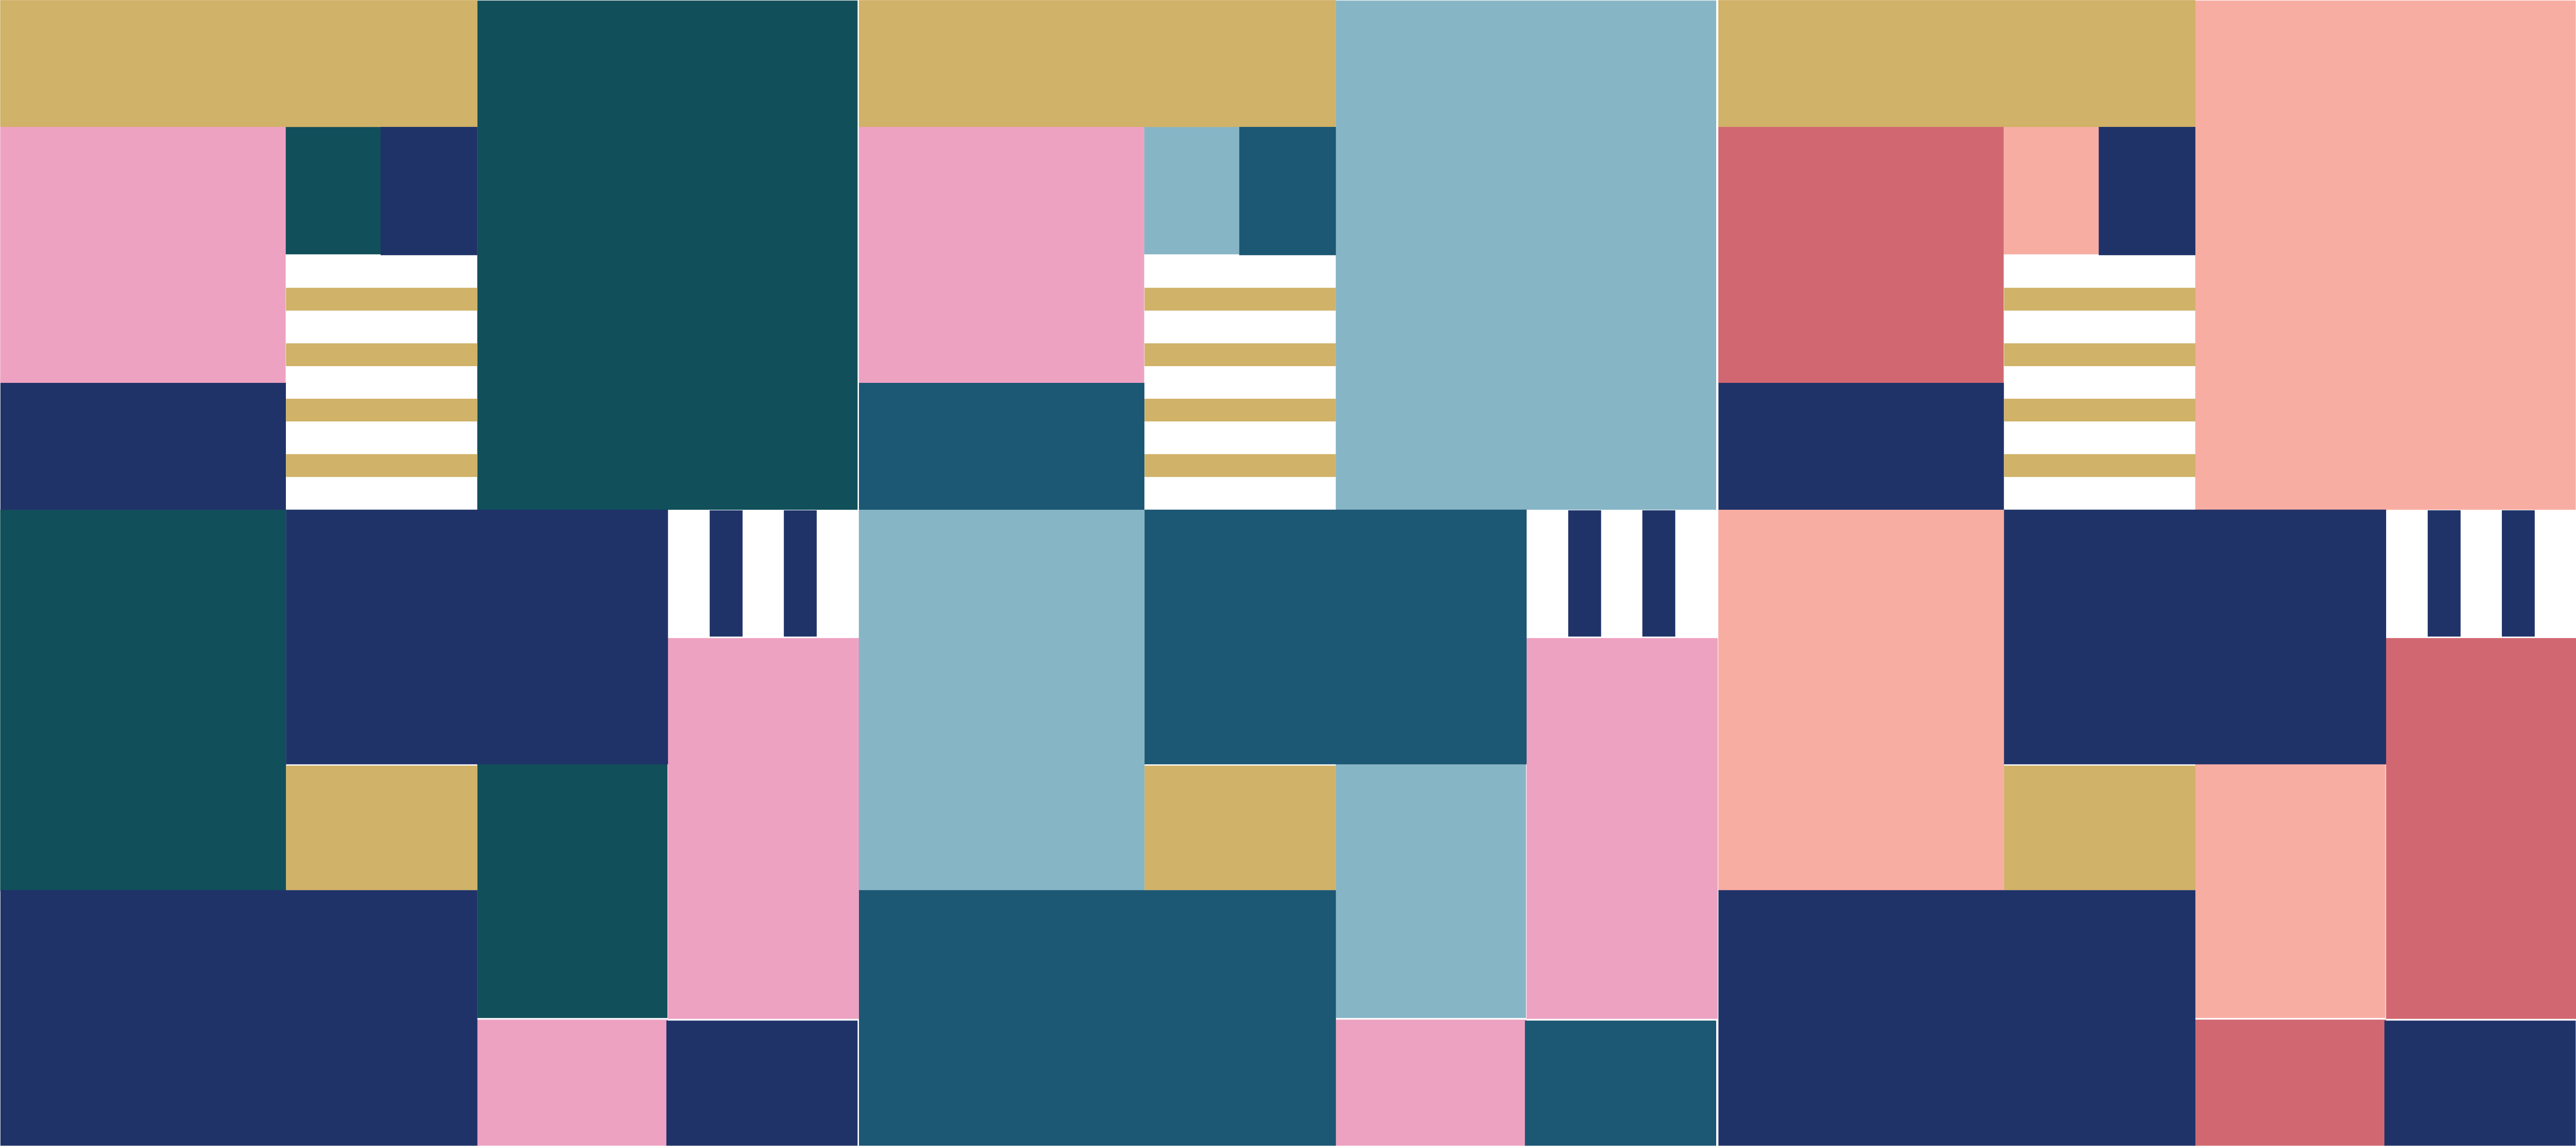
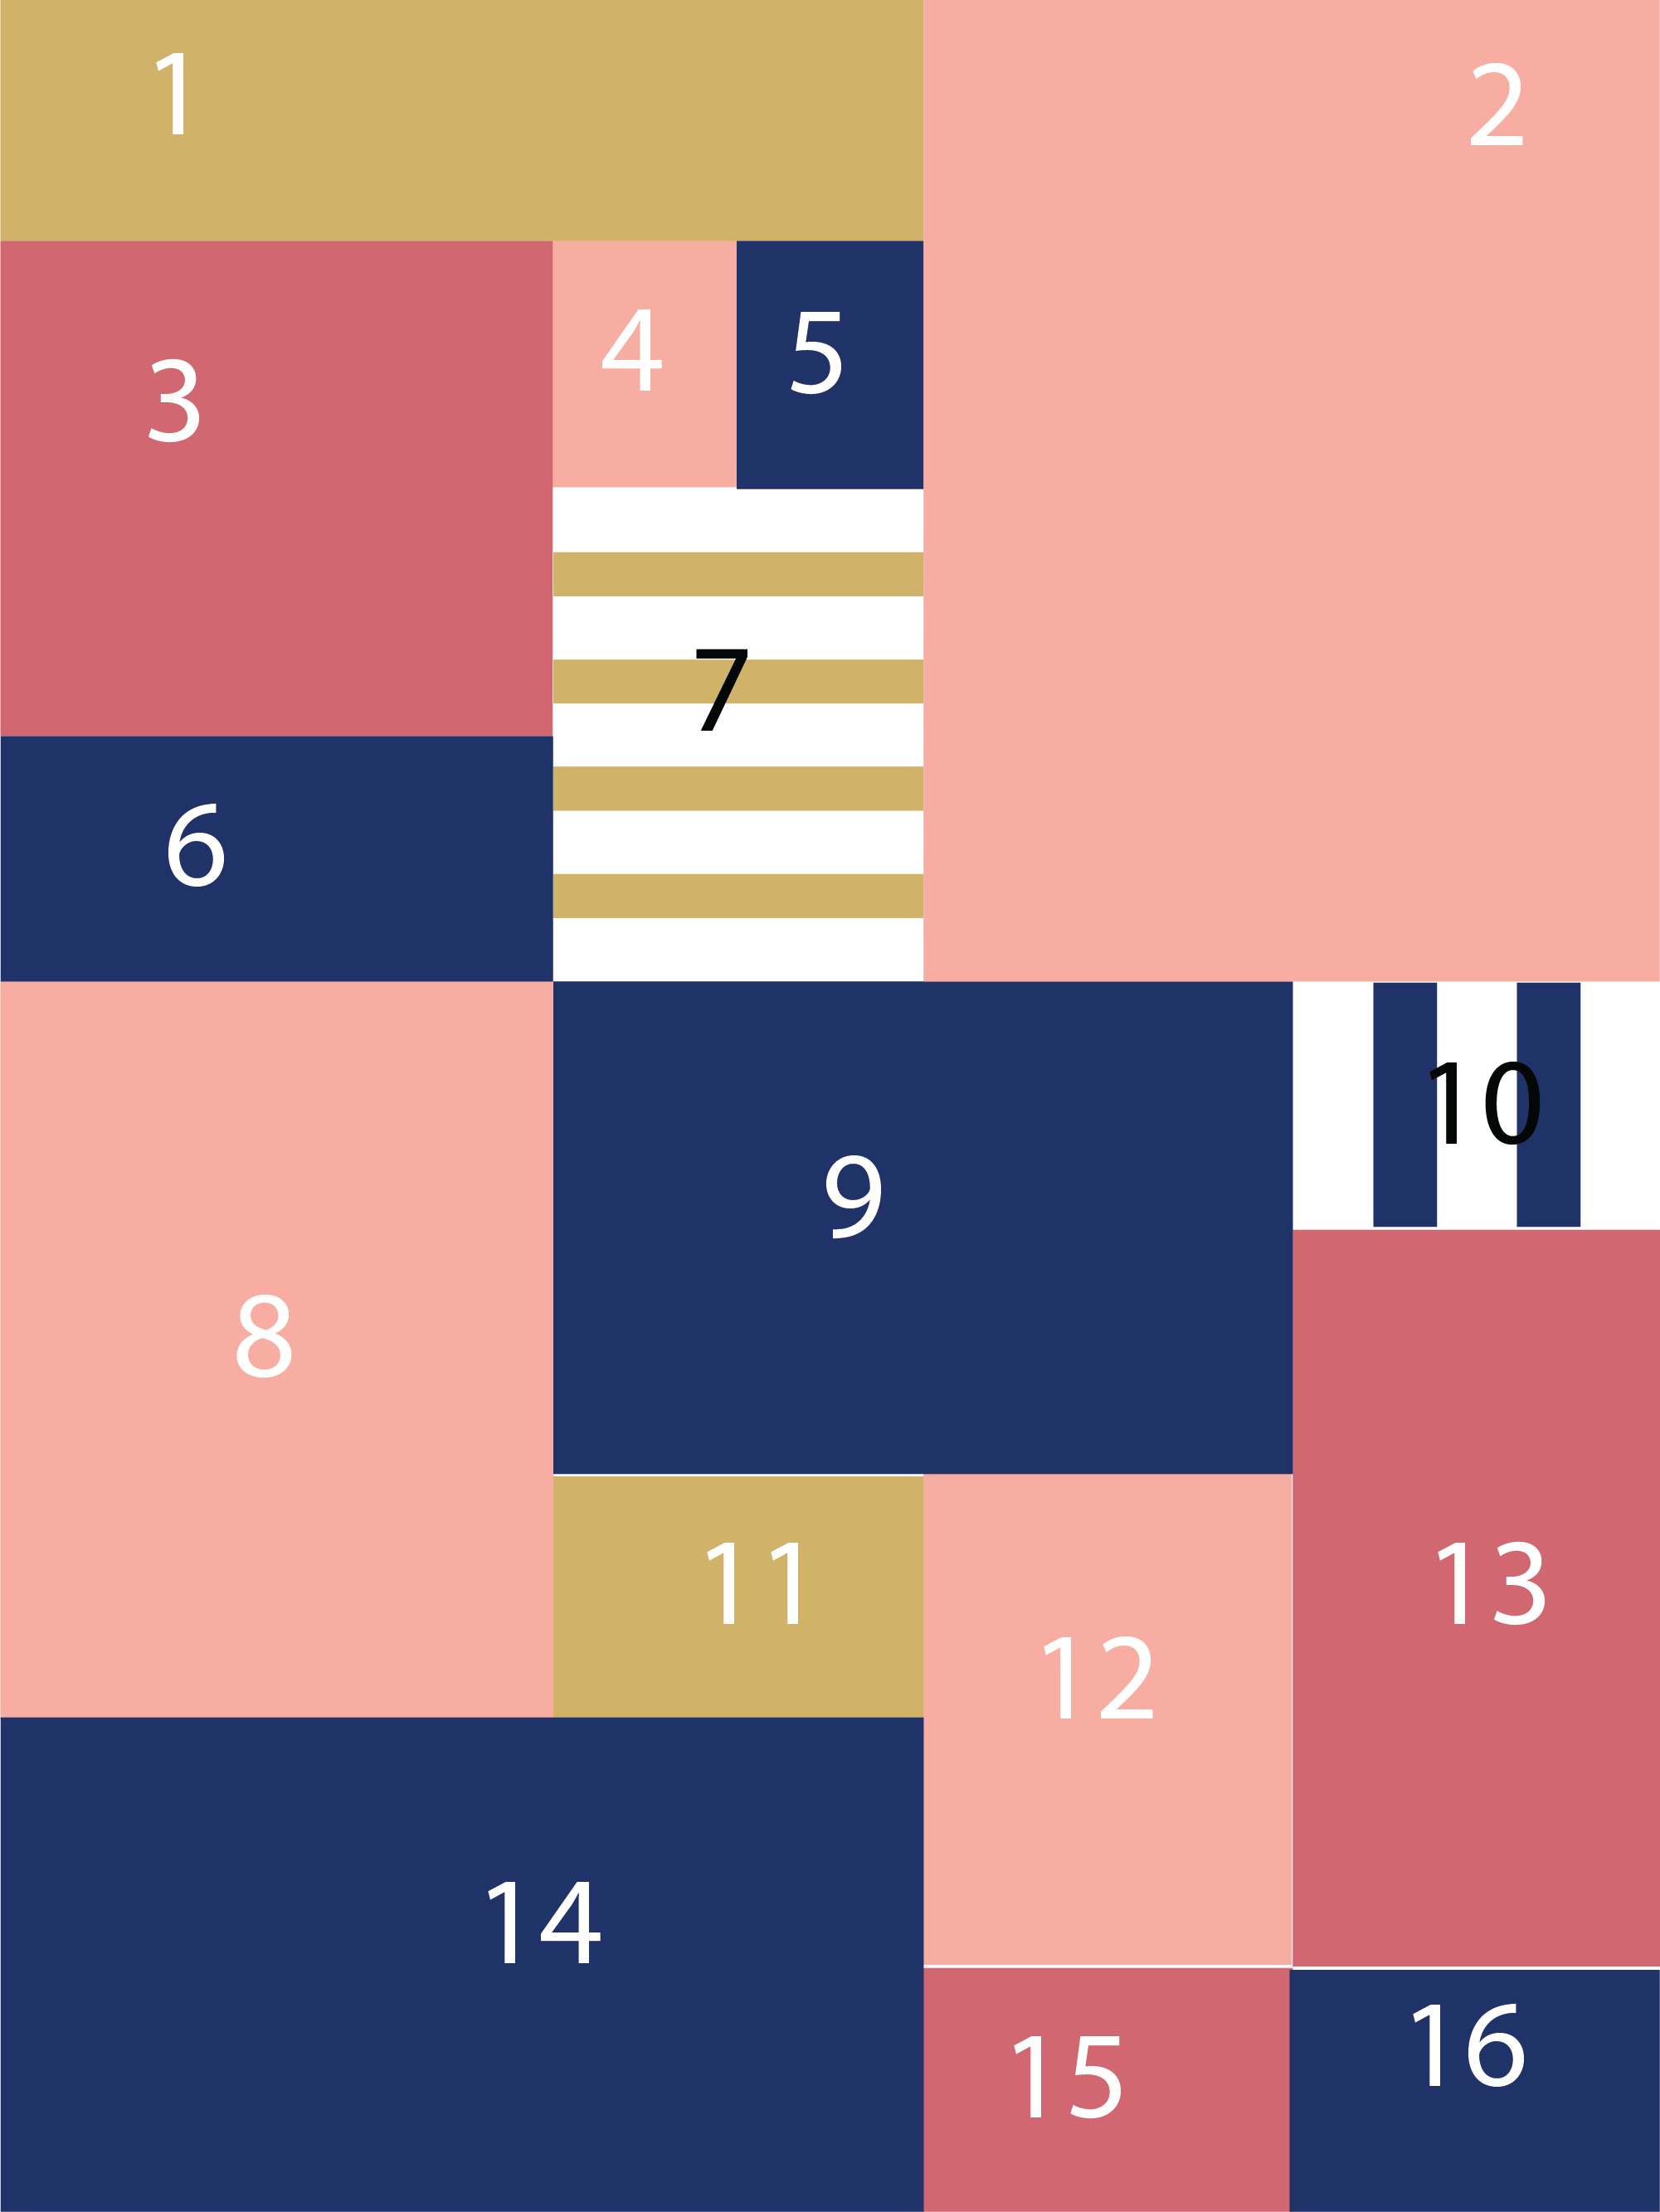
I was interested in experimenting with color palettes I usually don’t use in my work for this project. After making the code, I realize my approach doesn’t quite take advantage of “code’s grain”– that is, this interaction may have been better executed in a platform that uses keyframes such as after effects. While the growth of blocks are smooth, the color change is abrupt because I couldn’t quite math out how to change the particular RGB values to match mouse Y.

function setup() {
  createCanvas(480,640);
}

//colors
var ochre='#D0B268'
var LightSalmon='#F8ADA3'
var DarkSalmon='#D06870'
var Navy='#213468'
var Navy9='#213468'
var Green='#084E5A';
var Navy10=Navy;
var DarkSalmon31315=DarkSalmon;
var LightSalmon12=LightSalmon;
var LightSalmon4=LightSalmon;
var LightSalmon2=LightSalmon
var rectXone=0;
var ochre17=ochre;
var rectXtwo=480;
var ochreStripe=LightSalmon;

//shape variables
var rectX=0;
var rectY=0;

function draw() {
  var myc= constrain(mouseY,0,142.5);
  var rectX=myc/.53;
  var rectY=myc*2.5;
  var rectXone=myc*.753;
  var rectXtwo=480-(myc*1.495);
  noStroke();
  rectMode(CORNER);
  fill(ochre);
  rect(0,0,267,71); //box 1
  fill(LightSalmon2);
  rect(267,0,273,284); //box 2
  fill(DarkSalmon31315);
  rect(0,71,160,143); //box 3
  fill(LightSalmon4);
  rect(160,71,53,71); //box 4
  fill(Navy);
  rect(213,71,54,71); //box 5
  rect(0,214,160,71);//box 6
  fill(255);
  rect(160,142,107,142);
  fill(ochre);
  push();
  rect(160,160,107,13); //box 7 stripe 1
  translate(0,30);
  rect(160,160,107,13); //box 7 stripe 2
  translate(0,30);
  rect(160,160,107,13); //box 7 stripe 3
  translate(0,30);
  rect(160,160,107,13); //box 7 stripe 4
  pop();
  fill(LightSalmon); 
  rect(0,284,160,213.5) //box 8
  fill(Navy9);
  if (mouseY>142.5) {
    Navy9='#86B5C6';
    Navy10=ochre;
    DarkSalmon31315='#ECA1C0';
    LightSalmon12=ochre;
    LightSalmon4=Green;
    DarkSalmonGreen=Green;
    LightSalmon2=Green;
    ochre17='#ECA1C0';
    ochreStripe=Navy;
  }
  if (mouseY<=142.5) {
    Navy9=Navy;
    Navy10=Navy;
    DarkSalmon31315=DarkSalmon;
    LightSalmon12=LightSalmon;
    LightSalmon4=LightSalmon;
    DarkSalmonGreen=DarkSalmon;
    LightSalmon2=LightSalmon;
    ochre17=ochre;
    ochreStripe=LightSalmon;
  }
  push();
  translate(0,-myc);
  rect(160,284,214,142.5); //box 9
  pop();
  push();
  fill(Navy10);
  rect(397,284,18,70.5); //box 10 stripe 1
  translate(40,0);
  rect(397,284,18,70.5); //box 10 stripe 2
  pop();
  fill(ochre);
  rect(160,426,107,71.5); //box 11
  fill(LightSalmon12);
  rect(267,426,107,142); //box 12
  fill(DarkSalmon31315);
  rect(374,354.5,107,213.5); //box 13
  fill(Navy);
  rect(0,497,267,143); //box 14
  fill(DarkSalmon31315);
  rect(267,568,107,72); //box 15
  fill(Navy);
  rect(374,568,107,72); //box 16
  fill(DarkSalmonGreen);
  rect(0,284,rectX,rectY);
  fill(ochre17);
  rect(267,71,rectXone,71);
  fill(255);
  rect(rectXtwo,0,213.5,71);
  fill(ochreStripe);
  rect(285,0,18,71);
  push();
  translate(50,0);
  rect(285,0,18,71);
  translate(50,0);
  rect(285,0,18,71);
  translate(50,0);
  rect(285,0,18,71);
  translate(50,0);
  rect(285,0,18,71);
  
  
}

Bettina-LookingOutwards03-SectionC

Screenshot from MIT computation fabrication lab’s youtube video.

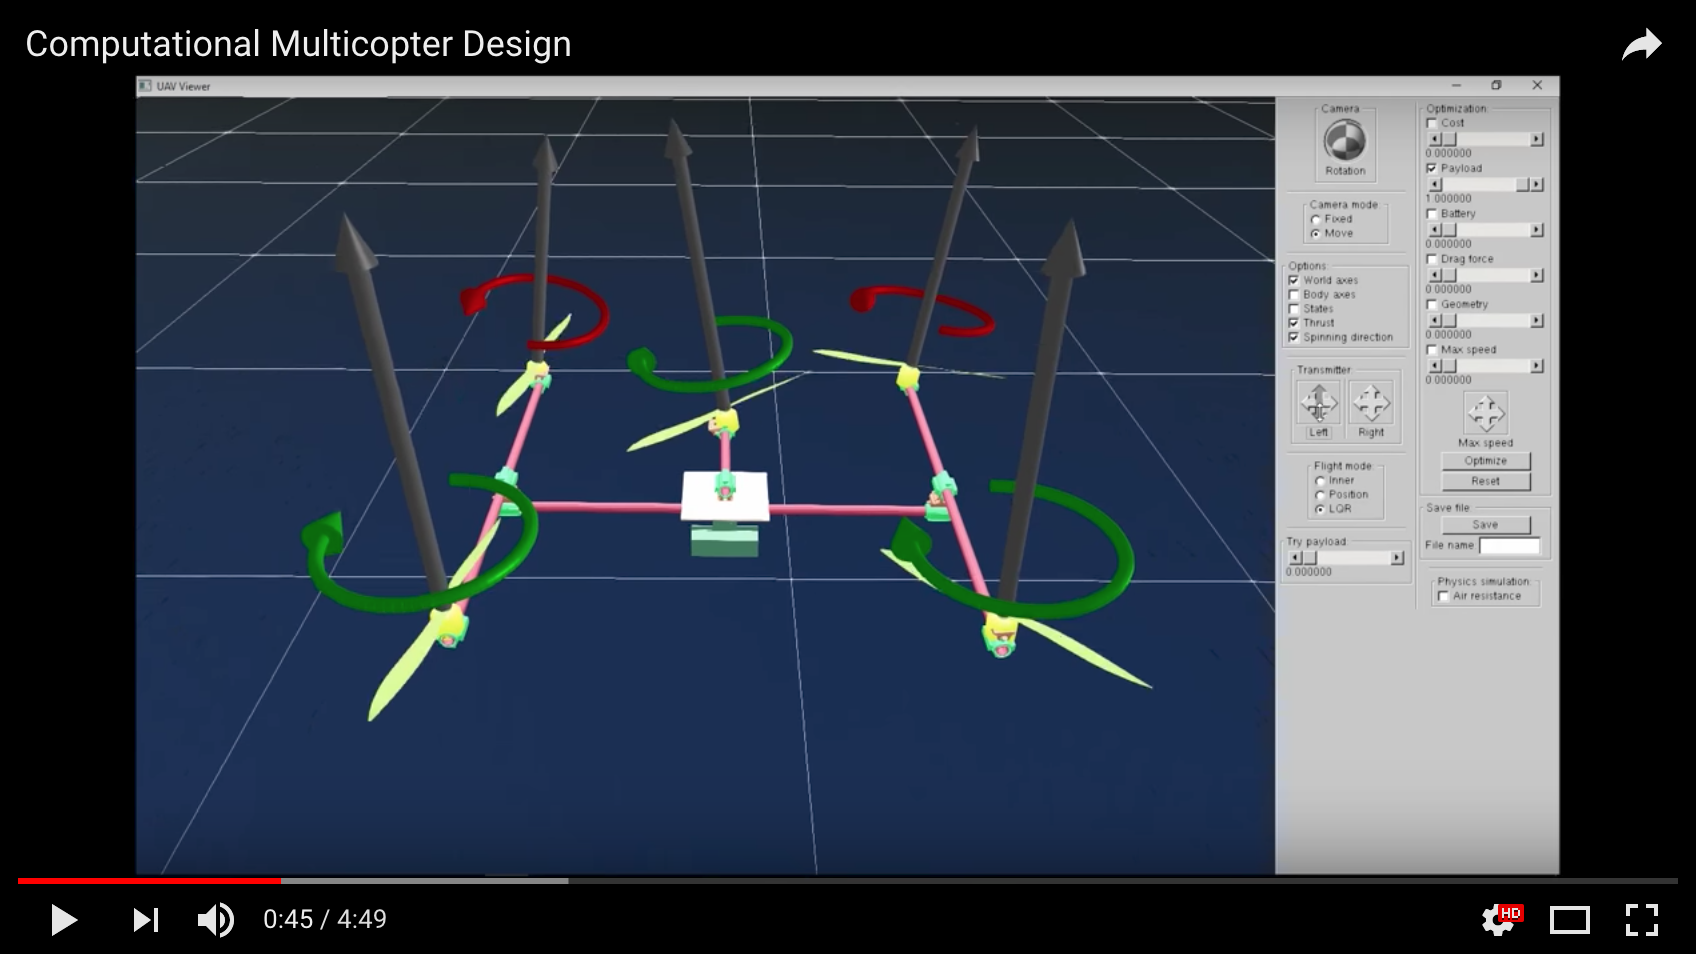
In looking through examples, I was curious to find work that had function outside of “being pretty” or “showing data”. As a peer expressed, “the most beautiful things are functional”. While this is a long contended perspective, I agree that with the power of generating from code/data, there is power to make very useful things. This multicopter from MIT’s fab-lab can vary it’s physical structure, such as wingspan, power, height, etc. to adjust to the user’s needs. This level of customizability gives users more control than simply choosing from a set list of specs.

From a practical standpoint, printing this using a 3D printer would be economically viable. Mass production using other materials may be tricky because of molds; however if 3D printers could print the molds themselves, I could see this concept used widely.