![[OLD FALL 2017] 15-104 • Introduction to Computing for Creative Practice](../../../../wp-content/uploads/2020/08/stop-banner.png)
var Emma;
var z = .5;
function preload() {
  Emma = loadImage("https://i.imgur.com/pWLCrQJ.jpg"); //image from imgur
}
function setup() {
  createCanvas(400, 400);
  background(0);
  for (var i = 0; i < width/2; i+=z) {
    for (var j = 0; j < height/2; j+=z) {               //nested for loop image sized
      var pixelColor1 = Emma.get(i, j);                 //storing pixels info
      var pixelBrightness1 = brightness(pixelColor1);   //sampling brightness of pixles
      noStroke();
      fill(256, 0, 256, pixelBrightness1 + 30);              //solid color brightness from image
      ellipse(i, j, z, z);                              //draw new image using colors
    }
  }
  for (var k = 0; k < width/2; k+=z) {
    for (var l = 0; l < height/2; l+=z) {
      var pixelColor2 = Emma.get(k, l);
      var pixelBrightness2 = brightness(pixelColor2);
      noStroke();
      fill(256, 256, 256, pixelBrightness2 + 50);
      ellipse(k + width/2, l + width/2, z, z);
    }
  }
  for (var m = 0; m < width/2; m+=z) {
    for (var n = 0; n < height/2; n+=z) {
      var pixelColor3 = Emma.get(m, n);
      var pixelBrightness3 = brightness(pixelColor3);
      noStroke();
      fill(0, 256, 256, pixelBrightness3 + 30);
      ellipse(m + width/2, n, z, z);
    }
  }
  for (var x = 0; x < width/2; x+=z) {
    for (var y = 0; y < height/2; y+=z) {
      var pixelColor4 = Emma.get(x, y);
      var pixelBrightness4 = brightness(pixelColor4);
      noStroke();
      fill(256, 256, 0, pixelBrightness4 + 30);
      ellipse(x, y + width/2, z, z);
    }
  }
}Category: Project-09-Portrait
juyeonk-project-09
//Claire Koh
//Section E
//juyeonk@andrew.cmu.edu
//Project-09
var balls = []; // An array that will store the little balls that make up the portrait
// Loads the image
function preload() {
var myImageURL = "https://i.imgur.com/AOyeLOo.jpg";
underlyingImage = loadImage(myImageURL);
}
function setup() {
createCanvas(480, 480);
background(0);
underlyingImage.loadPixels(); // Loads the pixel data of the image
}
// Determines the properties of the balls
function makeballs() {
var ix = constrain(floor(this.x), 0, width-1);
var iy = constrain(floor(this.y), 0, height-1);
var theColorAtLocationXY = underlyingImage.get(this.x, this.y); //gets the color value of the image at (x,y)
fill(theColorAtLocationXY) // Fills the balls with the color of the image at (x,y)
noStroke();
ellipse(this.x, this.y, this.ballsize); // Draws the ellipse at (x,y) with the width and the height dimension of 'ballsize' which is a random number between 2 and 8
}
// Makes the ball move
function ballspeed() {
this.y += this.dy; // MouseY will be later assigned as 'y'
}
// Sets up the function that returns the properties of the object p, which contains information like the coordinate point of x, y, dy, a function that determines the speed of the ball, a function that creates balls, and the size of the ball
function drawPortrait(placeholderx, placeholdery, placeholderdy) {
p = {x: placeholderx,
y: placeholdery,
dy: placeholderdy,
speed: ballspeed,
balls: makeballs,
ballsize : random(2,8)
}
return p;
}
function draw() {
newBalls = []; // Creates an empty array that will store the values of the newly-created balls
for (var i = 0; i < balls.length; i++) {
var p = balls[i];
p.speed(); //returns the function speed() which makes the balls move
p.balls(); //returns the function balls() which assigns the balls their properties
newBalls.push(p);
}
balls = newBalls;
}
// When the mouse is moved it replaces the placeholderx placeholdery and placeholderdy values with mouseX, mouseY and random(-20,20) and make the drawPortrait function actually happen and to be stored in the newball array
function mouseMoved() {
var newball = drawPortrait(mouseX, mouseY, random(-20, 20));
balls.push(newball);
x += random(x-3, x+3);
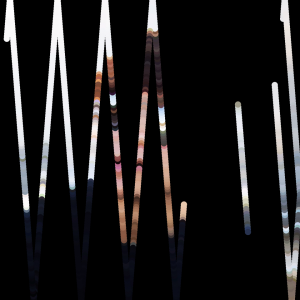
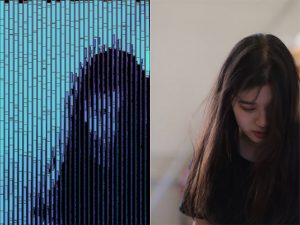
}For this project I wanted to make the portrait appear as if it is being drawn by bunch of rain droplets. I tried to take a break from using the function-based operation and and use the object-based operation for once. Overall I think this project was a good opportunity for me to break down how the object-based operation works and to actually learn how to use it.
Initially I tried to make the little rain droplets to drop from the sky and to collect at the bottom without overlapping each other but I legitimately could not figure out how to make that happen so I just made the little droplets to crawl up or down at a constant speed and go beyond the canvas.
^ Original sketch
^
^ While it’s being drawn
^ Almost done
**Credit to Grace Hou for letting me use her picture!!**
ghou-Project-09-Portrait
//Grace Wanying Hou
//15-104 Section D
//ghou@andrew.cmu.edu
//Project 09
//global variables
var sw = [];
var a = 0;
var r = 2;
var rx = [];
var ry = [];
function preload(){
var imageurl = "https://i.imgur.com/S483jxr.jpg";
dp = loadImage(imageurl);
}
function setup(){
createCanvas(380,300);
dp.loadPixels();
background(240,245,250);
for (var i=0; i<10; i++){ //randomizing where spirals are
rx[i] = random(380);
ry[i] = random(300);
sw[i] = random(2,8);
}
}
function draw(){
noStroke();
a += 0.1;
r += 0.1;
//setting up spirals
var x = rx[0] + r * -cos(a);
var y = ry[0] + r * sin(a);
var pointcolour = dp.get(floor(x),floor(y));
fill(pointcolour);
ellipse(x,y,sw[0]);
var x1 = rx[1] + r * -cos(a);
var y1 = ry[1] + r * sin(a);
var pointcolour1 = dp.get(floor(x1),floor(y1));
fill(pointcolour1);
ellipse(x1,y1,sw[1]);
var x2 = rx[2] + r * -cos(a);
var y2 = ry[2] + r * sin(a);
var pointcolour2 = dp.get(floor(x2),floor(y2));
fill(pointcolour2);
ellipse(x2,y2,sw[2]);
var x3 = rx[3] + r * -cos(a);
var y3 = ry[3] + r * sin(a);
var pointcolour3 = dp.get(floor(x3),floor(y3));
fill(pointcolour3);
ellipse(x3,y3,sw[3]);
var x4 = rx[4] + r * -cos(a);
var y4 = ry[4] + r * sin(a);
var pointcolour4 = dp.get(floor(x4),floor(y4));
fill(pointcolour4);
ellipse(x4,y4,sw[4]);
var x5 = rx[5] + r * cos(a);
var y5 = ry[5] + r * sin(a);
var pointcolour5 = dp.get(floor(x5),floor(y5));
fill(pointcolour5);
ellipse(x5,y5,sw[5]);
var x6 = rx[6] + r * cos(a);
var y6 = ry[6] + r * sin(a);
var pointcolour6 = dp.get(floor(x6),floor(y6));
fill(pointcolour6);
ellipse(x6,y6,sw[6]);
var x7 = rx[7] + r * cos(a);
var y7 = ry[7] + r * sin(a);
var pointcolour7 = dp.get(floor(x7),floor(y7));
fill(pointcolour7);
ellipse(x7,y7,sw[7]);
var x8 = rx[8] + r * cos(a);
var y8 = ry[8] + r * sin(a);
var pointcolour8 = dp.get(floor(x8),floor(y8));
fill(pointcolour8);
ellipse(x8,y8,sw[8]);
var x9 = rx[9] + r * cos(a);
var y9 = ry[9] + r * sin(a);
var pointcolour9 = dp.get(floor(x9),floor(y9));
fill(pointcolour9);
ellipse(x9,y9,sw[9]);
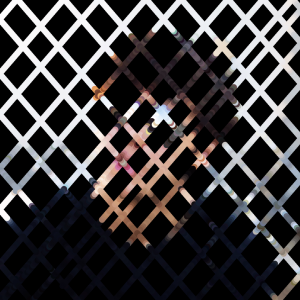
}I was a little inspired by the post-expressionism art period and Van Gogh’s paintings and his swirling brush strokes to create this portrait. I think the most difficult part of this project was setting up the variables. Overall I really enjoyed working on this; I wanted to set up a for() loop to create the 10 spirals but in the end I was unsuccessful although I am still thoroughly proud of my work.
yushano_Project09
var proPic = "https://i.imgur.com/79iDeUB.jpg";
var x0;
var y0;
var dx;
var dy;
var colAtPoint;
function preload() {
profilePic = loadImage(proPic);
}
function setup() {
createCanvas(480, 480);
background(0);
profilePic.loadPixels();
x0 = random(width);
y0 = random(height);
dx = random(-1,1);
dy = random(-1,1);
frameRate(20);
}
function draw() {
// constriants of the location of the ellipse
if (x0 >= width || x0 <= 0) {
dx = -dx
}
if (y0 >= height || y0 <= 0) {
dy = -dy
}
// get the color of the ellipse
ix = constrain(floor(x0), 0, width-1);
iy = constrain(floor(y0), 0, height-1);
colAtPoint = profilePic.get(ix, iy);
noStroke();
fill(colAtPoint);
ellipse(x0, y0, 10);
// update the coordinates of the ellipse
x0 += dx*5 ;
y0 += dy*5 ;
}
// the ellipse starts at the point that the user clicks
function mousePressed() {
x0 = mouseX;
y0 = mouseY;
dx = -dx;
dy = -dy;
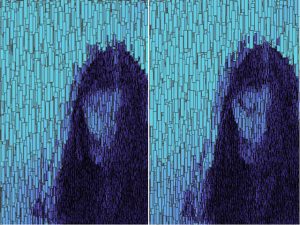
}The idea of my project derives from one of the Looking Outwards, which I researched about a robot that create art automatically. So, my work basically follows a similar rule. The point start from a random place that is on the canvas. If you press the canvas, the start point will change to the point that you press but the direction will be opposite to the original directions. The canvas will be very geometrical during the drawing process because the drawing process has a certain pattern that organizes the canvas. Because of my personal preference towards geometries and order, the pattern that is being drawn can also serve as a drawing.
Jihee Kim_SectionD_Project-09-Portrait
//Jihee Kim
//15-104 MWF 9:30
//jiheek1@andrew.cmu.edu
//Project 9 Portrait
//section D

var baseImage;
var fillR = 97; // Red value of rectangles
var fillG; // Green value of rectangles (subject to change later)
var fillB = 226; // Blue value of rectangles


//load image
function preload() {
    var portraitUrl = "https://i.imgur.com/HgOmFTq.jpg";
    baseImage = loadImage(portraitUrl);
}

function setup() {
    createCanvas(320, 480);
    background(0);
    baseImage.loadPixels(); // turn the base image into a collection of pixels
    frameRate(2000);
    // grid on canvas
    // draw verticle lines that fall down from top to bottom
    // in between the gaps of rectangles
    for (var y = 0; y < height; y ++) {
        for (var x = 9; x < width; x += 10) {
            stroke(175 - y/2, 100, 145); // apply a color gradient to the lines
                                         // color changes from red to blue
                                         // from top to bottom of canvas
            strokeWeight(1);
            line(x, y, x, height); // draw line
        }
    }
}

function draw() {
    // x and y position of pixels that are to be picked
    var pixelX = floor(random(0, width)) * 10; // get rid of horizontal overlaps
                                               // by spacing the pixels by the
                                               // maximum width of rectangles
                                               // that are to be drawn
    var pixelY = floor(random(0, height));

    // extract the color of each randomly chosen pixel
    var iX = constrain(pixelX, 0, width - 1); // make x coordinates
                                                     // integers (no decimals)
    var iY = constrain(pixelY, 0, height - 1); // make Y coordinates
                                                     // integers (no decimals)
    var cp = baseImage.get(iX, iY); // get the color at the pixel

    // the width, length, outline and fill of the rectangles are to be mapped
    // to the brightness of the color of each pixel
    var rectWidth = map(brightness(cp), 0, 100, 1, 10); // brighter the color
                                                        // wider the width
    var rectLength = map(brightness(cp), 0, 100, 6, 50); // brighter the color
                                                         // longer the length
    var strokeC = map(brightness(cp), 0, 100, 0, 100); // brighter the color
                                                       // lighter the outline
                                                       // in greyscale
    var fillG = map(brightness(cp), 0, 100, 50, 255); // manipulate the G value
                                                      // of the fill in respect
                                                      // to the brightness

    stroke(strokeC);
    strokeWeight(1);
    fill(fillR, fillG, fillB);
    rect(iX, iY, rectWidth, rectLength); // draw rectangle representing
                                         // each chosen pixel
}
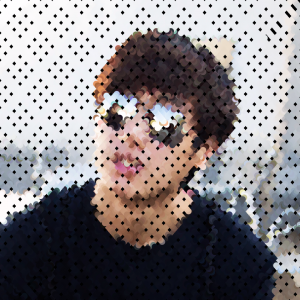
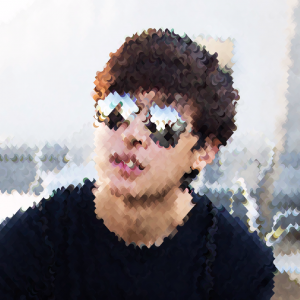
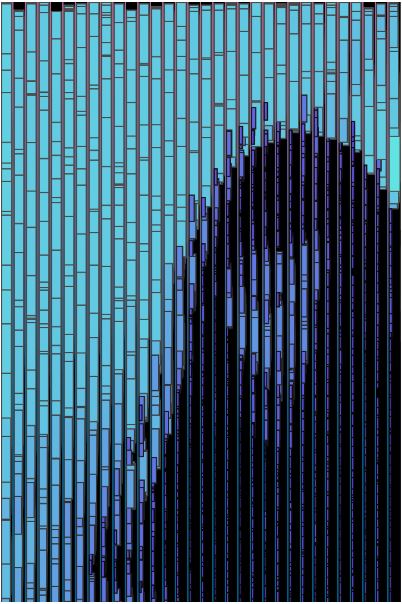
For this project, I created a computational self-portrait. While researching about data analysts in the past looking outwards assignment, I came across an image by dylan mason. Although this image was generated by compiling a lot of selfies throughout a long time, I wanted to mimic some of the qualities shown in this picture: horizontal bars and the balance between blurriness and clarity of the object.
Another inspiration for this project was the eye tracker assignment in which we used the brightness function. I implemented a hierarchical system, using that brightness function to make the width, length, outline and fill of the rectangles relative to the brightness of the color of each randomly chosen pixel on the canvas.
The brighter the color, the wider the width, the longer the length, the lighter the outline of the rectangles. The fill of rectangles are also related to the brightness. The brighter parts of the image are covered with light blue rectangles, while the darker parts of the image are covered with deep blue, almost purple rectangles. The rectangles on the darker parts of the canvas are smaller because I wanted a more detailed feel on the face area. On the other hand, the rectangles on the lighter parts of the canvas are bigger because I wanted to quantify and communicate the vast amount of light that is coming from behind the person (me). Bottom line, I wanted the attention to be drawn to the human figure more than the background and I believe I achieved that goal through elements, including but not limited to size and color.
In the first phase of designing, the there were a lot of overlaps among the rectangles that are derived from randomly chosen pixels. I wasn’t sure if I liked the aesthetics of it. In order to lessen the traffic, I spaced out the distance between the chosen pixels along the x-axis. Spacing out both in the x and y axes would have made the computational portrait a little too ambiguous.
To continue the language of horizontality, I drew a grid that consists of vertical lines that span from the top to the bottom of the canvas. Moreover, the change in color of these vertical lines (from red to blue from top to bottom) adds to the dynamics.
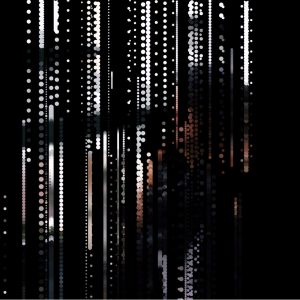
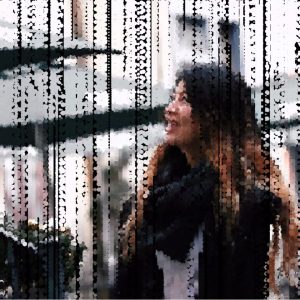
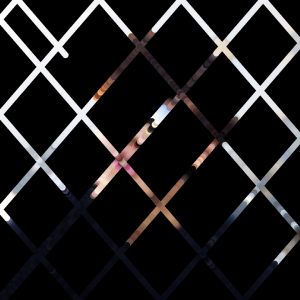
mmiller5-Project-09
var img
var step = [0, 0, 0, 0];
var i = [0, 0, 0, 0]; //y coordinates of strokes
var j = [0, 0, 0, 0]; //x coordinates of strokes
var vertShift = [];
var horzShift = [];
var check1 = true;
var check2 = [false, false, false, false];
var mx; //x value of the point of convergence
var my; //y value of the point of convergence
function preload() {
img = loadImage("https://i.imgur.com/9nlcGmA.jpg?1");
}
function setup() {
createCanvas(img.width, img.height);
strokeCap(SQUARE);
frameRate(30);
}
function draw() {
paintLine();
}
function paintLine() {
var startx = [0, width, 0, width];
var starty = [0, 0, height, height];
//make 4 different stroke paths
for(var count = 0; count < 4; count ++){
//checks if all the strokes have reached the point of convergence
if(check1) {
//finds trajectory for stroke to align it with point of convergence
mx = mouseX;
my = mouseY;
step[count] = 0;
vertShift[count] = 10 * (my - starty[count]) /
dist(mx, my, startx[count], starty[count]);
horzShift[count] = 10 * (mx - startx[count]) /
dist(mx, my, startx[count], starty[count]);
}
//if stroke hasn't made it to the point of convergence
if (dist(mx, my,
j[count] + startx[count], i[count] + starty[count]) > 10) {
//get colors from image
var pt1 = img.get(constrain(j[count] + startx[count], 0,
width - 1),
constrain(i[count] + starty[count], 0,
height - 1));
var pt2 = img.get(constrain(j[count] + horzShift[count]
+ startx[count], 0, width - 1),
constrain(i[count] - vertShift[count]
+ starty[count], 0, height - 1));
var col = color((pt1[0] + pt2[0]) / 2,
(pt1[1] + pt2[1]) / 2,
(pt1[2] + pt2[2]) / 2,
200);
//draw the stroke
stroke(col);
strokeWeight(10);
line(startx[count] + j[count], starty[count] + i[count],
startx[count] + j[count] + horzShift[count],
starty[count] + i[count] + vertShift[count]);
//advance step and recalculate new positions of strokes
step[count] += 1;
j[count] = step[count] * horzShift[count];
i[count] = step[count] * vertShift[count];
print(j);
check2[count] = false;
} else { // if stroke reached the end, set check so it can restart later
check2[count] = true;
}
}
//if all strokes are done, allow new point of convergence to be made
if (check2[0] & check2[1] && check2[2] && check2[3]) {
check1 = true;
} else {
check1 = false;
}
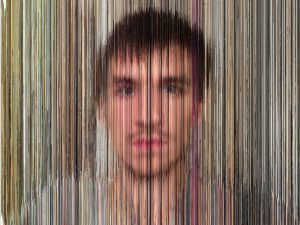
}Oh boy, this was a pain. There were many other ways I went about this, with lines forming randomly, serial rows of lines, and lines targeting the mouse from only 1 position. Eventually though I got here, and I’m just glad it works.
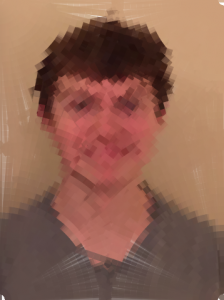
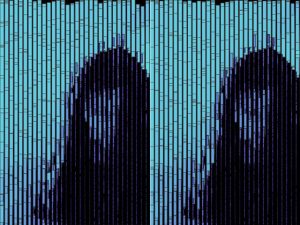
Kinda filled out version