![[OLD FALL 2017] 15-104 • Introduction to Computing for Creative Practice](../../../../wp-content/uploads/2020/08/stop-banner.png)
Mileece has spent many years studying sound design. In the process, she created a garden, the Tree Weaver, that produces acoustic sound through currents and wave frequencies. The sound produced by the movement of the hands utilises GSR (Galvanic Skin Response) while the human interactive sections use biosensors connected to a bigger system that chooses sound based upon factors such as firmness and location of the touch. This project really inspired me since Mileece took something artificial, the sound design creation process, and perfectly blended it with nature and everyday life to enhance the features of these plants inside the garden and really immerse those who visit. There are times when I believe that technology could not emulate sound produced by humans or actual instruments, but Mileece integrated the technology in such a natural way that it seems real.
Category: Section C
ashleyc1-Section C-Project-04-String-Art
//Ashley Chan
//Section C
//ashleyc1@andrew.cmu.edu
//Project-04-String-Art


var width = 400;
var height = 300;

var x1; //x of line
var y1; //y of line
var r; //rotational angle

function setup() {

    createCanvas(400, 300);

}

function draw() {
    background(249, 220, 187);

        x1 = 0;
        y1 = 0;
        r = atan(height, width);

   for (var i = 0; i < 1000; i += 10) {

        strokeWeight(.5);

        translate(width/2, height/2);
        rotate(r); //rotates lines so you can see it

        stroke(233, 100, 140); //pink
        line(x1 + 50, y1, 500, 1000);
        line(x1, y1, 0, 500);

        stroke(11, 47, 148); //navy
        line(x1, y1, -100, 500);

        stroke(0, 255, 252); //teal
        line(x1, y1, i + 200, 500);
    }
}
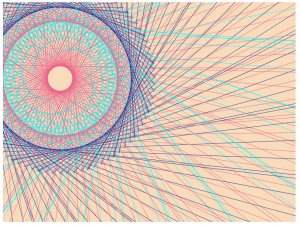
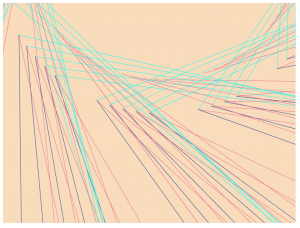
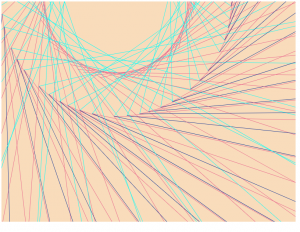
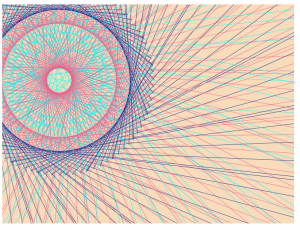
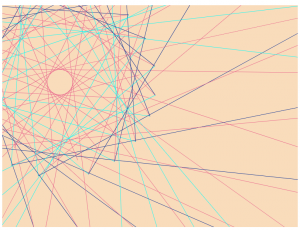
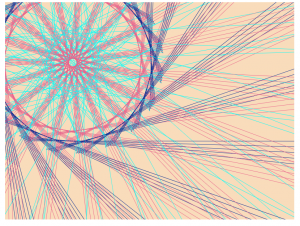
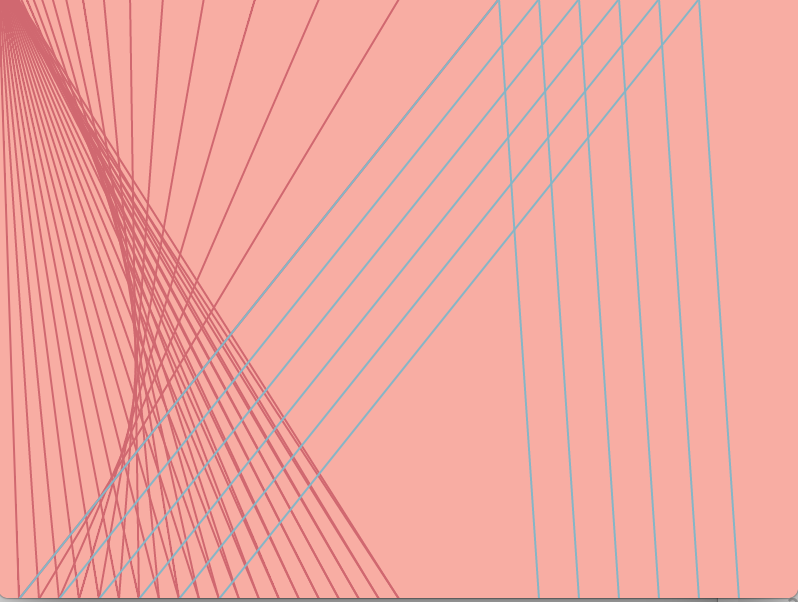
Initially, I wanted to draw concentric circles for this project because the string art examples I found reminded me of spirographs and the fun “complex” circles children often make with a special tool. But after I made the image I wanted, for funsies, I continued altering my values and ended up with happier accidents. Below are some of the images I got along the way but this final image was the one that I personally responded to the most because of how different it was from the other iterations.
eeryan-LookingOutwards-04
The Creatures of Prometheus by Simon Russell is a generative visualization of a Beethoven song, using pulsing graphics in coordination with the music to create a visual representation of the ballet. The animation is driven by a program (I think it’s a MIDI file, possibly through the Houdini program) that takes into account the pitch, note, and volume of the notes of the ballet and translates these factors into visual components like color and position that correspond to the particles that make up the visual representation. I like the extra dimension that this visualization gives to the ballet, allowing for a modern voice to be spoken through the traditional ballet piece.
ablackbu-project04-String-Art
*move mouse between red and blue
var A = 5

function setup() {
    createCanvas(400, 300);
    strokeWeight(2);
}

function draw() {
    background(200);
    for (var i = 1; i < 50; i ++) { //draw 50 diagonal lines
      stroke(25,173,210)
      line(A*i, 0, 15*i, 150); //top blue lines
      line(15*i, 150, A*i, 300); //bottom blue lines
      stroke(0)
      line(15*i, 0, A*i, 150); //top black lines
      line(A*i, 150, 15*i, 300); //bottom black lines

    }
    if (mouseX > width/2){ //in mouse goesto blue, lines are less slanted
        A = 10
    }else{A = 5} //if red the lines are origionaly slanted

    //draws that 50% opaque box's
    push()
    strokeWeight(0)
    fill(255,0,0,50)
    rect(0,0,width/2,height)

    fill(0,0,255,50)
    rect(width/2,0,width/2,height)
    pop()
}
I thought this project was very interesting. Unlike previous weeks, this project was more about learning to use the program, in this example with “for” statements. I wanted to make a very intricate web of lines and I wanted to make them move. I made it so the web looks far more concentrated when you drag your mouse from one side to the other.
rfarn-Project-04-StringArt
My string art design is fairly simple. Once understanding the concept of a for loop, I was able to quickly apply it to the creation of this string art. There were only a few small problems I faced, such as having to reverse the direction of the increments by subtracting them from the height. Besides little technical/syntax troubles, the overall project was quick and straight forward.
var yincrement = 15; //increments along y-axis
var xincrement = 20; //increments along x-axis
var x1position = 1; //points constantly flush left
var y1position = 299; //points constantly flush bottom
var x2position = 399; //points constantly flush right
var y2position = 1; //points constantly flush top

function setup(){
    createCanvas(400, 300);
    background(0);
}

function draw() {
	for(var i = 0; i < 21; i += 1) {
		strokeWeight(0.5);
		stroke(255); //white
		line(x1position, yincrement * i, xincrement * i, y1position); //lines between left and bottom
		stroke(255, 0, 0); //red
		line(x2position, yincrement * i, xincrement * i, y2position); //lines between right and top
		stroke(0, 255, 0); //green
		line(xincrement * i, y1position, x2position, height - yincrement * i); //lines between bottom and right
		stroke(0, 0, 255); //blue
		line(x1position, height - yincrement * i, xincrement * i, y2position); //lines between top and left
	}
}
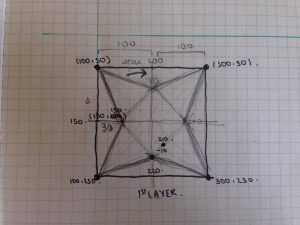
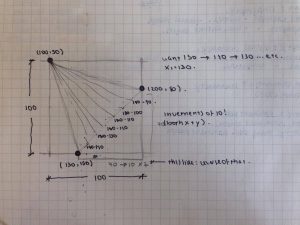
Bettina-Project04-SectionC
// yuchienc@andrew.cmu.edu
// Section C
// project 4--stringart
function setup() {
createCanvas(400,300);
}
var bgColor='#f8ada3'
var fuschia='#d06870'
var lightBlue='#86b5c6'
var ochre='#d0b268'
function draw() {
background(bgColor);
fuschiaCurve(mouseX);
lightBlueCurve(mouseX);
ochreCurve(mouseX);
}
function fuschiaCurve(mouseX) {
var x1=mouseX;
var y1=0;
var x2=10;
var y2=300;
var x3=250;
var y3=0;
var cmx=constrain(mouseX,75,500);
for (i=0;i<400;i+=20) {
stroke(fuschia);
line(x1,y1,x2,y2);
line(x2,y2,x3,y3);
x1+=.5;
x2+=10;
x3*=.8;
}
}
function lightBlueCurve(mouseX) {
var x1=10;
var y1=300;
var x2=250;
var y2=0;
var x3=x2+20;
var y3=300;
var cmx=constrain(mouseX,100,500);
for (i=0;i<300;i+=50) {
stroke(lightBlue);
line(x1,y1,x2,y2);
line(x2,y2,x3,y3);
x1+=20;
x2+=cmx/25;
x3=x2+20;
}
}
function ochreCurve(mouseX) {
var x1=150;
var y1=300;
var x2=300;
var y2=0;
var cmx=constrain(mouseX,100,500);
for (i=0;i<260;i+=20) {
stroke(ochre);
line(x1,y1,x2,y2);
x1+=cmx*.05;
x2+=cmx*.05;
}
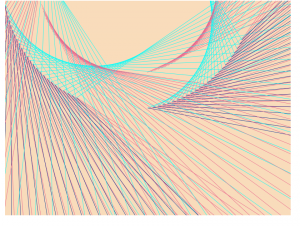
}My previous projects, I had sketched a clear visual and then figured out the code to execute it. This time, I wanted to embrace the nature of code and draw something directly in p5 without sketching ideas prior. I’d used the print statement to find the values for x and y at certain points in the loop so I could use those values for other curve functions. I spent the most time adjusting the increments to x and y so the composition outcome was balanced. Some process pictures are below.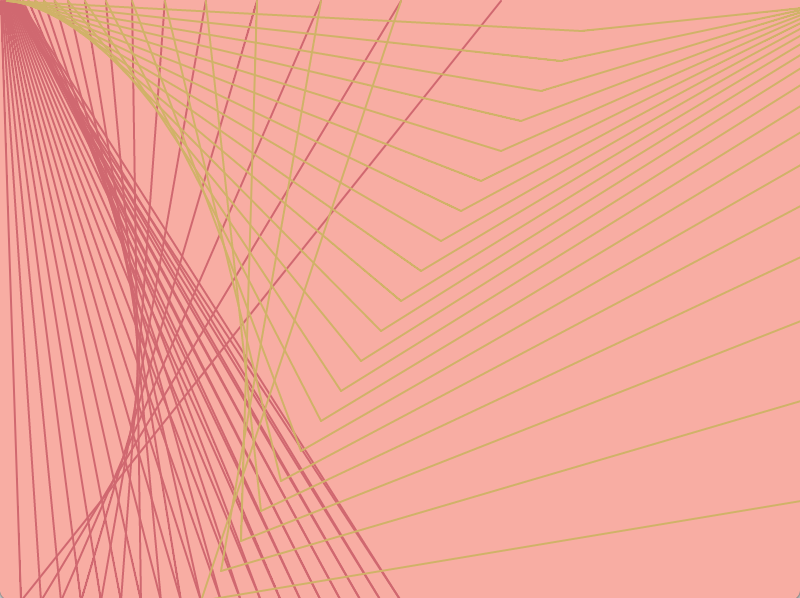
I also added an interactive portion, building off of last week’s assignment, so the positions of certain coordinates varied with mouseX.
serinal – looking outwards 04 (section C)
In 2014, visual artist, David Bowen, created an installation, “cloud piano”, that plays the piano based on cloud movements and shapes. How this is done is that Bowen has a camera set up that is pointed towards the sky and takes video of the clouds. Using a software he made, the video causes a device to press down on the corresponding piano keys. The whole act of the installation is to make it seem like the clouds are pressing the piano keys as they move across the sky and go through shape changes. Ultimately, the sound that is played on the piano is made up of a bunch of different sound patterns that Bowen describes as “ethereal forms that build, sweep, fluctuate and dissipate in the sky”.
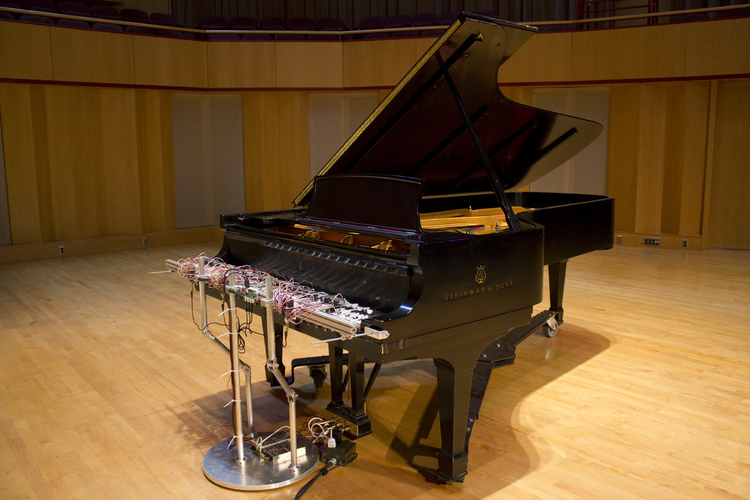
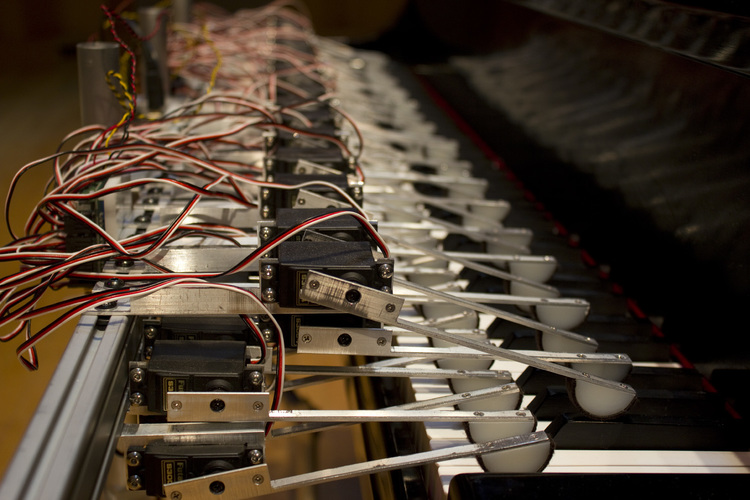
What I think is really cool about this project is the fact that it is so beautifully and intricately constructed. It is cool to see how sound, art and technology can all be tied in together. Bowen’s work definitely gears towards this side of things, but it is amazing to see things like this done because it is so opposite of what I would do or how I create my art.
Name: Cloud Piano
Artist: David Bowen
Date: 2014
Website Link: http://www.dwbowen.com/cloud-piano/
ashleyc1-Section C-Looking Outwards-04
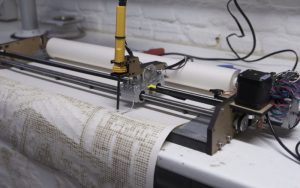
PyroGraph is a machine programmed to take in an image, generate and draw it using dots in a style similar to pointillism. It correlates the sound of the room to the greyscale of each particular dot and the dot is then created by a moving tip that burns 450 into the paper. The dot’s greyscale correlates to the noise of the room. PyroGraph is interesting because it recreates and stylizes an image through public involvement. I wonder why the artist/programmers chose to have the machine react to sound. Since this project was inspired by traditional thermal printers, incorporating sound seems disconnected from tangible print. If it’s a reference to the processing noises old thermal printers make, that would make sense but I wish it was explained explicitly.
This project heavily follows the practices of pyrography: the art of burning wood to create an image. There are differences in style. For instance, PyroGraph requires the machine to draw in dots whereas a traditional pyrographic artist could easily burn lines for realistic textures. However, it’s still revolutionizing the practice, not only through computer-generated burning but also shifting the act of burning from an artist to a generalized public. It’s subtly interactive.
afukuda-Project04
/*
 * Name | Ai Fukuda
 * Course Section | C
 * Email | afukuda@andrew.cmu.edu
 * Assignment | 04-b
 */

function setup() {
    createCanvas(400, 300);
}

function draw() {
    background(206, 236, 236);

    var x1;                     // x-coordinate of vertices
    var y1 = 160;               // initial y-coordinate of vertices

// PURPLE LINES (THICK)
    strokeWeight(1.5);
    stroke(204, 178, 213);

    for (var x1 = 130; x1 < 201; x1+=10) {      // top-left lines
        line(100, 50, x1, 120+(y1-x1));
    }

    for (var x1 = 200; x1 < 271; x1+=10) {      // top-right lines
        line(300, 50, x1, x1-120);
    }

    for (var x1 = 130; x1 < 201; x1+=10) {      // bottom-left lines
        line(100, 250, x1, x1+20);
    }

    for (var x1 = 200; x1 < 271; x1+=10) {      // bottom-right lines
        line(300, 250, x1, 420-x1);
    }

// PURPLE LINES (THIN)
    strokeWeight(1);
     for (var x1 = 130; x1 < 201; x1+=10) {     // top-left lines
        line(200, 150, x1, 120+(y1-x1));
    }

    for (var x1 = 200; x1 < 271; x1+=10) {      // top-right lines
        line(200, 150, x1, x1-120);
    }

    for (var x1 = 130; x1 < 201; x1+=10) {      // bottom-left lines
        line(200, 150, x1, x1+20);
    }

    for (var x1 = 200; x1 < 271; x1+=10) {      // bottom-right lines
        line(200, 150, x1, y1+260-x1);
    }


// ORANGE LINES
    strokeWeight(1);
    stroke(253, 205, 167);

    // top set of lines
    for (var x1 = 130; x1 < 201; x1+=10) {       // top-left lines
        line(200, 20, x1, 120+(y1-x1));
    }

    for (var x1 = 200; x1 < 271; x1+=10) {      // top-right lines
        line(200, 20, x1, x1-120);
    }

    // left set of lines
    for (var x1 = 130; x1 < 201; x1+=10) {       // left-top lines
        line(70, 150, x1, 120+(y1-x1));
    }

    for (var x1 = 130; x1 < 201; x1+=10) {       // left-bottom lines
        line(70, 150, x1, x1+20);
    }

    // bottom set of lines
    for (var x1 = 130; x1 < 201; x1+=10) {       // bottom-left lines
        line(200, 280, x1, x1+20);
    }

     for (var x1 = 200; x1 < 271; x1+=10) {      // bottom-right lines
        line(200, 280, x1, y1+260-x1);
    }

    // right set of lines
     for (var x1 = 200; x1 < 271; x1+=10) {     // top-right lines
        line(330, 150, x1, x1-120);
    }

    for (var x1 = 200; x1 < 271; x1+=10) {      // bottom-right lines
        line(330, 150, x1, y1+260-x1);
    }

// BLUE LINES
    strokeWeight(1);
    stroke(140, 164, 212);

    line(130, 150, 200, 80);
    line(200, 80, 270, 150);
    line(130, 150, 200, 220);
    line(200, 220, 270, 150);

// BLUE VERTICES
/*
    strokeWeight(3);
    fill(140, 164, 212);

    point(100, 50);                     // primary geometry vertices (purple)
    point(300, 50);
    point(100, 250);
    point(300, 250);

    point(200, 20);                    // secondary geometry vertices (orange)
    point(70, 150);
    point(200, 280);
    point(330, 150);

    point(200, 150);                   // center of geometry
*/

}
I was able to generate this string art by simply declaring two variables: one for the initial x-coordinate and another for the y-coordinate. I began with the top-left set of purple curves, and translated those appropriately to create the geometry. Things that I could improve are: using rotation to make the code much simpler, and to use variables so the geometry becomes dynamic.
Process work:
afukuda-LookingOutwards04
The Classyfier

The Classyfier by Benedict Hubener, Stephanie Lee and Kelvyn Marte at the Copenhagen Institute of Interaction Design (CIID) is a table that utilizes AI to detect the social scenario (through beverages being consumed) and reciprocates with appropriate music. This project intrigued me, as I was mesmerized with how technology is able to clearly detect and differentiate the difference between the “clanking” of various beverages. And I could see this experimental project being applied to enhance the capabilities of voice recognition technologies such as “echo” and “siri”; currently they are only able to do what they are told to do, but perhaps in the near future they would be able to read (through AI) different situations and act accordingly. The project brief indicated that the table contains a built-in microphone which catches characteristic sounds and compares these sounds to a predetermined catalogue. This catalogue contains three classes – hot beverages, wine and beer, with each class having its own associated playlist that one can navigate through by knocking on the table. Other algorithmic aspects include machine learning, Wekinator, Processing & OFX collection. The creator’s artistic sensibilities does manifest in a tangible or visual manner but rather musically.
Link |
The Classyfier – AI detects situation and appropriates music
(both pages include video)
Work | Benedict Hubener, Stephanie Lee & Kelvyn Marte, unknown year