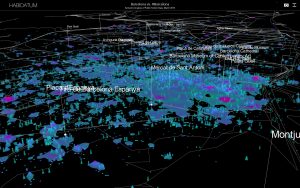
I’ve always been following and interested in Habidatum’s works. They are a data analytics and consulting group that combines multiple layers of GIS data and visualize them in a custom software called Chronotope. They provide simple and easy to understand graphics to convey space-time data and their works had been applied to architecture, master planning, financial, transportation and many other fields. They believe that “by transforming contemporary planning strategies into data-driven adaptive policies, cities and businesses can generate savings, profits and opportunities.”
I think their work is incredible in how it helps the audience grasp multiple layers of data in a straightforward way, and how they can help their clients make informed decisions of their investments that can affect the city’s urban fabric.
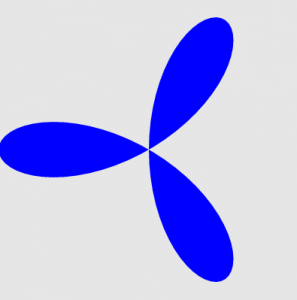
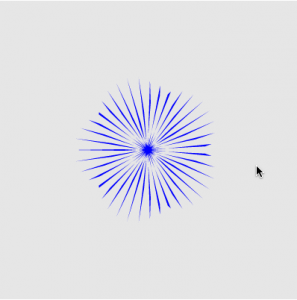
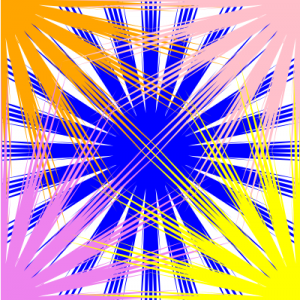
var nPoints = 200;  //set number of vertex points for trifolium shape

function setup() {
    createCanvas(400, 400);
}

function draw() {
    background(255);
    noStroke();

    //draw center trifolium
    push();
    translate(width/2, height/2);
    fill("blue");
    drawTrifolium();
    pop();

    //draw upper left trifolium
    fill("violet");
    drawTrifolium();

    //draw upper right trifolium
    push();
    translate(width, 0);
    fill("violet");
    drawTrifolium();
    pop();

    //draw lower left trifolium
    push();
    translate(0, height);
    fill("violet");
    drawTrifolium();
    pop();

    //draw lower right trifolium
    push();
    translate(width, height);
    fill("violet");
    drawTrifolium();
    pop();
}

//draw Trifolium shape based on mouseX, mouseY
function drawTrifolium() {

    var x;
    var y;
    var r;
    var theta;

    var a = mouseY; //mouseY governs size of trifolium
    var petals = map(mouseX, 0, width, 2, 45); //mouseX governs number of petals
    var petalsInt = round(petals); //rounds petals to nearest integer (no partial petals)

    //create base trifolium shape using equation from Mathworld
    beginShape();
    for (var i = 0; i < nPoints; i++) {
        theta = map(i, 0, nPoints, 0, TWO_PI);
        r = -a * cos(petalsInt * theta);
        x = r * cos(theta);
        y = r * sin(theta);
        vertex(x,y);
    }
    endShape(CLOSE);
}
I found the trifolium curve on Mathworld and decided to see what it could do.
I discovered that changing one number in the equation would cause more “petals” to appear on the trifolium (making it not exactly a “tri”folium anymore, but it looks great), and set this to mouseX. Testing another variable, I found it governed the size of the trifolium shape, so I set this to correspond to mouseY.
To make things more interesting, I added four more trifoliums in the corners of the canvas (so only a corner of each was visible). I started with each one a different color:
…but decided I preferred the patterns that emerged when all 4 corner shapes were the same color, creating a more ambiguous web rather than 4 distinct shapes.
Studio NAND – London 2012 Olympics Tweet Visualization
Studio NAND captured and visualized a few aspects of the global response to the London 2012 Olympic Games by creating an emoto. It was a two part project made up an online visualization as well as an actual installation. The instillation was created using millions of tweets concerning the Olympics to understand the widespread feeling toward any specific part of the Olympic Games such as teams, games, events, etc..
The online visualization was a real time parallel to the actual games and created visualizations throughout the events. This visualizations allowed for exploration and discovery of new events and opinions.
The Physical Instillation was an accumulation and representation of all the data and information collected throughout the games in an interactive and overlayed series of models looking at time of Tweets as well as sentiment.
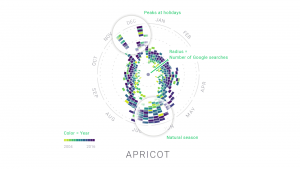
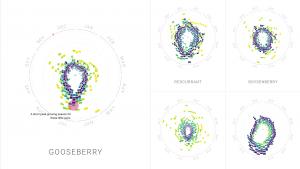
This chart represents the seasonal trends of the search term “apricot”. This representation highlights the the patterns. These charts represent the charts for different fruits.
The Rhythm of Food, by Moritz Stefaner (2015) is a data visualization project that displays patterns of food seasonality based on Google search data over a span of twelve years. This project interested me because it visualizes a set of extensive data in a visually pleasing way through a radial pattern. While this representation is abstract, you can still see the patterns and peaks of food seasonality. The designer developed an algorithm that creates a radial “year clock” that represents food trends. The algorithm is set up so that the distance from the center represents relative search interest, the segments represent search interest in the weeks within the past 12 years, and the color represents the year. The creator implements his artistic sensibilities through color and rhythm. The way the trends are represented radially makes the project seem like a beautiful piece of art at first glance when it actually reflects real life data.
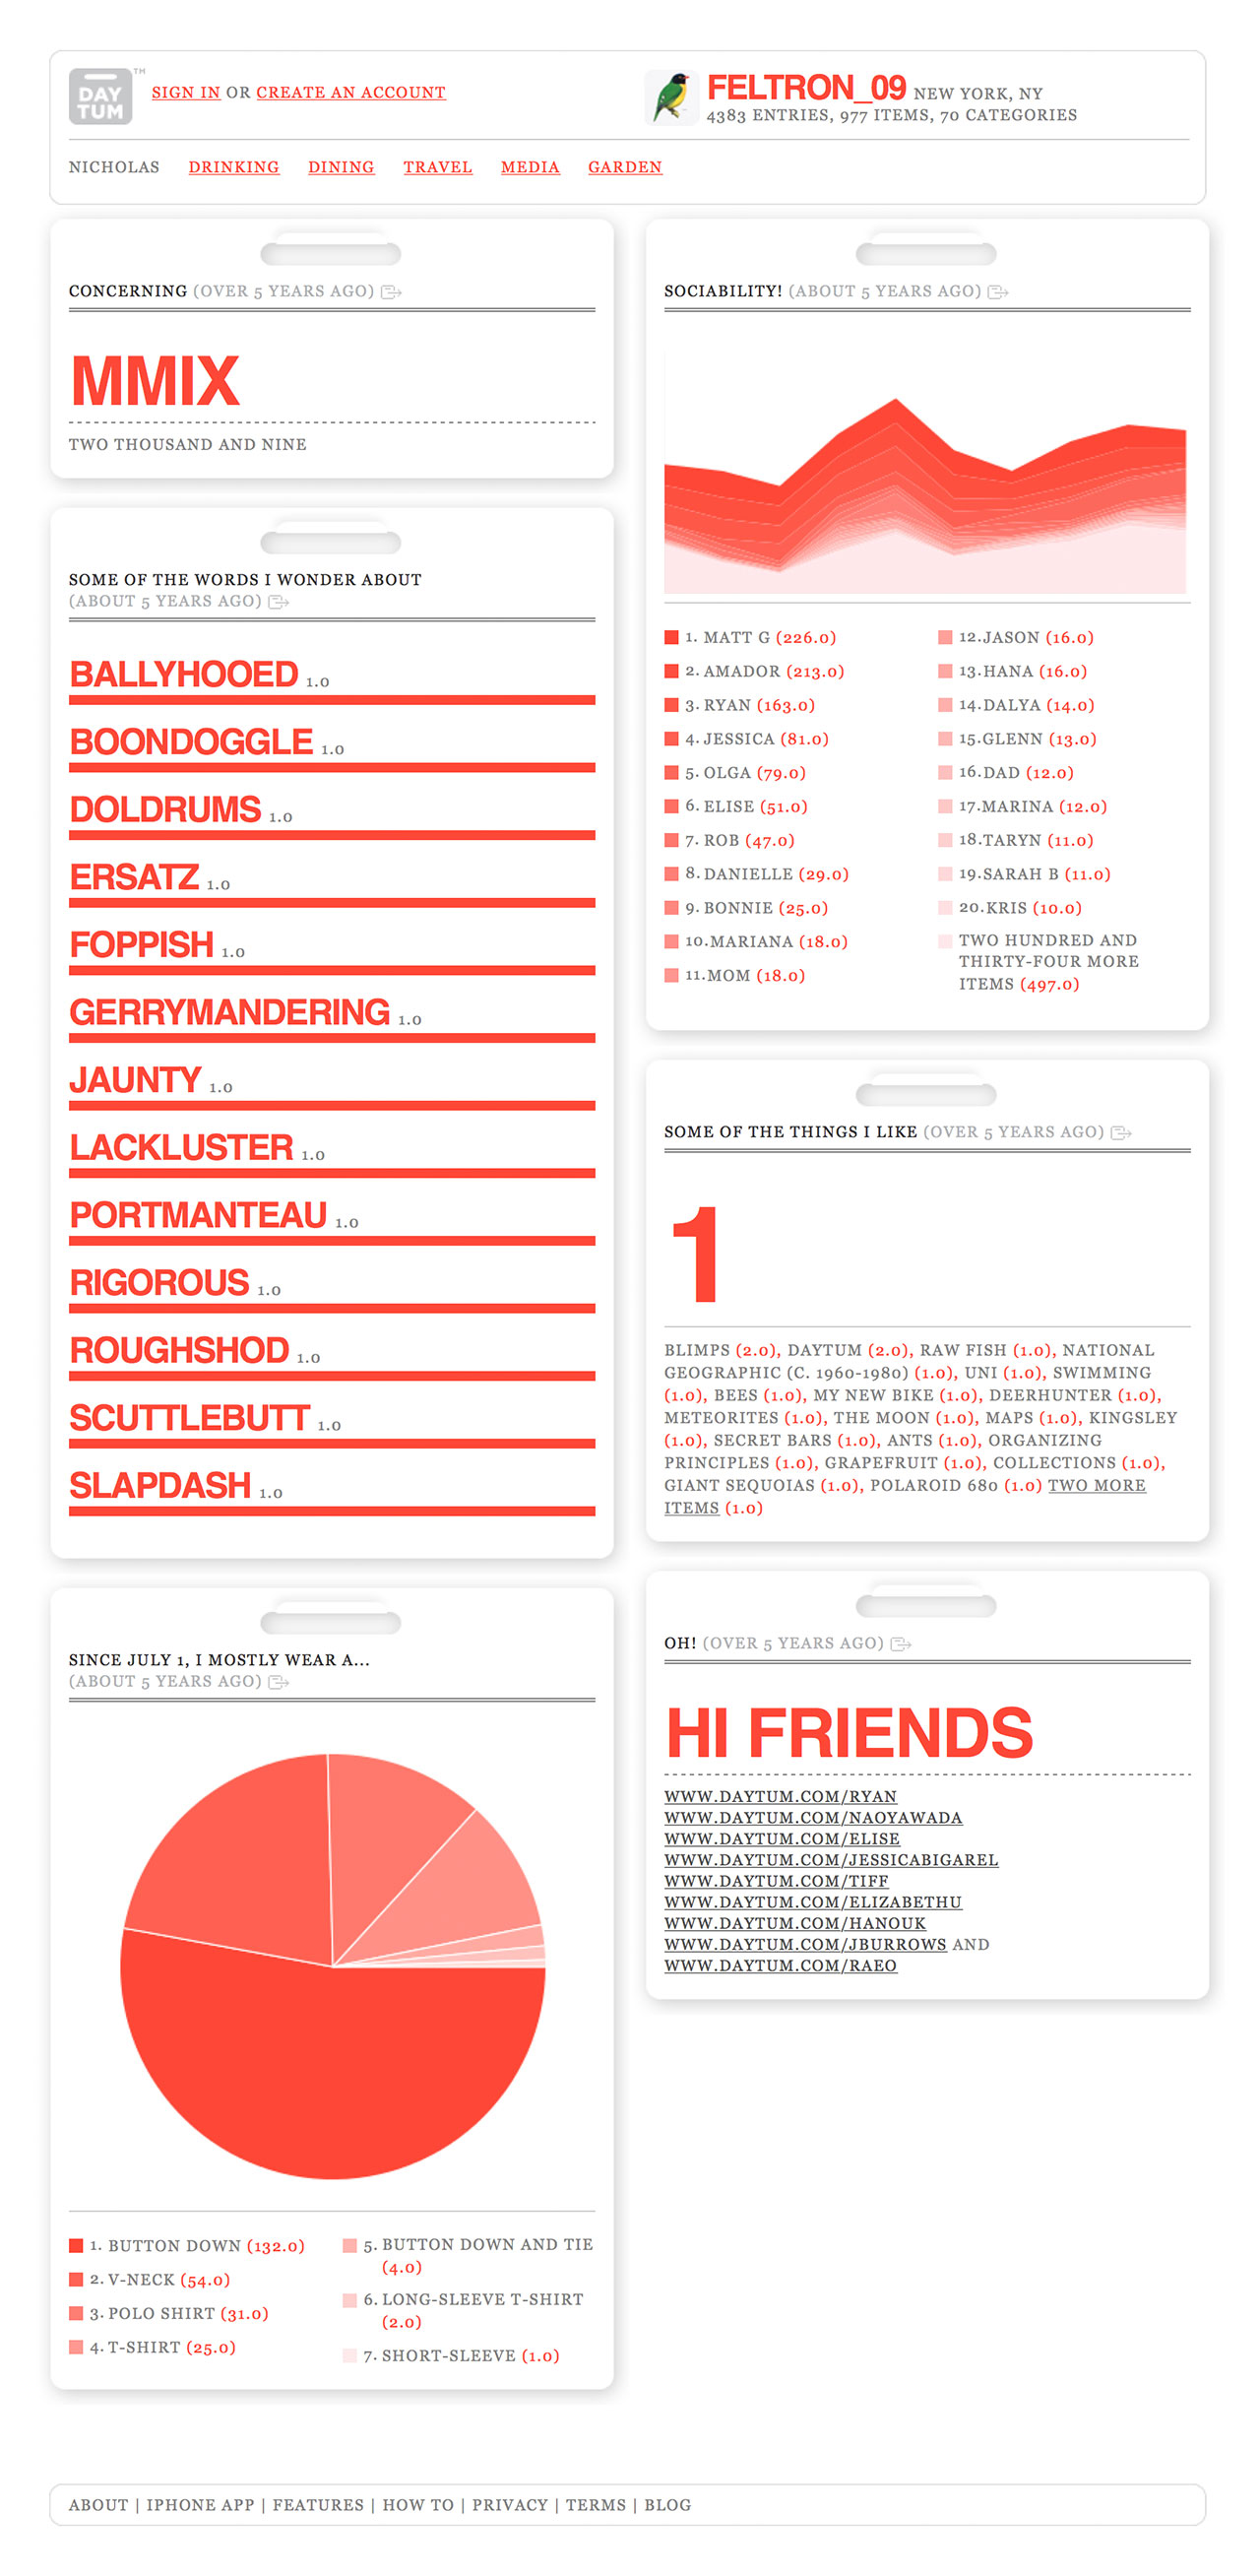
Nicholas Felton is one of my new favorite designers. He is a trailblazer in the field of digital data visualisation, and I am especially interested in his story because he came from traditional graphic design and moved on to creating algorithms that collect data after he realized how much he enjoyed representing it through graphics. I have always been interested in editorial design specifically because a lot of times, it involved an interesting combination of powerful aesthetics and thought-out information representation, and it’s hyper focused on making the reader understand what it’s trying to communicate. Felton does this with his in a lot of his work, and especially in the project Daytum.
A screenshot example of the home panel for Felton’s own account, where his personal statistics are graphed elegantly in front of him.The landing page for the website, which shares data from users around the world as an example of the programs capabilities.
Daytum is a platform an app that collects personal statistics from the user and elegantly communicates them in different ways. The spreadsheets and visuals it produces are created in the spirit of Felton’s famous Annual Reports. Based on the interface and the type of information this app tracks, I’m thinking that it is created with code that takes certain data sets (and has to have different versions or be flexible to different types of data) and then puts them through a program that organizes the data points in relationship to each other and plots/prints them in different formats. What I find interesting, as a communications designer who is currently studying typography, is that the program probably has to account for formatting errors and irregularities that come with differing data: longer words that change the word spacing, numbers that contain decimals or are greater/less than zero, and orphaned words and other paragraph issues. I think what makes this program so elegant is Felton’s eye for clean design, so that these personal data points are plotted neatly and elegantly no matter what they are.
This project was released in 2008. I know there are a lot of similar and far more developed apps out there now, but this is on the first times an iPhone app took on this form, and I think thats important.
/*
Xindi Lyu
Section A
xindil@andrew.cmu.edu
*/


var nPoints = 100;
var HYPOCYCLOID = 1;
var EPICYCLOID = 0;
var curveMode = HYPOCYCLOID;

function setup() {
    createCanvas(500, 500);
    frameRate(10);
        }


function draw() {

    push();
    translate(250,250);
    switch (curveMode){
        case HYPOCYCLOID:
        drawHypocycloid();
        break;
        case EPICYCLOID:
        drawEpicycloid();
        break;
    }
    pop();


    }


function drawHypocycloid() {//drawcurve
    background(200,200+mouseX*0.1,200+mouseY*0.1);//make the changing background for Hypocycloid
    var x;
    var y;
    var a=map(mouseX, 0, 500, 1, 100);//size of the geometry
    var n=map(mouseX, 0, 500, 1, 15);//devision of thhe curve
    fill(200,150+mouseX*0.1,200+mouseY*0.1);//fill the geometry with changing color

    stroke(0.4*mouseX+0.4*mouseY);//change the ourline color
    beginShape();
    for(var i=0; i<nPoints; i++){
        var t = map(i, 0, nPoints, 0, 2*PI);
        x=a*(((n-1)*cos(t)+cos((n-1)*t))/n);
        y=a*(((n-1)*sin(t)-sin((n-1)*t))/n);
        vertex(x+random(-5,5),y+random(-5,5));
    }
    endShape(CLOSE);
}


function drawEpicycloid() {//drawcurve
    background(200,150+mouseX*0.1,200+mouseY*0.1);//make the changing background for Epicycloid
    var x;
    var y;
    var a=map(mouseX, 0, 500, 1, 100);//size of the geometry
    var n=map(mouseY, 0, 500, 1, 15);//devision of thhe curve
    fill(200,200+mouseX*0.1,200+mouseY*0.1);;//fill the geometry with changing color
    stroke(0.4*mouseX+0.4*mouseY);
    beginShape();
    for(var i=0; i<nPoints; i++){
        var t = map(i, 0, nPoints, 0, 2*PI);
        x=(a+n)*cos(t)-n*cos((a+n)/n*t);
        y=(a+n)*sin(t)-n*sin((a+n)/n*t);
        vertex(x+random(-5,5),y+random(-5,5));
    }
    endShape(CLOSE);
}

function mousePressed(){
    curveMode = 1- curveMode;//switch between geometries
}
For this project I experimented with two different types of curves and rendering them with the jittering effect to add a lively feeling to the image.
/* Jenna Kim (Jeeyoon Kim)
Section E
jeeyoonk@andrew.cmu.edu
Project 7
*/

var nPoints = 360

function setup() {
    createCanvas(500, 500);

}

function draw() {
	//drawing curve
	background(130, 20, 40);
	push();
	translate(width / 2, height / 2);
	drawAstroidCurve();
	pop();

	fill(255, 100);
	textSize (30);
	textFont('Roboto');

	text("CHAOS", width / 2 - 50, 480);
}

function drawAstroidCurve() { //
	// Astroid;
	//Link: http://mathworld.wolfram.com/Astroid.html
	var x;
	var y;
	var xR = constrain(mouseX, 0, 500);
	var ellipseR = map(mouseX, 0, 500, 10, 120);
	var a = map(xR, 0, 500, 40, 30);
	var b = map(xR, 0, 500, 50, 300);
	var h = constrain(mouseY, 0, 400);


	stroke(255);
	strokeWeight(0.5);

	//chaotic ASTROID CURVE
	beginShape();
	fill(130, 20, 40);
	for (var i = 0; i < nPoints; i++) {
		x = (4 * a * cos(i)) + (b * cos(3 * h * i));
	    y = (2 * a * sin(i)) - (b * sin(3 * h * i));
        vertex(x, y);
	};
	endShape(CLOSE);

	noStroke();
	fill(255);
	ellipse(3, 5, ellipseR, 50);
}
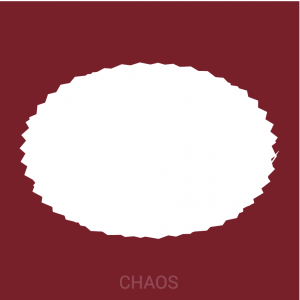
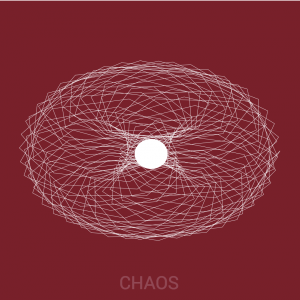
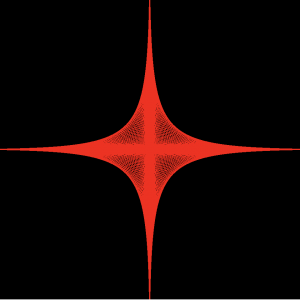
For this project, I wanted curves that combine to create a chaotic feeling. The ellipse in the middle is supposed to represent a ball of string, and make the whole canvas look like the string is “unraveling” from the ball of string (the ellipse in the middle). I used an Astroid curve from the MathWorld site to reference the function. At first, I was confused on how to utilize map(); and constrain(); to explore different curves and its sizes and limits. However, I eventually understood these concepts through this project. Throughout out the project, I was really amazed on how many variations of curves an asteroid that create although I input certain constraints.
Below are my process work. The top picture shows that I struggled for awhile on how to make the curves show in thin lines. I realized that I had to fill them with background color. The bottom picture is another part of the process. I explored different constrain();.
/* Jaclyn Saik
Section E
jsaik@andrew.cmu.edu
Project 07
*/

var maxP = 100; //boundary for points plotted by the curve
var chang = 1; //variable ised for flipping orientation of fish curve


function setup() {
    createCanvas(480, 480);
    noStroke();
}

function draw() {
    background("PaleTurquoise");
    textSize(10);
    noStroke();
    fill("LightSeagreen");
    text("click me! yay!", 30, 70);
    text("¡a fish that is math!", 80, 300);
    text("math", 270, 400);
    text("glug....glug", 60, 430);
    text("so interactive!", 350, 30);

    translate(width/2, height/2); //puts axis in center of the canvas
    if (mouseIsPressed) { //sets if statement that inverses fish curve when mouse is pressed
                chang = -1;
            } else {
                chang = 1;
            }
            print(chang);
    drawFishie(); //calls fish function
    drawFishie2();
    drawFishie3();
    drawFishie4();
}

function drawFishie() {
        var x; //x value for fish curve parametric equation
        var y; //y value for fish curve parametric equation
        var a = constrain(mouseY, 20, 450); //constrains a to value between 20 and 450
        var consT = map(mouseX, 0, width, 1, 5); //maps consT so that mouse X plots a number between 1 and 5
        stroke("peachpuff");
        fill("lightpink");

        beginShape();
        for (var i = 0; i < maxP; i++) { //for loop that sets maxiumum points form variable above
            var t = map(i, 0, maxP, 0, TWO_PI);

        //fish curve
        //http://mathworld.wolfram.com/FishCurve.html

        x = (a * cos(t)) - ((chang)*((a*(sq(sin(t))))) / 2); //change varibale inverses curve when mouse is pressed
        y = (a* cos(t) * (consT)*sin(t));  //constant manipulates the height of
        // the curve based on mouse x position
        vertex(x, y);
    }
    endShape(CLOSE);
}

function drawFishie2() { //outline, which is slightly off
        var x; //x value for fish curve parametric equation
        var y; //y value for fish curve parametric equation
        var a = constrain(mouseY, 20, 450); //constrains a to value between 20 and 450
        var consT = map(mouseX, 0, width, 1, 10); //maps consT so that mouse X plots a number between 1 and 5
        stroke("tomato");
        strokeWeight(2);
        noFill();

        beginShape();
        for (var i = 0; i < maxP; i++) { //for loop that sets maxiumum points form variable above
            var t = map(i, 0, maxP, 0, TWO_PI);

        //fish curve
        //http://mathworld.wolfram.com/FishCurve.html

        x = (a * cos(t)) - (.5*(chang)*((a*(sq(sin(t))))) / 2); //change varibale inverses curve when mouse is pressed
        y = (a* cos(t) * (consT)*sin(t));  //constant manipulates the height of
        // the curve based on mouse x position
        vertex(x, y);
    }
    endShape(CLOSE);
}

function drawFishie3() { //outline, which is slightly off
        var x; //x value for fish curve parametric equation
        var y; //y value for fish curve parametric equation
        var a = constrain(mouseY, 20, 400); //constrains a to value between 20 and 450
        var consT = map(mouseX, 0, width, 0, 5); //maps consT so that mouse X plots a number between 1 and 5
        stroke("salmon");
        strokeWeight(8);
        noFill();

        beginShape();
        for (var i = 0; i < maxP; i++) { //for loop that sets maxiumum points form variable above
            var t = map(i, 0, maxP, 0, TWO_PI);

        //fish curve
        //http://mathworld.wolfram.com/FishCurve.html

        x = (a * cos(t)) - (.5*(chang)*((a*(sq(sin(t))))) / 2); //change varibale inverses curve when mouse is pressed
        y = (a* cos(t) * 7*(consT)*sin(t));  //constant manipulates the height of
        // the curve based on mouse x position
        vertex(x, y);
    }
    endShape(CLOSE);
}

function drawFishie4() { //outline, which is slightly off
        var x; //x value for fish curve parametric equation
        var y; //y value for fish curve parametric equation
        var a = constrain(mouseY, 20, 450); //constrains a to value between 20 and 450
        var consT = map(mouseX, 0, width, 0, 6); //maps consT so that mouse X plots a number between 1 and 5
        stroke("orange");
        strokeWeight(5);
        noFill();

        beginShape();
        for (var i = 0; i < maxP; i++) { //for loop that sets maxiumum points form variable above
            var t = map(i, 0, maxP, 0, TWO_PI);

        //fish curve
        //http://mathworld.wolfram.com/FishCurve.html

        x = (a * cos(t)) - (.7*(chang)*((a*(sq(sin(t))))) / 2); //change varibale inverses curve when mouse is pressed
        y = (a* cos(t) * 10*(consT)*sin(t));  //constant manipulates the height of
        // the curve based on mouse x position
        vertex(x, y);
    }
    endShape(CLOSE);
}
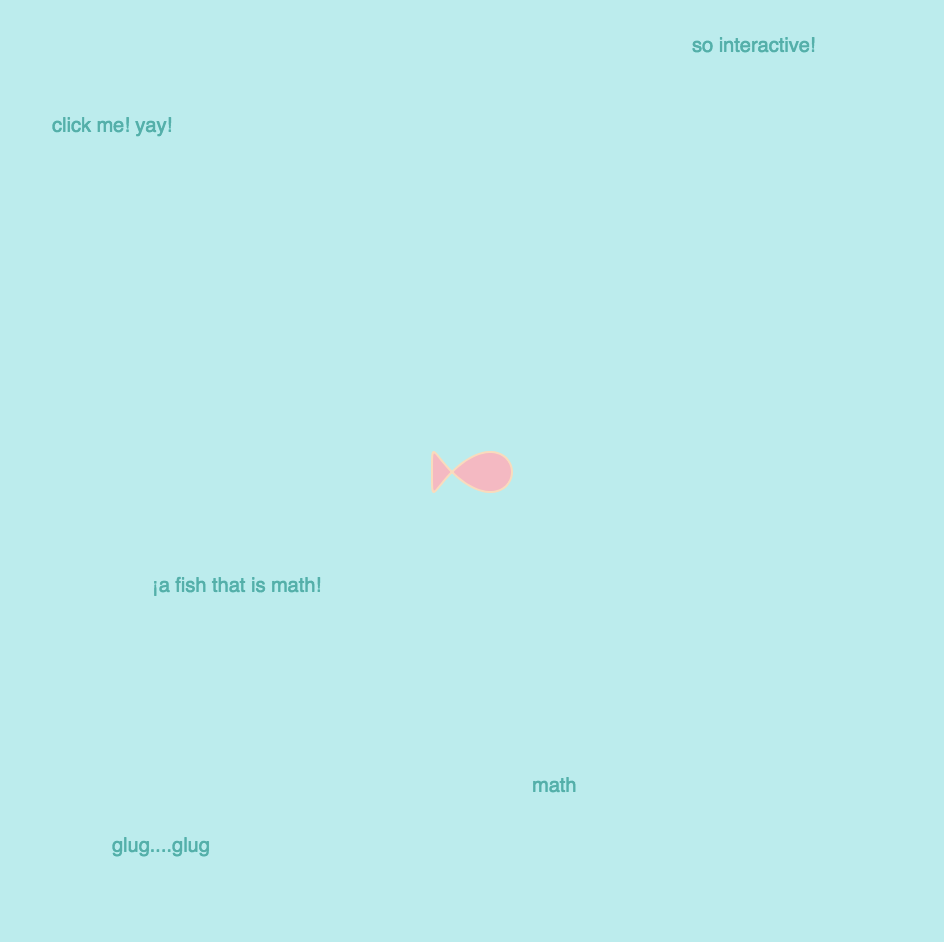
Fish Curve!
For this project, I had to experiment a lot with figuring out a way to build a shape that relied on the equations I gave it. I hadn’t really thought about it before, but we have been creating equations for the for loops we’ve been generating these past 2 weeks, so once I wrapped my head around this concept, I was able to understand how to plug these equations in and turn them into code. I originally played around with a cruciform curve (which I forgot to screenshot!), but after figuring out the fish curve, I wasn’t as inspired by it’s shape. The fish curve, by the way, is a curve that is based off an ellipse’s equation, with a pedal point at a specific point of eccentricity e^2 = 1/2. I had fun manipulating the variables on my various curves so that the different fish outlines took on slightly different characteristics, and adding interactions (click on screen!).
My first fish I created (after experimenting with a couple other types of curves, which I forgot to document. At first, I wanted to make the fish tiny like an actual fish, but I decided something that grew with the mouse was more exciting.
// Jisoo Geum
// Section B
// jgeum@andrew.cmu.edu
// Project-07
var x;
var y;
var bR; // big radius outside
var r; // smaller radius inside
var d; // distance from the center of the interior circle
var mx; // mouseX
var my; // mouseY

function setup() {
    createCanvas(480, 480);
}

function draw() {
    background(255,0,0);
    translate(width/2, height/2);
    noFill();
    mx = constrain(mouseX,0, width);
// draw a Hypotrochoid with ellipses
        strokeWeight(1);
        stroke(255);
        for (var a = 0; a < 2*TWO_PI; a ++){ // a is angle
            bR = 50; // big radius
            r = map( mx, 0, width, 10, 65 ); // small radius
            d = map( mx, 0, width, 10, 100 ); // distance
            x = (bR-r)*cos(a) + d*cos( ((bR-r)/r)*a ) ;
            y = (bR-r)*sin(a) - d*sin( ((bR-r)/r)*a ) ;
        ellipse(0,0,x*5,y*7);
        }

// draw Nephroid
            strokeWeight(0.25);
            stroke(255);
            for (var a = 0; a < 10*TWO_PI; a ++){ // a is angle
                bR = map( mx, 0, width, 0, 130 ); // big radius
                x = bR*((3*cos(a)) -  (cos(3*a))) ;
                y = bR*((3*sin(a)) -  (sin(3*a))) ;
            ellipse(0,0,x*30,y*15);
            }

// draw Hypotrochoid
    beginShape();
        strokeWeight(.75);
        stroke(255);
        for (var a = 0; a < 25*TWO_PI; a ++){ // a is angle
            bR = 200;   // big radius
            r = map( mx, 0, width, 10, 130 ); // small radius
            d = map( mx, 0, width, 10, 300 ); // distance
            x = (bR-r)*cos(a) + d*cos( ((bR-r)/r)*a ) ;
            y = (bR-r)*sin(a) - d*sin( ((bR-r)/r)*a ) ;
        vertex(x,y);
        }
    endShape();

}
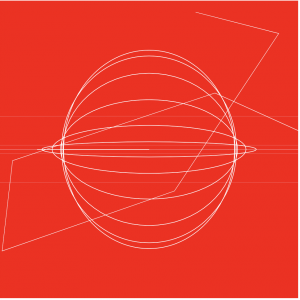
I first went to WolframMathworld website too look for shapes that I found interesting. I eventually decided to use the equations for hypotrochoid and nephroid since I thought the combination of roulette and plane curves would make a good contrast. Although the curves in the final iteration didn’t turn out as I thought, I thought that the shapes were still interesting.
These are the process images before I adjusted the limits in the for loops and the parameters of vertex & shapes. If I could change anything from the final design, I would adjust the map() more so that the movement would look more organized.
/*
Mimi Jiao
wjiao@andrew.cmu.edu
Section E
Project 7
*/

var mousepress; //boolean for switching states in mousePressed()
var r = 255; //initial color variable
var power = 33; //exponent for astroid functions
var scaleFactor = 1; //scaling elements variable
var increaseScale = .01; //variable for if statement in altering scale

function setup() {
    createCanvas(480, 480, WEBGL);
    background(0, 0, 255);
}

function draw() {
    background(0, 0, 0);
    strokeWeight(random(.4,.6)); //random strokeweight for jitter effect
    stroke(0, 0, 255);

    //drawing the rainbow background
    push();
    translate(0, 0, -100);
    drawBG();
    pop();

    //drag mouse to rotate astroids around X and Y axis
    if (mouseIsPressed) {
        rotateX(mouseX * .01);
        rotateY(mouseY * .013);
    }
    //rotate astroids
    rotateZ(frameCount * .02);
    rotateX(frameCount * .001);
    rotateY(frameCount * .01);
    stroke(0, 0, 255);
    ellipsoid(25, 25, 25); //center ellipsoid
    stroke(0, 255, 0);
    scale(scaleFactor); //scaling the astroids

    //constantly scales up and scales down the astroids
    if (scaleFactor < 5 & scaleFactor >= 1) {
        scaleFactor += increaseScale;
    }else if (scaleFactor >= 5) {
        increaseScale = -increaseScale;
        scaleFactor += increaseScale;
    }else if (scaleFactor === .99) {
        increaseScale = -increaseScale;
        scaleFactor = 1;
    }

    //drawing the astroids & rotating them to form a spike
    drawAstroid();
    push();
    rotateZ(5);
    rotateX(3);
    rotateY(4);
    drawAstroid2();
    pop();
    push();
    rotateZ(3);
    rotateX(4);
    rotateY(5);
    drawAstroid2();
    pop();
    push();
    rotateZ(3);
    rotateX(4);
    rotateY(5);
    drawAstroid();
    pop();
    push();
    rotateZ(4);
    rotateX(3);
    rotateY(5);
    drawAstroid();
    pop();
    push();
    rotateZ(4);
    rotateX(3);
    rotateY(5);
    drawAstroid2();
    pop();

}

//first draw astroid function
function drawAstroid() {
    mappedMouseX = map(mouseX, 0, width, 0, 12);
    beginShape();
    noFill();
    for(var i = 0; i <  250 * TWO_PI; i ++) {
        stroke(0 , 255, 0);
        vertex(300 * (cos(i)**power),
             300 * (sin(i)**power));
        //changes color of astroid based on mouseY
        if (mouseY >= height / 2) {
            stroke(r , 0, 0);
        }

    }
    endShape();
}

//second draw astroid function (different color)
function drawAstroid2() {
    mappedMouseX = map(mouseX, 0, width, 0, 12);
    beginShape();
    noFill();
    for(var i = 0; i < 250 * TWO_PI; i ++) {
        stroke(-r , 255, r);
        vertex(300 * (cos(i)**power),
             300 * (sin(i)**power));

    }
    endShape();
}

//drawing the rainbow background
function drawBG() {
    push();
    for (var i = 0; i < 1000; i++) {
        noFill();
        stroke(i * sin(i) + 455, i * cos(i), sin(i) * width);
        beginShape();
        vertex(sin(i) * 900, cos(i) * 900,
               sin(i)* 900);
        vertex(sin(i) * 850, cos(i) * 850,
               cos(i) * 850);
        vertex(cos(i), sin(i), sin(i));
        endShape(CLOSE);
    }
    pop();

}

//if mouse is pressed, change color of specific astroids
function mousePressed() {
    if (mousepress === true) {
        r = random(20, 255);
    } else {
        r = 255;
    }
    mousepress = !mousepress;
}
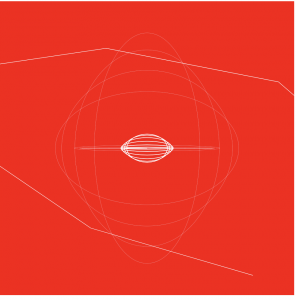
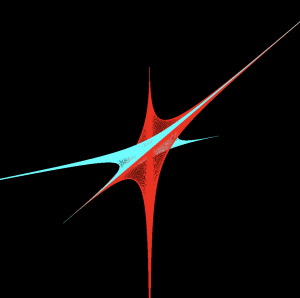
I wanted to continue along the same path as I did for my project last week by using WEBGL again. This time, I really wanted to create a more 3D object that didn’t only exist on one plane, so I tried to play around with rotating the X, Y, and Z axis for the astroids. For this project, I utilized the mousePressed function and mouseIsPressed to play around with interaction. Here are some of my previous explorations below.
![[OLD FALL 2018] 15-104 • Introduction to Computing for Creative Practice](../../../../wp-content/uploads/2020/08/stop-banner.png)