I really enjoyed Sophie Chen’s Looking Outwards 4, where she talked about computational musical artist Ryoji Ikeda. He specializes in creating sounds based on data and his works are a form of data visualization. In Ikeda’s work data.path, I agree with Sophie’s point that audio and visual perception are intertwined and are integral to each other’s perceptions. I, too, am interested in how the two tie together to create an environment. I am really intrigued by data.path specifically because the darkness of the installation space, paired with the visuals and audio, creates a sense of spatial dimension even when the user is standing still. The lack of light in the space dulls the viewer’s sense of perception and they become more receptive to the audio and visual installation. I am really interested in this experience and I would love to experience it first hand. Ikeda’s work demonstrates the strength audiovisual elements have on the experience and perception of a space, and his work perfectly demonstrates ways computation can be applied to artistic rendering.
//Jonathan Liang
//jliang2
//section A

var springy = 0.7; // how much velocity is retained after bounce
var np = 50;      // how many particles

var underlyingImage;

function preload() {
    var myImageURL = "https://i.imgur.com/obcoL1tl.jpg";
    underlyingImage = loadImage(myImageURL);
}


function particleStep() {
    var ix = constrain(floor(this.x), 0, width-1);
    var iy = constrain(floor(this.y), 0, height-1);
    var theColorAtLocationXY = underlyingImage.get(ix, iy);

    noStroke();
    fill(theColorAtLocationXY)
    ellipse(this.x, this.y, 5);


    this.x += this.dx;
    this.y += this.dy;


    if (this.x > width) { // bounce off right wall
        this.x = width - (this.x - width);
        this.dx = -this.dx * springy;
    } else if (this.x < 0) { // bounce off left wall
        this.x = -this.x;
        this.dx = -this.dx * springy;
    }
    if (this.y > height) { // bounce off bottom
        this.y = height - (this.y - height);
        this.dy = -this.dy * springy;
    } else if (this.y < 0) { // bounce off top
        this.y = -this.y;
        this.dy = -this.dy * springy;
    }

}


// create a "Particle" object with position and velocity
function makeParticle(px, py, pdx, pdy) {


    p = {x: px, y: py,
         dx: pdx, dy: pdy,
         step: particleStep,
        }
    return p;
}

var particles = [];
var randx = [];
var randy = [];

function setup() {
    createCanvas(380, 480);
    background(0);
    underlyingImage.loadPixels();
    for (i = 0; i < np; i++) {
        randx[i] = random(-50, 50);
        randy[i] = random(-50, 50);
    }
    frameRate(5);
}


// draw all particles in the particles array
//
function draw() {
    background(230);
    for (var i = 0; i < np; i++) {
        // make a particle
        var p = makeParticle(200, 350,
                             randx[i], randy[i]);
        // push the particle onto particles array
        particles.push(p);
    }

    for (var i = 0; i < particles.length; i++) { // for each particle
        var p = particles[i];

        p.step();
    }

}
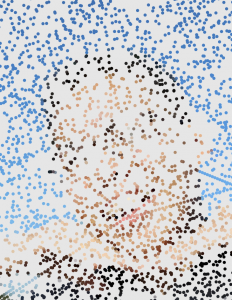
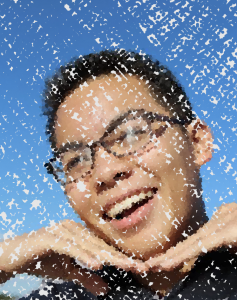
I chose a picture of my friend from high school. I wanted the ellipses that generated the image to first start from his mouth and then bounce everywhere to generate the image. Kind of like vomiting, but with a more artistic result. The ellipses slow down after they hit the walls so that it is clearer that they are bouncing and not just randomly generating wherever they want. Below is a few screenshots of the image being generated over time.
//Sophie Chen
//Section C
//sophiec@andrew.cmu.edu
//project-09

var underlyingImage;
var p = 70; // text starting size

function preload() {
    var myImageURL = "https://i.imgur.com/jr1cT80.jpg";
    underlyingImage = loadImage(myImageURL);
}

function setup() {
    createCanvas(400, 600);
    background(0);
    underlyingImage.loadPixels();
    frameRate(10);
}

function draw() {
    var coordX = random(width);
    var coordY = random(height);
    var x = constrain(floor(coordX), 0, width-1);
    var y = constrain(floor(coordY), 0, height-1);
    var color = underlyingImage.get(x, y);
    noStroke();
    p -= 0.2; // each text's size decreases by 0.2
    textSize(p);
    fill(color);
    text('lil', coordX, coordY);

    // stop decreasing text size once it reaches 20
    if (p < 20){
    	p = 20;
    }


}
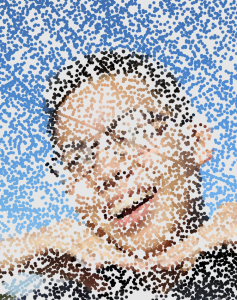
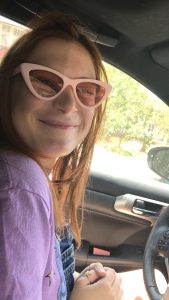
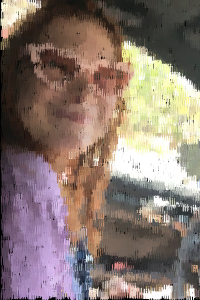
I enjoyed this project a lot, I used this picture of my friend Sabrina. The word “lil” is what forms the image- I made it start pretty big to block out the general color scheme, and as the image continues to draw it gets smaller and smaller so the image is more detailed, which I personally found more interesting/enjoyable to watch than when I had the text stay the same size the entire time.
/*Kevin Riordan
Section C
kzr@andrew.cmu.edu
project_09*/
var underlyingImage;
//making count variable, for end point and for switching point
var count = 0;

function preload() {
    var myImageLink = "https://i.imgur.com/UPry60m.jpg";
    myImage = loadImage(myImageLink);
}

function setup() {
    noStroke();
    createCanvas(480, 480);
    background(0);
    myImage.loadPixels();
}

function draw() {
    var posX = random(width);
    var posY = random(height);
    rectMode(CENTER);
    //front half uses createRect function
    if(count <= 5000) {
        var countMap1 = map(count,0,5000,100,20);
        createRect(int(posX),int(posY),countMap1 / 10);
        count++;
    }
    //back half uses detailedRect function
    else if(count <= 10000) {
        createDetailRect(posX,posY,2);
        count++;
    }
}
//making larger crosses at the beginning
function createRect(initialX, initialY, size) {
    var iX = constrain(floor(initialX), 0, width - 1);
    var iY = constrain(floor(initialY), 0, height - 1);
    var pixelColor = myImage.get(iX, iY);
    fill(pixelColor);
    for(var i = size; i > 0; i --) {
        var cCoord = map(i,0,size,size * 2,0);
        rect(initialX + cCoord,initialY,i,i);
        rect(initialX - cCoord,initialY,i,i);
        rect(initialX,initialY - cCoord,i,i);
        rect(initialX,initialY + cCoord,i,i);
    }
}
//making detailed shapes for the end
function createDetailRect(initialX, initialY, size) {
    var iX = constrain(floor(initialX), 0, width-1);
    var iY = constrain(floor(initialY), 0, height-1);
    var pixelColor = myImage.get(iX, iY);
    fill(pixelColor);
    for(var change = 0; change <= 12; change ++) {
        var side = map(change,0,12,1,0);
        rect(initialX + (change / 2),initialY,size * side,size * side);
        rect(initialX,initialY + (change / 2),size * side,size * side);
        rect(initialX + (change / 2),initialY + (change / 2),size * side,size * side);
        rect(initialX - (change / 2),initialY,size * side,size * side);
        rect(initialX,initialY - (change / 2),size * side,size * side);
        rect(initialX - (change / 2),initialY - (change / 2),size * side,size * side);
        rect(initialX + (change / 2),initialY - (change / 2),size * side,size * side);
        rect(initialX - (change / 2),initialY + (change / 2),size * side,size * side);
    }
}
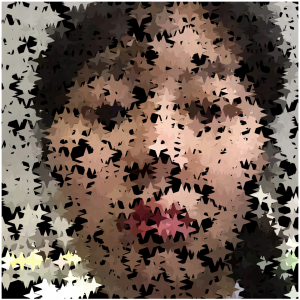
I started this project by making a function based on the example code in the project description. It was pretty cool modifying the code and seeing what shapes appeared, and I played around with making an overall count variable that caused the size to decrease, increasing the detail. If I had more time, I would have played around with constraining the detailing after the count was above 5000, to constrain it to areas that had not been filled in. Overall, though, I am pretty satisfied with this project.
picture at beginning (count <2500)picture during middle (count = 5000)picture at end (count = 10000)reference picture i used for underlying image
I reflected on Christine Chen’s Looking Outwards 3 post. I agree with Christine in that nature is actually way more complex than the artificial world, although many of us believe that the artificial world is more complex. Because nowadays, mankind is so much more familiar with technology rather than nature, we tend to focus on the complex parts of our world, than the natural world. Although we use our developments to help create the things that we need, it is true that nature does the process “naturally” and that is the amazing part about how much computation we have to do to even copy a part of nature, like shown in Iris Van Herpen’s dress. Herpen’s artwork was Decrypt Kymono, a part of the Data Dust series in 2018. She attempted to showcase different aspects of nature, like texture and patterns through an artificially made dress. It is amazing how she was able to bring together art, nature and technology under one dress.
// Xiaoying Meng
//B
//xiaoyinm@andrew.cmu.edu
//Project 9

var IMG;//store image
var x; //Grid X
var y; // Grid Y

//load image
function preload(){
    var ImageURL = "https://i.imgur.com/MMbPIxn.png"
    IMG = loadImage(ImageURL);
}

function setup(){
    createCanvas(480,480);
    //Get pixels from image
    IMG.loadPixels();
}

function draw(){
    background(0);
    drawGrid();
}

function drawGrid(){
    //Creating Grid
    for( x=0; x<480; x=x+10){
        for ( y=0; y<480; y=y+10){
            //Colors from image at x,y location
            var theColorAtLocationXY = IMG.get(x,y);
            //Distance between mouse location and circle location
            var d = dist(mouseX, mouseY,x,y);
            //Change circle size according to distance
            var col = map(d,0,480,10,2);
            noStroke();
            fill(theColorAtLocationXY);
            ellipse(x,y,col,col);
        }
    }
}
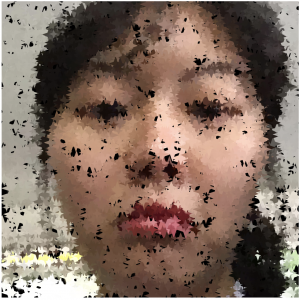
I used my selfie as the source image. I wanted to create something grid base and also interactive. So I change the sizes of the circles based on the distance between circles and mouse.
/*
Connor McGaffin
Section C
cmcgaffi@andrew.cmu.edu
Project-09
*/

var nick;
var i = 17.5;
var circ = i / 2;

function preload() {
    var myImageURL = "https://i.imgur.com/v0CY2zp.jpg";
    nick = loadImage(myImageURL);
}

function setup() {
    createCanvas(480, 480);
    nick.loadPixels();
    frameRate(10);
    noStroke();
}

function draw() {
        gridImg();
        bar();
        repaint();
}

function bar() {
    if(mouseIsPressed){
        fill(0, 45, 80);
        rect(0, 0, width, 2 * i);
    } else {
        fill(0, 80, 45);
        rect(0, 0, width, 2 * i);
    }
}

function repaint(){
    if(mouseIsPressed){
        for(var px = 0; px < width; px += i){
            for(var py = 2 * i; py < height; py += i){
                fill(random(0,20),random(50,90),random(50,110));
                ellipse(px + (i / 2), py + (i / 2), circ);
            }
        }
    }
}

function gridImg() {
    for(var px = 0; px < width; px += i){
        for(var py = 0; py < height; py += i){
            var ix = constrain(floor(px), 0, width - 1);
            var iy = constrain(floor(py), 0, height - 1);
            var theColorAtLocationXY = nick.get(ix, iy);
            fill(theColorAtLocationXY);
            rect(px, py, i, i);
            fill(random(0,20),random(50,110),random(50,90));
            ellipse(px + (i / 2), py + (i / 2), circ);
        }
    }
}
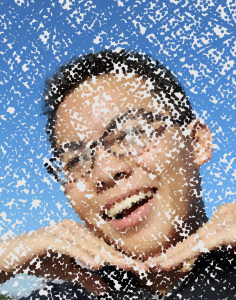
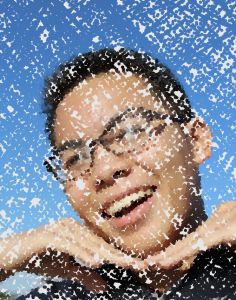
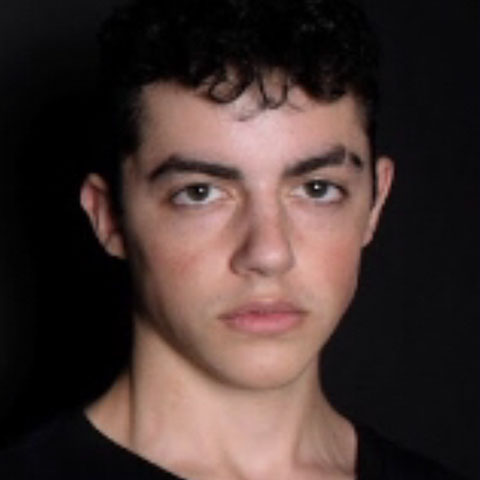
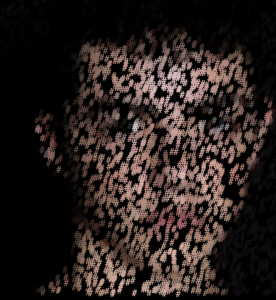
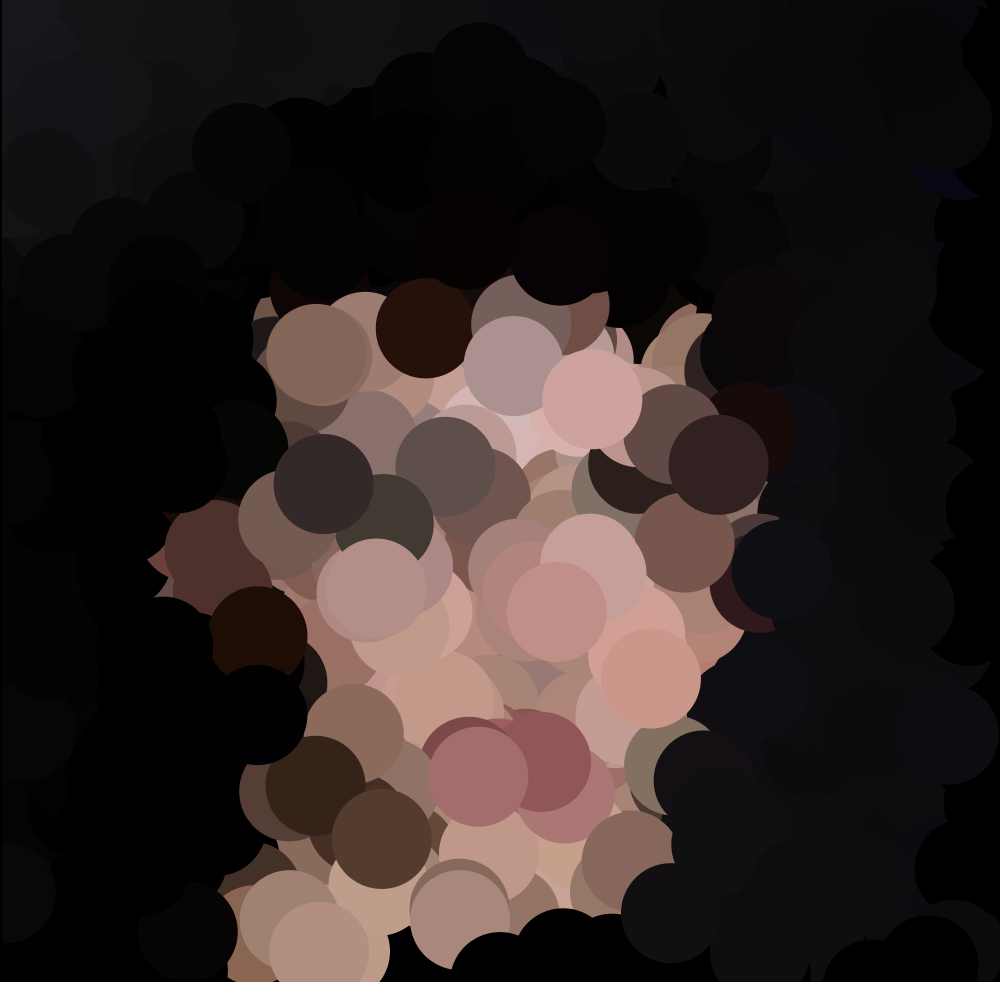
In the project brief, I was most excited by the work of Chuck Close. I was interested in the construction of his portraits and how he can create new colors simply by nesting circles within polygons. I wanted to find the overlap between systematic painting techniques and digital media. Knowing that Close uses complimentary colors to create his specific optical hues, I selected green and blue to compliment the pinks and rust oranges in the photo of my friend, Nick.
Once I created the gridded out and dotted portrait, I wanted to make it feel less static. To do this, I randomized each circle so that the colors are statistically more likely to be a shade of green, but when the viewer clicks on the portrait, these dots shift towards favoring shades of blue.
I genuinely enjoyed this project once I got the hang of it. Sending progress pictures of the portrait to my friend drove me to keep pushing myself forward.
the original photoearly experimentation where the “#” symbol was generating his face over timethe result of scaling up the ellipses encouraged me to explore the more abstract
Images from the UK cities line
When going through various Looking Outwards, I found a post by Curran which talked about a 2018 Craig Taylor/Ito Design project called Coral Cities that was an interesting take on mapping cities. As a fellow architecture student, I found this project really cool but also really simple. It’s not much different than what Walkscore’s doing (here‘s an example using their API) in measuring travel times from a point, and it just takes that data, adds an aesthetics-only gradient and gradually increases its elevation and tapers off. I think what helps is the really stunning rendering that’s clean and makes the forms really pop. I think it’s worth noting that the run of data that focused on the most livable cities came from an existing list by Mercer and the displayed data is only travel distance in 30 minutes from the city center. Additionally I wouldn’t see this as a functional map, but instead as just a translation of utilitarian data into art. I’d argue that maps as they are now work well and don’t need to change. The map went from paper and static to digital and interactive, like Google Maps. However, art pieces using maps are great case studies, as road maps are what we think of in architecture. They’re site-specific. They’re made by and for humans. There’s an organic randomness that’s very deliberate. That side of maps are a cool field to look into.
// Sara Frankel
// sfrankel
// Project 09 Portrait
// section A

var underlyingImage; //variable to help display the image being shown
var circx = 0; //circle starting position is 0,0
var circy = 0;

function preload() {
    var myImageURL = "https://i.imgur.com/a3mX8Atl.jpg";
    underlyingImage = loadImage(myImageURL); //loads the image into the variable provided
}

function setup() {
    createCanvas(480, 480);
    background(0);
    underlyingImage.loadPixels(); //loads image
    frameRate(10);
}

function draw() {
    var px = random(width);
    var py = random(height);
    var ix = constrain(floor(px), 0, width-1);
    var iy = constrain(floor(py), 0, height-1);
    var theColorAtLocationXY = underlyingImage.get(ix, iy);

    //strokeWeight(5);
    fill(theColorAtLocationXY);
    text("twins", px, py);//inserts text randomly to draw the image

    if (mouseIsPressed) {
    	var theColorAtPos = underlyingImage.get(circx, circy);
		fill(theColorAtPos);
		ellipse(circx, circy, 5, 5); //draws ellipse at circx and circy
		circx = (circx + 5) % width; //increments circx accross the row and goes back to 0 when it reaches width
		if (circx === 0) {
			circy += 5;// when circx reaches width, circy will increment
		}
	}

}
I chose to upload a picture of my sister and I. Being a fraternal twin, most of the time people do not believe or suspect that we are twins. At times, this can be quite fun to point out to people, but most of the time it is not. So I thought it would be ironic to use this picture of us in elementary school in such an abstract image that legitimately spells and draws out the truth with the text and circles. As when you press the canvas, ellipses will be drawn to almost “clearly” draw it out for you.
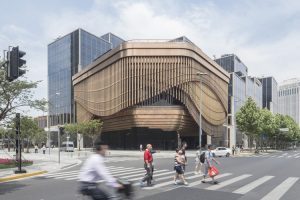
The Bund Finance Center combines traditional Chinese theatre and digital technology.
A Looking Outwards report that I found interesting and unfamiliar was the report by my peer Jacky Tian. Jacky’s first Looking Outwards report was about the Bund Finance Center in Shanghai China. This building inspired Jacky because it combines traditional Chinese elements with digital technology. Like Jacky, I am also interested in seeing environments that combine physical and digital spaces. Seeing architectural structures and pieces of art that combine physical and digital elements allow for more interaction with the people in the space. Digital technologies also allow people to have new, dynamic experiences and emotions that are not static and one dimensional. As I am continuing my education, I find that I am becoming more and more interested in discovering design and architecture that incorporate digital technology.
![[OLD FALL 2018] 15-104 • Introduction to Computing for Creative Practice](../../../../wp-content/uploads/2020/08/stop-banner.png)


